Abstract
We report a comparison of time to recovery, side effects, and change in blood counts from baseline to post-donation of unrelated donors who participated in the Blood and Marrow Transplant Clinical Trials Network (BMT CTN) phase III randomized, multicenter trial (0201) in which donor/recipient pairs were randomized to either peripheral blood stem cell (PBSC) or bone marrow (BM) donation. Of the entire cohort, 262 donated PBSC and 264 donated BM; 372 (71%) donors were from domestic and 154 (29%) from international centers (145 German and 9 Canadian). PBSC donors recovered in less time with a median time to recovery of 1 week compared to 2.3 weeks for BM donors. The number of donors reporting full recovery was significantly greater for donors of PBSC than of BM at 1, 2, and 3 weeks and 3 months post-donation. Multivariate analysis showed that PBSC donors were more likely to recover at any time post donation compared to BM donors (HR 2.08 [95% CI 1.73–2.50], p<0.001). Other characteristics that significantly increased the likelihood of complete recovery were being an international donor and donation in more recent years. Donors of BM were more likely to report grade 2–4 skeletal pain, body symptoms and fatigue at 1 week post donation. In logistic regression analysis of domestic donors only in which toxicities at peri-collection time points (day 5 filgrastim for PBSC donors and day 2 post-collection of BM donors) could be analyzed, no variable was significantly associated with grade 2–4 skeletal pain, including product donated (BM vs PBSC, OR 1.13 [95% CI 0.74–1.74], p=0.556). Blood counts were impacted by product donated, with mean change from baseline to post-donation being greater for white blood cells, neutrophils, mononuclear cells and platelets in PBSC donors whereas BM donors experienced a greater mean change in hemoglobin. This analysis provided an enhanced understanding of donor events as product donated was independent of physician bias or donor preference.
INTRODUCTION
Donors of peripheral blood stem cells (PBSC) or bone marrow (BM) for hematopoietic cell transplantation (HCT) for patients in need of this potentially life-saving therapy do so with the knowledge that side effects secondary to donation may occur for which a period of recovery will be required. It is our responsibility as a transplant community to provide donors with high quality information as to the potential side effects and anticipated time to recovery from donation in order for them to make an informed decision about donating.
The most common donor side effects previously reported include fatigue and skeletal pain; PBSC donors most often report bone pain during recombinant granulocyte colony-stimulating factor (G-CSF) administration, whereas BM donors report pain at the collection site and anesthesia-related pain sites [1–18]. However, reports of donor adverse events and recovery have varied by retrospective/prospective study design and inclusion of related and/or unrelated donors, as unrelated donors must meet strict criteria for donor eligibility. Furthermore, none of the previously reported unrelated donor event analyses was from a study where recipient/donor pairs were randomized.
The Blood and Marrow Transplant Clinical Trials Network (BMT CTN) completed a phase III randomized, multicenter trial (0201) comparing mobilized PBSC with BM from unrelated donors for transplantation in patients with hematologic malignancies in which donor/recipient pairs were randomized to donation of either PBSC or BM. For transplant recipients, there were no significant survival differences at 2 years between PBSC and BM transplantation [19]. Comparisons of donors’ time to recovery, side effects, and change in blood counts from baseline to post-donation by product source were secondary objectives. This trial facilitated the first direct comparison of prospectively enrolled unrelated donor/recipient pairs randomized to either PBSC or BM donation, permitting a new understanding of donor events associated with each type of donation, and are reported here.
METHODS
Study Design and Population
This investigation was a prespecified analysis of BMT CTN protocol 0201 (ClinicalTrials.gov identifier: NCT00075816) in which recipients were stratified by transplant center and disease risk, and randomly assigned in a 1:1 ratio to PBSC or BM transplantation. Enrollment began on March 31, 2004 and ended on September 9, 2009. The initial 65 PBSC and 67 BM donors in this study were also included in the Miller et al report [1]. Unrelated donors had to be 18 to 60 years of age, meet Food and Drug Administration criteria for donor eligibility, and give informed consent to randomization for either BM or PBSC collection. Donors had to have adequate peripheral venous access for leukapheresis or agree to placement of a central catheter. Donors who had previously donated for a transplant recipient had to be fully recovered from the prior donation. Exclusion criteria included: pregnancy or uninterruptible breastfeeding; known allergy to granulocyte-colony stimulating factor (G-CSF) or Escherichia coli-derived recombinant protein products; history of autoimmune disorder, deep vein thrombosis, iritis or episcleritis, or adverse reaction to anesthesia; platelet count less than 150,000 × 109/L at baseline evaluation; current treatment with lithium; presence of sickle hemoglobin; receiving experimental therapy or investigational agents. A protocol review committee appointed by the National Heart, Lung and Blood Institute approved the research protocol, which was also approved by the National Marrow Donor Program’s (NMDP) institutional review board and local institutional review boards.
Collection Processes
All PBSC collections were performed after mobilization with G-CSF, either subcutaneous filgrastim (United States and Canadian donor centers) or lenograstim (German donor centers), at a dose of 10 µg per kilogram of body weight per day for 5 days. The daily dose did not exceed 1200 µg /day; the protocol included provisions for dose reduction in the presence of high-grade symptoms. A single large-volume apheresis was performed on day 5 or two smaller-volume apheresis procedures on days 5 and 6. There was no additional, sixth dose of filgrastim or lenograstim administered in cases where a second PBSC collection was performed on day 6. Donors of BM arm received either general or regional (spinal or epidural) anesthesia with harvest by standard procedures. NMDP standards required that no more than 20 mL of marrow per kilogram donor weight be removed. Transfusion of stored autologous blood was in accordance with appropriate medical practice. The donation processes for donors randomized to PBSC were facilitated by 44 donor centers, 55 apheresis centers, and 1 BM collection center (for a donor randomized to PBSC who donated BM); for BM, donor processes were facilitated by 47 donor centers, 50 BM collection centers, and 8 apheresis centers (for 11 donors randomized to BM who donated PBSC). Reasons for donation of the non-randomized product included donor refusal, physician decision, or logistical issues with transplant/donor centers.
Data Collection
Data collection began at baseline, defined as the time of the donor’s medical evaluation to determine suitability to donate stem cells. Data collection for recovery and side effects was performed by telephone administered surveys using NMDP questionnaires. For only those PBSC donors in the United States (domestic centers), data collection also continued through each day of G-CSF. Both PBSC and BM donors, regardless of center location, were contacted by either the donor center or the NMDP survey research group (SRG) at 2 days and 1 week post-collection and then weekly thereafter until the donor reported full recovery from donation; donor questionnaires were also completed at 1, 6, 12 and 24 months post-collection.
Endpoints
The primary endpoint for this analysis was time from donation (defined as day 5 of GCSF for PBSC and day of harvest for BM) to report of complete recovery as judged by donor reports of return to baseline physical status and no ongoing or new symptoms associated with the collection procedure.
Secondary endpoints included: 1) severity of skeletal pain, defined as the maximum grade (grade 1 = mild, grade 2 = moderate, grade 3 = severe and grade 4= disabling pain) among these pain sites: back, bone, headache, hip, limb, joint or neck, and incidence of grade 2–4 pain at time points of 1 week, 1 and 6 months, and 1 and 2 years post-donation; 2) highest toxicity level and incidence of grade 2–4 body symptoms including fatigue, fever in the absence of signs of infection, skin rash, local-site reaction, nausea, vomiting, anorexia, insomnia, dizziness and syncope at 1 week, 1 and 6 months, and 1 and 2 years post-donation (as assessed by the National Cancer Institute’s Common Terminology Criteria for Adverse Events, version 3.0); incidence of grade 2–4 fatigue at 1 week, 1 and 6 months, and 1 and 2 years post-donation; 3) changes in counts of white blood cells (WBC), neutrophils, mononuclear cells, hemoglobin and platelets from baseline (prior to collection of autologous blood for BM donors) to post-donation time points of day of donation (day 5 for PBSC donors or day of BM collection) and 1, 6, 12 and 24 months post-donation. BM donor blood samples collected after transfusion of autologous or allogeneic red blood cells were excluded from the analysis of change in hemoglobin.
Statistical Analysis
Analyses were conducted using a modified intention-to-treat principle, in which potential donors who were randomized but did not actually donate were excluded from the analysis, while those who did donate were analyzed according to the group to which they were randomized, regardless of what product they donated. Donor- and collection-related variables were compared between donor groups using the Chi-square test for categorical variables and the Kruskal-Wallis test for continuous variables. If a subsequent donation occurred, all outcomes were censored at the time of second donation, which was counted as day 1 of G-CSF administration for PBSC and the day of second collection for BM.
Probabilities of complete recovery from donation were calculated using the Kaplan-Meier estimator and compared between the groups using the log-rank test. Chi-squared tests were used to compare the incidence of grade 2–4 bone pain and symptoms at each time point between PBSC and BM donors. Mean changes in donor WBC, neutrophils, mononuclear cells, hemoglobin and platelets from baseline to each post-donation time point were compared between the PBSC and BM groups using a 2-sample t-test.
Multivariate models were constructed for time to complete recovery from donation using Cox proportional hazards models. Multivariate logistic regression models were constructed for incidence of grade 2–4 bone pain and symptoms at 1 week. All models were adjusted for randomized product, age (18–29, 30–44, ≥45 years) and gender, which have been identified in previous analyses as important for donor outcomes [3, 5], and location of donor center (domestic vs. international [Canada and Germany]) when there were events occurring in both domestic and international donors. Stepwise regression was used to identify any additional factors to be included in the model. Variables considered included race (Caucasian vs. non-Caucasian), donor body mass index (BMI) (normal weight vs. overweight vs. obese), cytomegalovirus (CMV) serostatus and year of donation (2004–2005 vs. 2006–2007 vs. 2008–2009).
A subset analysis of study endpoints (except for changes in blood counts) was performed for domestic donors only. This analysis permitted a comparison of peak severity of skeletal pain and body symptoms at peri-collection time points, defined as day 5 G-CSF administration for PBSC donors and day 2 post-BM donation.
RESULTS
Donor Characteristics
Table 1 shows the characteristics of all donors, and domestic donors only, where a donation occurred by randomized product. Donor characteristics were similar between donors of PBSC or BM.
Table 1.
Characteristics of all donors, and domestic donors only, where a donation occurred, by randomized product
| All Donors | Domestic Donors | |||||
|---|---|---|---|---|---|---|
| PBSC | Bone Marrow | PBSC | Bone Marrow | |||
| Variable | N (%) | N (%) | p-valuea | N (%) | N (%) | p-valuea |
| Number of donors | 262 | 264 | 182 | 190 | ||
| Donated non-randomized product | 1 | 11 | 1 | 8 | ||
| Timing of donation | ||||||
| First | 255 | 254 | 175 | 180 | ||
| Second | 7 | 10 | 7 | 10 | ||
| Number of donor centers | 44 | 47 | 42 | 45 | ||
| Number of apheresis centers | 55 | 8 | 53 | 7 | ||
| Number of collection centers | 1 | 50 | 1 | 48 | ||
| Donor sex | 0.077 | 0.107 | ||||
| Female | 88 (34) | 70 (27) | 69 (38) | 57 (30) | ||
| Male | 174 (66) | 194 (73) | 113 (62) | 133 (70) | ||
| Donor age at donation, years | 0.058 | 0.076 | ||||
| 18 to 29 | 99 (38) | 111 (42) | 65 (36) | 71 (37) | ||
| 30 to 44 | 115 (44) | 124 (47) | 76 (42) | 93 (49) | ||
| 45 or older | 48 (18) | 29 (11) | 41 (23) | 26 (14) | ||
| Median (Range) | 34 (19–60) | 33 (19–61) | 0.097 | 34 (19–60) | 34 (19–61) | 0.297 |
| Donor race | 0.375b,c | 0.368b,c | ||||
| Caucasian | 230 (88) | 224 (85) | 151 (83) | 150 (80) | ||
| Hispanic | 11 (4) | 12 (5) | 10 (6) | 12 (6) | ||
| Black/African American | 7 (3) | 8 (3) | 7 (4) | 8 (4) | ||
| Asian/Pacific Islander | 4 (2) | 4 (2) | 4 (2) | 4 (2) | ||
| American Indian/Alaska Native | 2 (1) | 2 (1) | 2 (1) | 2 (1) | ||
| Other/Multiple Race | 7 (3) | 12 (5) | 7 (4) | 12 (6) | ||
| Decline/Unknown | 1 NA | 2 NA | 1 N/A | 2 N/A | ||
| Donor BMI, kg/m2 | 0.303b,d | 0.365b,d | ||||
| Underweight (<18.5) | 3 (1) | 0 | 2 (1) | 0 | ||
| Normal (18.5–24.9) | 99 (38) | 86 (33) | 59 (32) | 52 (27) | ||
| Overweight (25–29.9) | 85 (32) | 98 (37) | 56 (31) | 69 (36) | ||
| Obese (30+) | 75 (29) | 79 (30) | 65 (36) | 69 (36) | ||
| Unknown | 0 N/A | 1 N/A | 0 N/A | 0 N/A | ||
| Median (Range) | 26.8 (17.8–44.9) | 27.0 (18.9–48.5) | 0.235 | 27.6 (17.8–44.9) | 27.9 (19.0–48.5) | 0.312 |
| Donor weight, kg | ||||||
| Median (Range) | 82 (47–142) | 85 (54–144) | 0.053 | 85 (47–142) | 87 (55–144) | 0.066 |
| Donor cytomegalovirus | 0.508b | |||||
| Nonreactive | 175 (68) | 184 (71) | 116 (64) | 127 (67) | ||
| Reactive | 81 (32) | 75 (29) | 66 (36) | 63 (33) | 0.529 | |
| Unknown | 6 N/A | 5 N/A | 0 N/A | 0 N/A | ||
| Year of donation | 0.608 | 0.909 | ||||
| 2004 | 16 (6) | 14 (5) | 16 (9) | 14 (7) | ||
| 2005 | 36 (14) | 44 (17) | 34 (19) | 42 (22) | ||
| 2006 | 50 (19) | 47 (18) | 37 (20) | 32 (17) | ||
| 2007 | 70 (27) | 70 (27) | 48 (26) | 53 (28) | ||
| 2008 | 62 (24) | 51 (19) | 31 (17) | 31 (16) | ||
| 2009 | 28 (11) | 38 (14) | 16 (9) | 18 (9) | ||
| Baseline WBC, ×109/L | ||||||
| Median (Range) | 6.6 (2.5–11.5) | 6.3 (2.8–12.8) | 0.062 | 6.6 (2.5–11.5) | 6.4 (2.8–12.8) | 0.098 |
| Baseline platelets, ×109/L | ||||||
| Median (Range) | 258 (153–409) | 249 (144–447) | 0.180 | 257 (153–409) | 248 (147–447) | 0.281 |
| Baseline hemoglobin-Male, g/dL | ||||||
| Median (Range) | 15.3 (9.3–17.1) | 15.2 (12.8–17.8) | 0.753 | 15.4 (11.0–17.1) | 15.4 (12.8–17.8) | 0.881 |
| Baseline hemoglobin-Female, g/dL | ||||||
| Median (Range) | 13.4 (10.7–15.2) | 13.3 (11.4–15.4) | 0.950 | 13.5 (11.5–15.2) | 13.3 (11.5–15.4) | 0.746 |
| Baseline neutrophils, ×109/L | ||||||
| Median (Range) | 4.2 (1.3–7.8) | 4.0 (1.8–10.3) | 0.033 | 4.2 (1.3–7.5) | 4.0 (1.8–10.3) | 0.055 |
| Baseline mononuclear cells, ×109/L | ||||||
| Median (Range) | 2.3 (1.1–5.2) | 2.3 (0.7–4.7) | 0.227 | 2.3 (1.1–5.2) | 2.3 (0.7–4.3) | 0.150 |
Abbreviations: BMI = body mass index; PBSC = peripheral blood stem cells; N = number; N/A = not available; WBC = white blood cell
The Pearson chi-square test was used for comparing discrete variables; the Kruskal-Wallis test was used for comparing continuous variables.
Test performed excluding the donors in the unknown category
Test performed for Caucasian vs. Other
Test performed for Underweight/Normal vs. Overweight vs. Obese
For the entire cohort of 526 donors, 262 were PBSC donors and 264 BM donors. One donor randomized to PBSC and 11 to BM ultimately donated the alternate non-randomized product. Of the 526 donors, 372 (71%) were from domestic and 154 (29%) from international centers (145 German and 9 Canadian). Of the 372 domestic donors, 182 were PBSC and 190 BM donors; 1 donor randomized to PBSC and 8 to BM ultimately donated the alternate nonrandomized product. The majority of donors were donating for the first time. Most donors were Caucasian males and were of similar age by donated product. Donor BMI was distributed relatively evenly among normal, overweight and obese categories and was similar by donated product. The majority of donors were CMV serostatus nonreactive. The number of donations were similar by year of donation. Median baseline blood count values were comparable, with the exception of median number of neutrophils being higher in the PBSC group for the entire cohort.
The number of international donors increased during study enrollment. In 2004–2005 there were 4 international and 106 domestic donors; 2006–2007 included 67 international and 170 domestic donors, and 2008–2009, 83 international and 96 domestic donors. International donors were more likely to be younger (median age 32 years for PBSC; 29 years for BM), of male gender (76% PBSC; 82% BM), have a lower BMI (median 25.0 kg/m2 PBSC; 25.2 kg/m2 BM) and lower median weight (79 kg PBSC; 81 kg BM), be CMV non-reactive (80% PBSC; 83% BM), and all but one were Caucasian.
Time to Complete Recovery
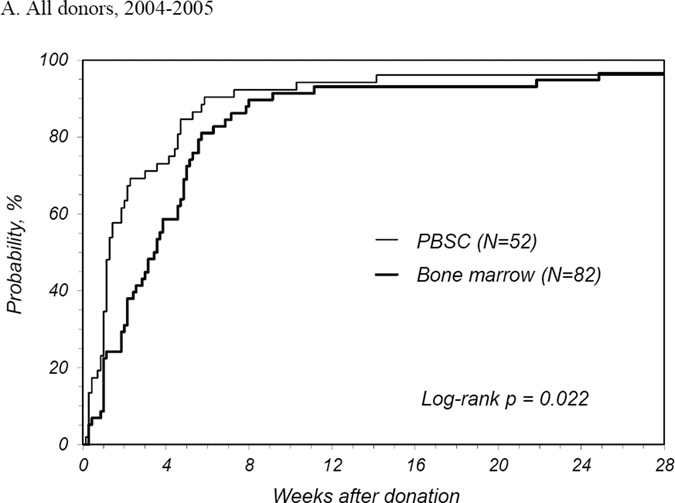
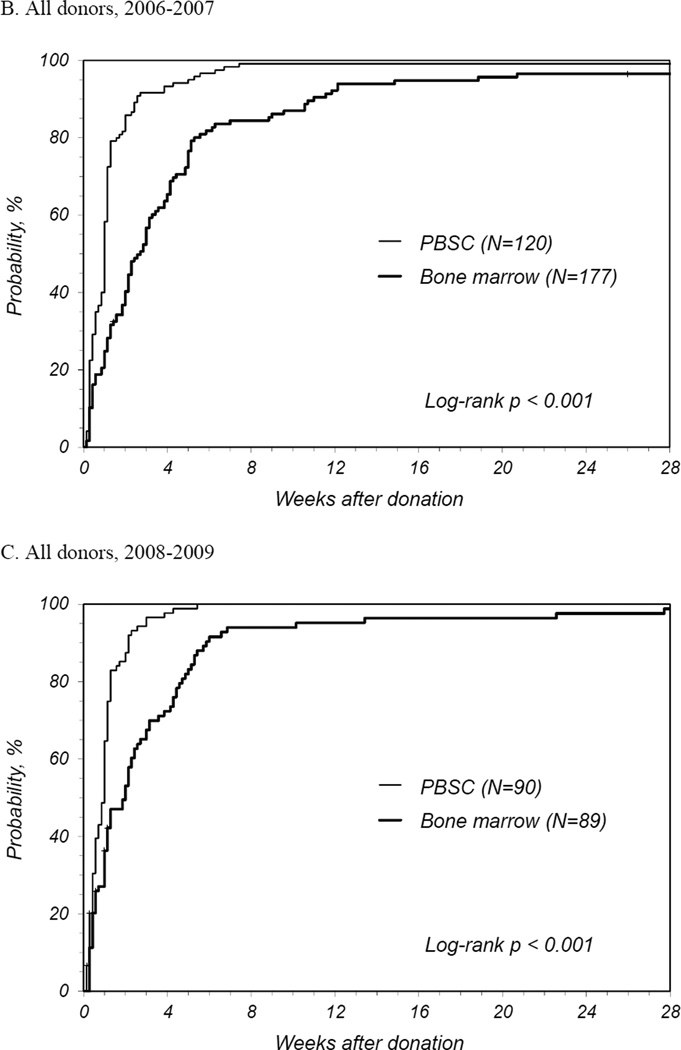
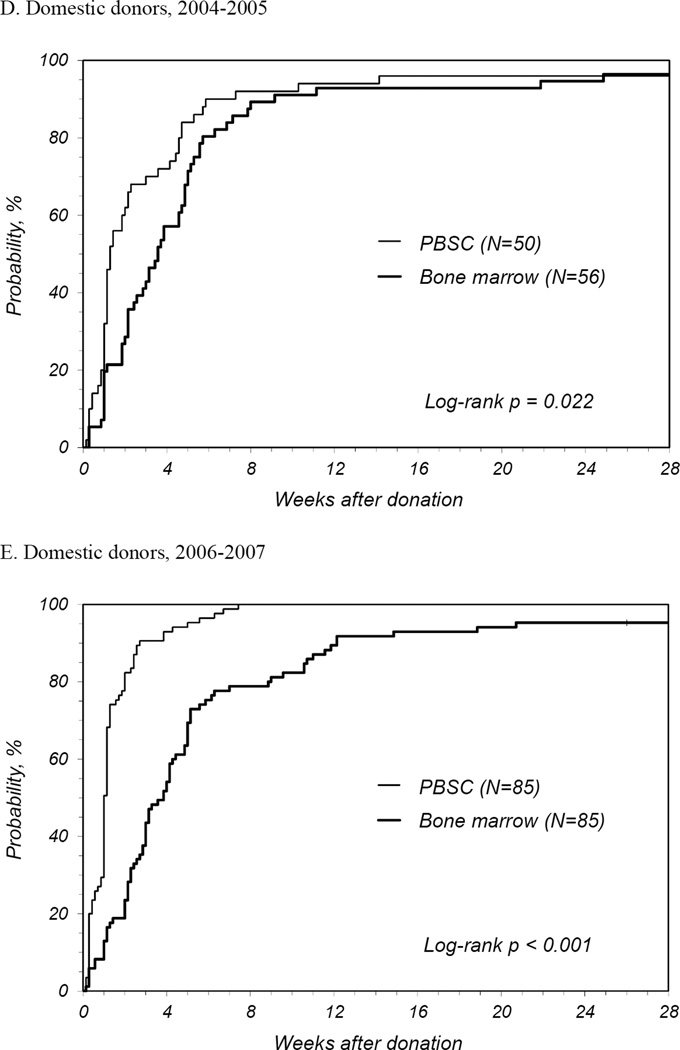
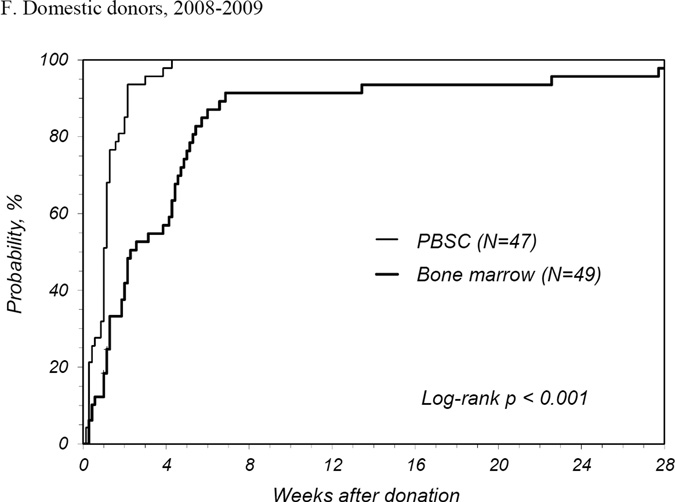
PBSC donors recovered in less time than BM donors with a median time to recovery of 1 week for PBSC donors compared to 2.3 weeks for BM donors (Table 2). The number of donors reporting full recovery was significantly different by randomized product at 1, 2, and 3 weeks and 3 months post-donation. It was not until 6 months post-donation that the probability of full recovery was similar. The median time to recovery for first time donors was similar to that all donors. At 2 years post donation, 1 PBSC donor reported ongoing fatigue and dizziness and 2 BM donors reported persistent back, hip and/or leg discomfort. International donors recovered more quickly than domestic donors for both products: for PBSC, international donors recovered at a median of 0.6 weeks and domestic a median of 1.1 weeks (p<0.001); for BM, international donors at a median of 0.9 weeks and domestic a median of 3.3 weeks (p<0.001). Multivariate analysis showed that PBSC donors were more likely to recover at any time post donation compared to BM donors (HR 2.08 [95% CI 1.73–2.50], p<0.001) (Table 3). Other characteristics that significantly increased the likelihood of complete recovery were being an international donor and donation in more recent years. Likewise, randomized product and donation year were significant factors for recovery of domestic donors. Probabilities of complete recovery for all donors by randomized product by year are shown in Figures 1A, B and C, and for domestic donors only in Figures 1D, E, and F.
Table 2.
Univariate probabilities of complete recovery from donation by randomized product
| PBSC | Bone Marrow | Pointwise | |||
|---|---|---|---|---|---|
| Recovery | N | Prob (95% CI) | N | Prob (95% CI) | p-value |
| All donors | 262 | 264 | <0.001a | ||
| @ 1 week | 56 (50–62) | 28 (23–34) | <0.001 | ||
| @ 2 weeks | 82 (77–86) | 42 (37–48) | <0.001 | ||
| @ 3 weeks | 89 (85–93) | 58 (52–64) | <0.001 | ||
| @ 3 months | 98 (97–100) | 94 (91–97) | 0.009 | ||
| @ 6 months | 99 (97–100) | 97 (94–99) | 0.123 | ||
| @ 1 year | 100 (98–100) | 98 (96–99) | 0.086 | ||
| @ 2 years | 100 (98–100) | 98 (96–99) | 0.086 | ||
| Median time to complete recovery among donors who completely recovered | 1 week | 2.3 weeks | |||
Abbreviations: CI = Confidence interval; Prob = Probability (%); N = number
Log-rank p-value
Table 3.
Cox regression model for donor recovery, all donors and domestic donors only
| All Donors | Domestic Donors | |||||||
|---|---|---|---|---|---|---|---|---|
| Variable | N | HR | 95% CI | p-value | N | HR | 95% CI | p-value |
| Randomized product | ||||||||
| Bone marrow | 264 | 1.00 | 182 | 1.00 | ||||
| PBSC | 262 | 2.08 | (1.73–2.50) | <0.001 | 190 | 2.62 | (2.10–3.28) | <0.001 |
| Donor sex | ||||||||
| Female | 158 | 1.00 | 126 | 1.00 | ||||
| Male | 368 | 1.00 | (0.82–1.21) | 0.997 | 246 | 1.01 | (0.80–1.27) | 0.932 |
| Donor age at donation, years | 0.252 | 0.385 | ||||||
| 18 to 29 | 210 | 1.00 | 136 | 1.00 | ||||
| 30 to 44 | 239 | 0.86 | (0.71–1.04) | 0.117 | 169 | 0.88 | (0.70–1.11) | 0.288 |
| 45 or older | 77 | 0.85 | (0.65–1.13) | 0.267 | 67 | 1.06 | (0.77–1.45) | 0.725 |
| Year of donation | 0.035 | <0.001 | ||||||
| 2004–2005 | 110 | 1.00 | 106 | 1.00 | ||||
| 2006–2007 | 237 | 1.23 | (0.97–1.56) | 0.082 | 170 | 1.38 | (1.07–1.77) | 0.0.013 |
| 2008–2009 | 179 | 1.42 | (1.09–1.85) | 0.01 | 96 | 1.74 | (1.30–2.32) | <0.001 |
| Donor center | ||||||||
| Domestic | 372 | 1.00 | ||||||
| International | 154 | 1.92 | (1.55–2.38) | <0.001 | ||||
Abbreviations: CI = Confidence interval; HR = Hazard ratio
Figure 1.
Probability of complete recovery by donation of peripheral blood stem cells (PBSC0 or bone marrow (BM). (A) All donors, 2004–2005. (B) All donors, 2006–2007. (C) All donors, 2008–2009. (D) Domestic donors, 2004–2005. (E) Domestic donors, 2006–2007. (F) Domestic donors, 2008–2009.
Skeletal Pain
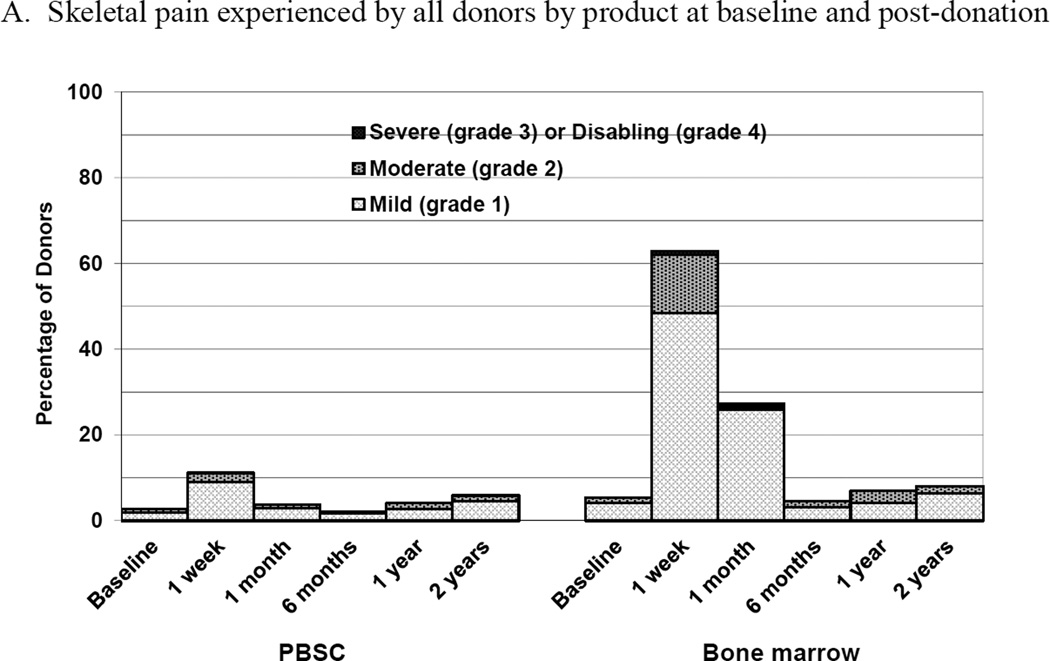
Donors of BM were more likely to experience skeletal pain than donors of PBSC at 1 week and 1 month post donation (Figure 2A). Overall the incidence of grade 2–4 pain was quite low for all donors. At 1 week post donation, 5 (2%) PBSC donors experienced grade 2–4 pain compared to 32 (14%) BM donors with grade 2–4 pain (p<0.001). There were no differences in the reported incidence of grade 2–4 bone pain by donor characteristics except that non-Caucasian donors of BM were more likely to report pain than Caucasian donors (34% compared to 11%, respectively, p=0.002). By 1 month post- donation and for all time points to 2 years post-donation, there were no differences in grade 2–4 pain by donated product, with the incidence of grade 2–4 bone pain being ≤1% for PBSC and <3% for BM at all time points. In logistic regression analysis, the only variable significantly associated with grade 2–4 skeletal pain at 1 week was product donated (BM vs. PBSC, OR 7.52 [95% CI 2.84–19.89], p<0.001).
Figure 2.
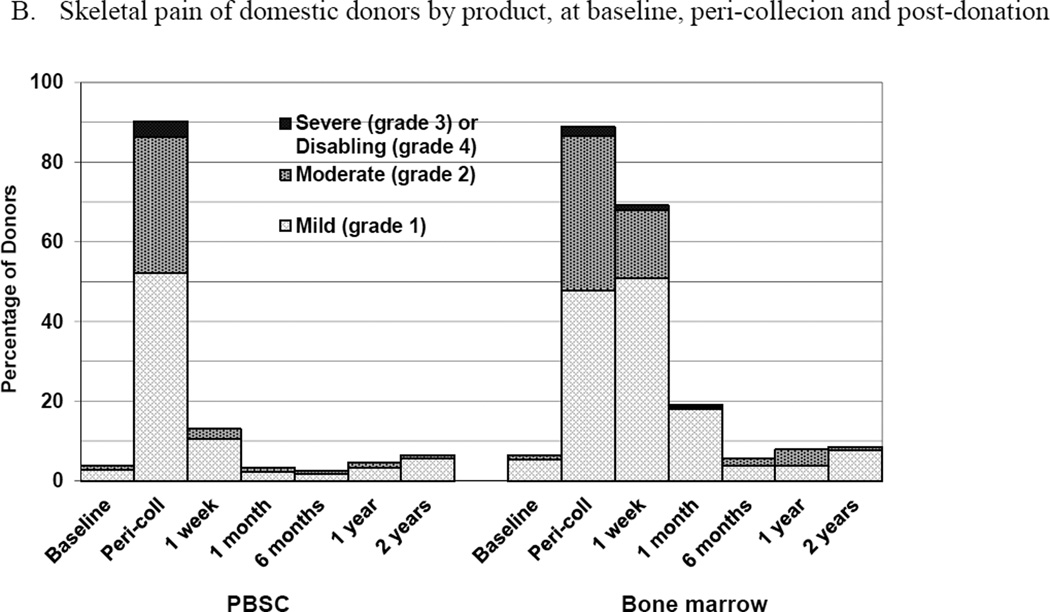
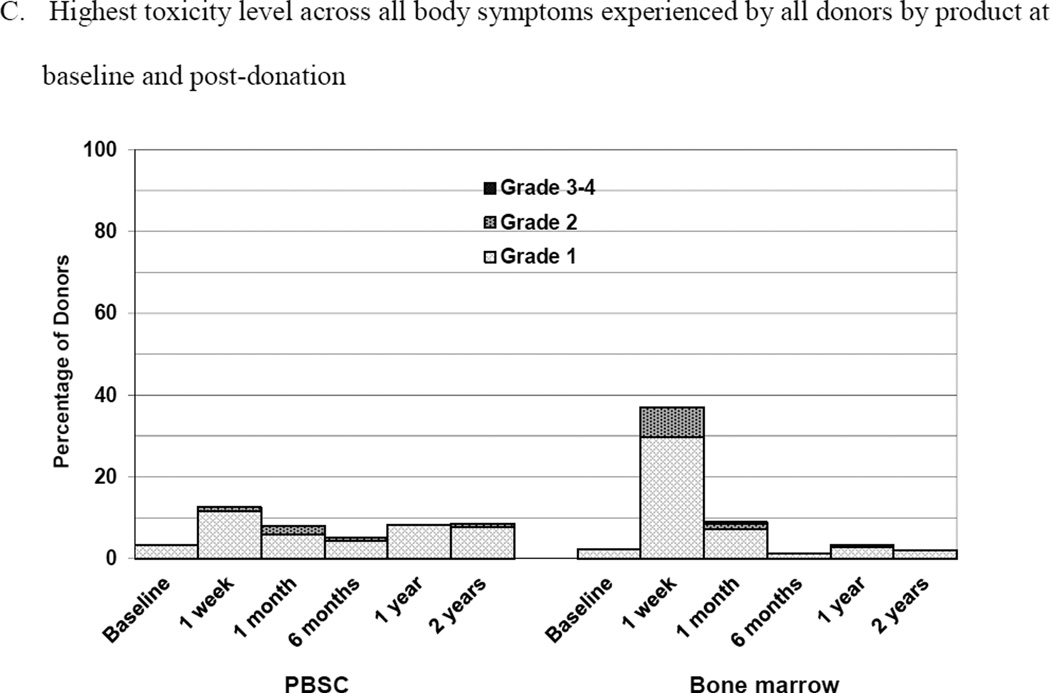
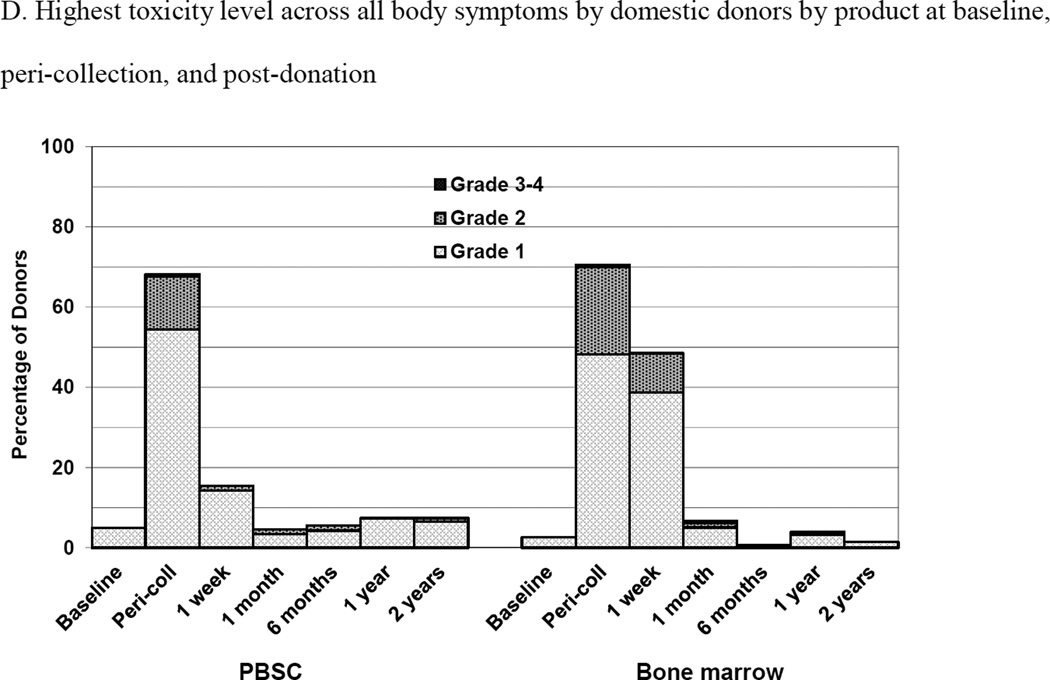
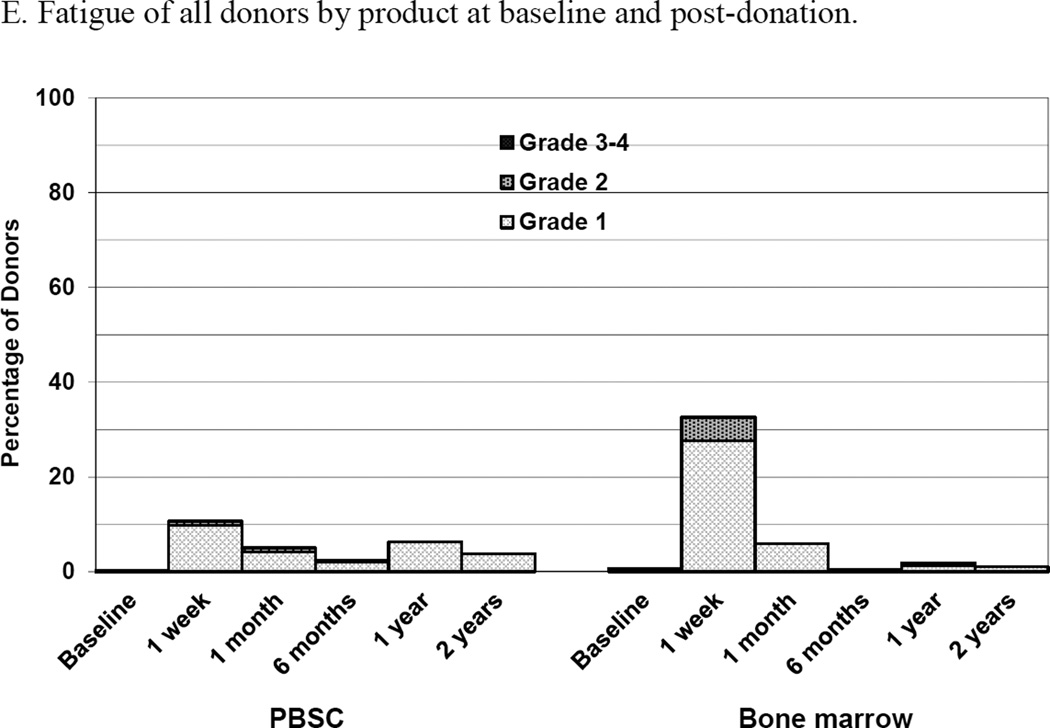
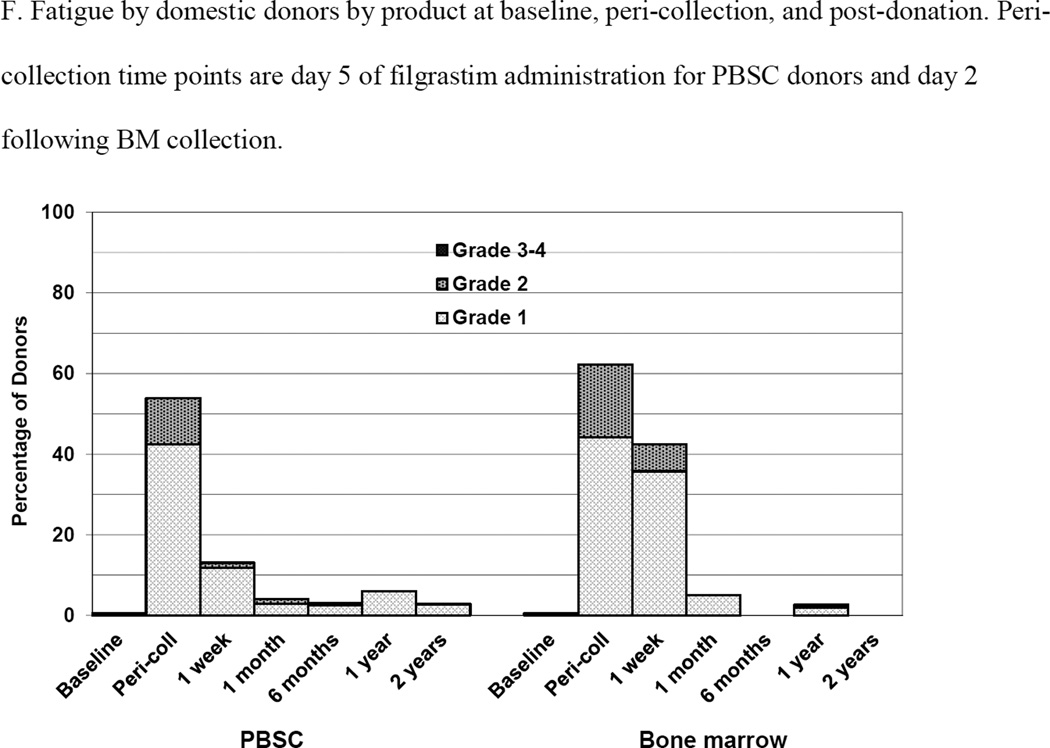
Skeletal pain and body symptoms by donation of peripheral blood stem cells (PBSC) or bone marrow. (A) Skeletal pain experienced by all donors by product at baseline and post-donation. (B) Skeletal pain of domestic donors by product at baseline, peri-collection and post-donation. (C) Highest toxicity level across all body symptoms experienced by all donors by product at baseline and post-donation. (D) Highest toxicity level across all body symptoms by domestic donors by product at baseline, peri-collection, and post-donation. (E) Fatigue of all donors product at baseline and post-donation. (F) Fatigue by domestic donors by product at baseline, peri-collection, and post-donation. Peri-collection time points are day 5 of filgrastim administration for PBSC donors and day 2 following BM collection.
The subset analysis of domestic donors permitted an evaluation of skeletal pain at peri-collection time points (Figure 2B). On day 5 of filgrastim administration, 95 (52%), 62 (34%), 7 (4%) and 0 PBSC donors experienced grades 1, 2, 3, and 4 pain, respectively. At day 2 following BM collection, 90 (48%), 73 (39%), 4 (2%) and 0 donors experienced grades 1, 2, 3, and 4 pain, respectively. There were no differences in grade 2–4 (p=0.595) or grade 3–4 pain (p=0.374) by donated product at the peri-collection time points. Male donors of BM were more likely than females to experience grade 2–4 pain (p = 0.016). In logistic regression analysis, no variable was significantly associated with grade 2–4 pain at the peri-collection time points, including product donated (BM vs PBSC, OR 1.13 [95% CI 0.74–1.74], p=0.556); at 1 week, the only variable significantly associated with grade 2–4 skeletal pain in domestic donors was product donated (BM vs. PBSC, OR 8.82 [95% CI 3.8401–25.90], p<0.001).
Body Symptoms
At 1 week following donation, 2 (1%) of PBSC donors reported grade 2–4 body symptoms compared to 16 (7%) of BM donors (p<0.001) (Figure 2C). There were no differences in the reported incidence of grade 2–4 body symptoms by any donor characteristic. Fatigue was more commonly reported by BM than PBSC donors at 1 week (2 [1%] PBSC and 11 [5%] BM donors, p = 0.010) (Figure 2E). There were no reports of grade 3 or 4 fatigue by donors in either group. In logistic regression analysis, variables significantly associated with grade 2–4 body symptoms at 1 week were product donated (BM vs. PBSC, OR 10.69 [95% CI 2.36–48.37], p = 0.002) and age. Donors 30–44 years of age were more likely to report grade 2–4 symptoms than younger (age 18–29 years) donors (OR 6.82 [95% CI 1.45–31.97], p = 0.015). Likewise, variables associated with grade 2–4 fatigue at 1 week were product donated (BM vs. PBSC, OR 6.71 [95% CI 1.44–31.17], p=0.015) and age. Donors 30–44 years were more likely to report grade 2–4 fatigue than younger (age 18–29 years) donors (OR 9.71 [95% CI 1.22–77.13], p = 0.031).
Body symptoms and fatigue for domestic only donors are shown in Figures 2D and 2F, respectively. On day 5 of filgrastim administration, 99 (54%), 24 (13%), 1 (1%) and 0 PBSC donors experienced grades 1, 2, 3, and 4 body symptoms, respectively. At day 2 post collection, 90 (48%), 41 (22%), 1 (1%) and 0 BM donors experienced grades 1, 2, 3, and 4 body symptoms, respectively. On day 5 of filgrastim administration, 77 (42%) and 21 (12%) of PBSC donors experienced grades 1 and 2, fatigue, respectively. At day 2 post collection, 83 (44%) and 34 (18%) BM donors experienced grades 1 and 2 fatigue, respectively. In logistic regression analysis, donors of BM were more likely to experience grade 2–4 body symptoms at peri-collection time points (BM vs. PBSC, OR 1.95 [95% CI 1.11–3.44], p =0.02, whereas male donors were less likely (OR 0.48 [95% CI 0.27–0.84], p=0.011) as were donors in more recent years (2006–2004, OR 0.34 [95% CI 0.15–0.65], p<0.001; 2008–2009, OR 0.38 [95% CI 0.18–0.79], p=0.009). At 1 week, donors of BM were more likely to experience grade 2–4 body symptoms (BM vs. PBSC, OR 8.73 [95% CI 1.94–39.36], p = 0.005) as were donors 31–44 years of age compared with younger donors (age 18–30 years) (OR 6.07 [95% CI 1.33–27.68], p=0.02). Donors in more recent years were less likely to experience grade 2–4 fatigue at peri-collection time points (2006–2004, OR 0.33 [95% CI 0.17–0.64], p=0.001; 2008–2009, OR 0.27 [95% CI 0.12–0.62], p=0.002) but randomized product had no impact. At 1 week post-donation, BM donors (BM vs. PBSC, OR 5.60 [95% CI 1.20–26.18], p = 0.028) and donors 31–45 years were more likely than donors 18–30 years (OR 8.39 [95% CI 1.05–66.95], p = 0.045) to experience grade 2–4 fatigue.
Hematologic Parameters
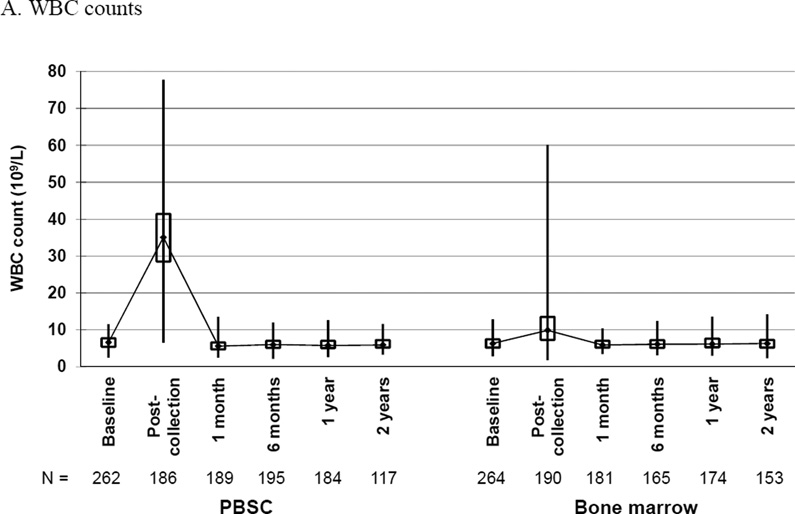
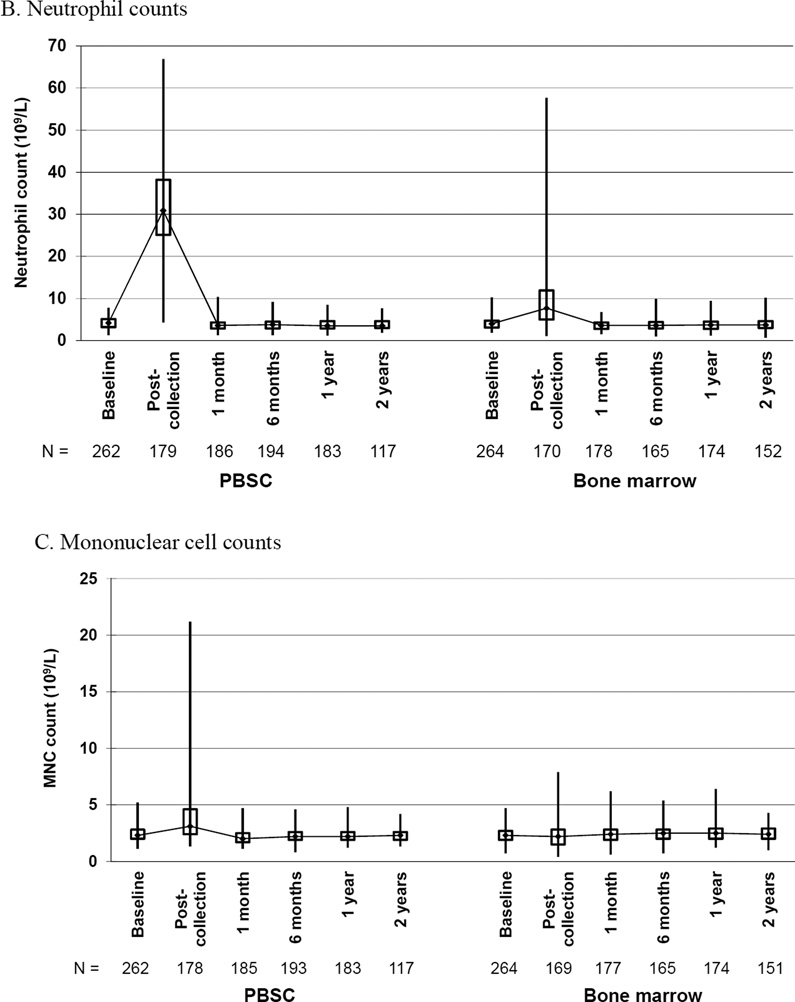
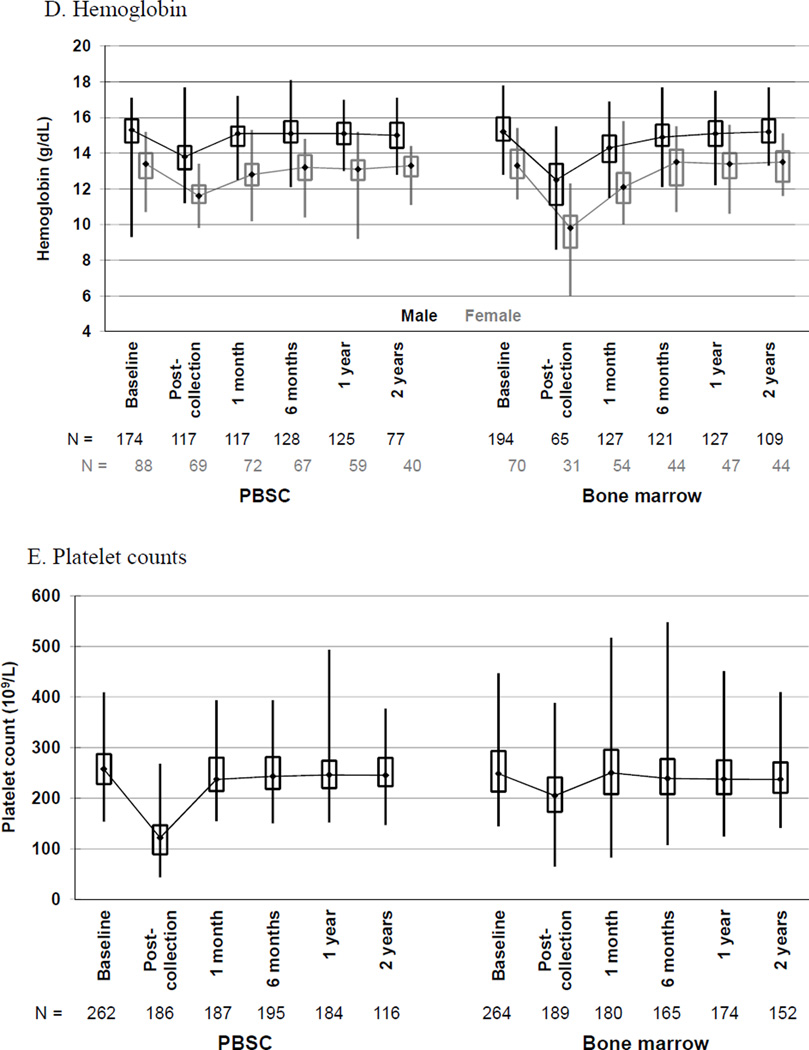
Changes in hematologic parameters from baseline to 2 years post-donation by donated product are shown in Figure 3. The comparison of mean changes in blood counts from baseline to post-donation on day of collection is shown in Table 4.
Figure 3.
Box and whiskers plots of (A) white blood cell (WBC) counts, (B) neutrophil counts, (C) mononuclear cell counts, (D) hemoglobin and (E) platelet counts, by randomized product of peripheral blood stem cells (PBSC) or bone marrow, showing the maximum, upper quartile, median, lower quartile, and minimum values at baseline and the indicated time post-donation: day of collection, 1 and 6 months, 1 and 2 years.
Table 4.
Changes in hematologic parameters from baseline to post-donation on the day of collection
| PBSC | Bone Marrow | Difference | |||||
|---|---|---|---|---|---|---|---|
| Blood cell counts | N | Mean | N | Mean | Mean | 95% CI | p-value |
| WBC, ×109/L | 186 | 29.51 | 190 | 5.09 | 24.41 | (22.58,26.25) | <0.001 |
| Neutrophils, ×109/L | 179 | 28.02 | 170 | 5.40 | 22.63 | (20.78,24.47) | <0.001 |
| Mononuclear cells, ×109/L | 178 | 1.38 | 169 | −0.14 | 1.53 | (1.18,1.87) | <0.001 |
| Hemoglobin, g/dL* | |||||||
| Male | 117 | −1.67 | 65 | −3.01 | 1.34 | (0.96,1.71) | <0.001 |
| Female | 69 | −1.85 | 31 | −3.86 | 2.01 | (1.45,2.57) | <0.001 |
| Platelets, ×109/L | 186 | −136.90 | 189 | −46.88 | 90.04 | (99.17,−80.91) | <0.001 |
Abbreviations: CI = Confidence interval; WBC = white blood cell
BM donor blood samples collected after transfusion of autologous or allogeneic red blood cells were excluded from the analysis of post-collection hemoglobin.
By day 5 of filgrastim or lenograstim injections, PBSC donors had a marked increase in WBC counts from a median baseline of 6.6 × 10⁹/L (interquartile range of 5.4–7.7) to a median of 39.4 × 10⁹/L (interquartile range 33.0–46.8) on day 5 pre-apheresis and 35.6 × 10⁹/L (interquartile range 29.4 – 43.3) post-apheresis (Figure 3A). The median baseline for BM donors was 6.3 × 10⁹/L (interquartile range 5.2–7.4) with a post-donation on day of harvest median of 9.9 × 10⁹/L (interquartile range 7.3–13.5). WBC counts returned to baseline values by 1 month post-donation for both groups. The mean change in WBC count from baseline to post donation was significantly greater for PBSC than BM donors.
Likewise, PBSC donors had a marked increase in neutrophil counts from a median baseline of 4.2 × 10⁹/L (interquartile range 3.2–5.1) to a median of 32.5 × 10⁹/L (interquartile range 25.8–39.8) on day 5 pre-apheresis and 31.6 × 10⁹/L (interquartile range 26.2–39.2) post-apheresis (Figure 3B). The median baseline for BM donors was 4.0 × 10⁹/L (interquartile range 3.1–4.7) with a post-donation on day of harvest median of 7.7 × 10⁹/L (interquartile range 5.0–11.9). Neutrophil counts returned to baseline values by 1 month post-donation for both groups. The mean change in neutrophil count from baseline to post donation was significantly greater for PBSC than BM donors.
PBSC donors had an increase in mononuclear cell counts from a median baseline of 2.3 × 10⁹/L (interquartile range 2.0 –2.8) to a median of 6.0 × 10⁹/L (interquartile range 4.8–7.5) on day 5 pre-apheresis and 3.5 × 10⁹/L (interquartile range 2.6–4.9) post-apheresis (Figure 3C). The median baseline for BM donors was 2.3 × 10⁹/L (interquartile range 1.9–2.7) with a post-donation on day of harvest median of 2.2 × 10⁹/L (interquartile range 1.5–2.8). Mononuclear cell counts returned to baseline values by 1 month post-donation for both groups. The mean change in mononuclear cell count from baseline to post donation was significantly greater for PBSC than BM donors.
Hemoglobin values were affected more by donation of BM than PBSC (Figure 3D). For donors of PBSC, the median baseline hemoglobin values were 15.3 gm/dl for males (interquartile range 14.6–15.9) and 13.3 g/dl for females (interquartile range 12.6–14.0). For males, day 5 pre-apheresis and post-apheresis values were 15.1 gm/dl (interquartile range 14.3–15.7) and 13.9 gm/dl (interquartile range 13.1–14.4), respectively. For females, day 5 pre-apheresis and post-apheresis median values were 13.0 gm/dl (interquartile range 12.6–13.7) and 11.7 gm/dl (interquartile range 11.2–12.1 respectively. For donors of BM, the median baseline hemoglobin values were 15.2 gm/dl (interquartile range 14.7–16.0) for males and 13.3 gm/dl (interquartile range 12.6–14.2) for females; post-collection values were 12.5 gm/dl (interquartile range 11.1–13.4) for males and 9.8 gm/dl (interquartile range 8.7–10.5) for females. Donors who received transfusion of red blood cells were excluded from the analysis of post-collection hemoglobin. For both males and females, hemoglobin values returned to baseline values by 1 month post-donation for PBSC donors, and in 6 months for donors of BM. The mean change in hemoglobin from baseline to post donation was significantly greater for BM than PBSC donors of both genders.
Platelet counts were affected more by collection of PBSC than BM (Figure 3E). The median platelet counts of PBSC donors at baseline was 258 × 109/L (interquartile range 228–287) and pre-apheresis day 5 median was 242 × 109/L (interquartile range 207–281), falling to a median of 130 × 109/L (interquartile range 110–154) post-apheresis day 5. For 46 evaluable donors who underwent apheresis on day 6, the median post platelet count was 97 × 109/L (interquartile range 78–134). In contrast, the BM baseline platelet count was a median of 249 × 109/L (interquartile range 213–293) with post collection of 205 × 109/L (interquartile range 173–241). For both groups, platelet counts returned to baseline values at 1 month post-donation. The mean change in platelet count from baseline to post donation was significantly greater for PBSC than BM donors.
DISCUSSION
The results of this analysis showed that donors of PBSC recovered more quickly than did donors of BM, yet comparable recovery occurred by 6 months post donation. Donors of both products experienced skeletal pain and body symptoms, but the timing of peak severity differed by randomized product. Hematologic parameters also differed by product donated, with greater reductions in hemoglobin in donors of BM and of platelets in donors of PBSC. This study, the first direct comparison of time to recovery, side effects and changes in blood counts of prospectively enrolled donor/recipient pairs randomized to PBSC or BM product, confirmed and substantially extended previous reports of NMDP donors’ experiences [1–5].
Time to recovery of PBSC donors was 1 week, similar to that reported by Miller et al for NMDP donors who donated from November 2001 through March 2006 [1]; in contrast, BM donors recovered more quickly, at a median of 2.3 weeks, compared to a median of 3 weeks in the Miller report. International donors of both PBSC and BM recovered more quickly than did domestic donors. Likewise, in a recent analysis of 275 PBSC and 37 BM consecutive Anthony Nolan Registry donors, the median time to recovery was quite short for both products, being only 3 days for PBSC and 10 days for BM donors [20]. However, it is important to note that our study was limited by both the smaller proportion of international donors and that only two international donor centers participated, restricting the generalizability of our findings. We hypothesize that time to recovery may be impacted by donor characteristics, cultural style differences in asking the survey questions as well as cultural differences in an individual’s assessment of their own recovery and side effects. When adjusted for location of donor center, only the randomized product and year of collection impacted recovery. Donors in more recent years of the study recovered more quickly – whether this reflects donor centers’ increasing technical expertise, experience with care of donors participating on the trial or differences in general supportive care over time is not known. Predonation health-related quality of life scores were the strongest predictors of time to recovery in stem cell donors of unrelated donors of PBSC or BM from the United Kingdom [20]. Although a prespecified subgroup analysis of BMT CTN 0201 examined the physical and psychosocial experiences of 335 of the PBSC and BM donors (Department of Defense, German Registry and non-English speaking donors were excluded), the impact of predonation quality of life scores on time to recovery was not an objective of that analysis [21].
While BM donors were more likely to experience skeletal pain at 1 week and 1 month than donors of PBSC, it is important to note that the majority of BM donors reported mild to moderate pain. The incidence of grade 2–4 pain was quite low for all donors, consistent with prior reports (1–3). Non-Caucasian donors of BM were more likely to report grade 2–4 pain, which is similar to the report by Shaw et al in which a higher incidence of grade 2–4 skeletal pain on day 2 after BM collection in black males was noted [5]. Also as expected, skeletal pain was most likely to occur at peri-collection time points of day 5 of filgrastim for PBSC donors and day 2 for BM donors. However, there were no differences in grade 2–4 pain by randomized product. In contrast to previous reports, obesity was not associated with pain [3, 6]. However, our sample size in this analysis was smaller and thus limited our power of detection. Donors of BM were also more likely to experience body symptoms and fatigue than PBSC donors, and as with skeletal pain, symptoms for all donors were more likely at peri-collection time points. PBSC donors had more rapid resolution of symptoms. Again, it is important to note that most symptoms were mild to moderate. As in this study, prior reports have also noted more body symptoms in donors over the age of 30 years, and men less likely to experience grade 2–4 body symptoms at peri-collection time points [3, 5].
Not surprisingly, there was a greater mean change in WBC, neutrophil and mononuclear cell counts in PBSC donors related to G-CSF administration than in BM donors, a greater mean change in hemoglobin in BM donors related to BM harvest, and a greater mean change in platelets in PBSC donors related to apheresis. Comforting, all hematologic parameters ultimately returned to baseline. Hemoglobin values returned to baseline at 1 month for PBSC but not until 6 months for BM donors; platelet counts returned to baseline at 1 month for both groups. The potential impact of decrease in hemoglobin on time to recovery and body symptoms was not considered in this study.
The results of this prospective, randomized study of unrelated donors that included donors from the United States, Canada and Germany are generalizable to donors in other countries and will serve to inform clinicians and potential donors of the time course for recovery and toxicities by donated product. It is reassuring that, regardless of donated product, few donors experience disabling symptoms and that time to recovery is becoming shorter in more recent years. Future studies should focus on how toxicities can be further ameliorated, particularly at peri-collection time points. Best practices employed by experienced donor and collection centers to support donors throughout the collection process and hasten recovery, such as use of analgesics, hospitalization and outpatient follow-up, and iron supplementation, should be shared worldwide.
Highlights.
Unrelated donors’ recovery from PBSC vs BM donation in BMT CTN 0201 is reported.
PBSC donors recovered more quickly than donors of BM.
International donors and more recent donation increased likelihood of recovery.
Acknowledgments
Support for BMT CTN 0201 was provided by grant #U10HL069294 from the National Heart, Lung, and Blood Institute and the National Cancer Institute, the Department of the Navy, Office of Naval Research, and the National Marrow Donor Program. Enrollment support was provided by DKMS Germany. Contributions to the Donor Quality of Life study were made by The Health Resources and Services Administration Contract No. HHSH234200637020C. Any views, opinions, findings, conclusions or recommendations expressed in this material are those of the author(s) and do not reflect the views or the official policy or position of the above mentioned parties.
We thank the donor center teams in the United States, Canada and Germany for recruiting the donors for this trial.
Footnotes
Publisher's Disclaimer: This is a PDF file of an unedited manuscript that has been accepted for publication. As a service to our customers we are providing this early version of the manuscript. The manuscript will undergo copyediting, typesetting, and review of the resulting proof before it is published in its final citable form. Please note that during the production process errors may be discovered which could affect the content, and all legal disclaimers that apply to the journal pertain.
Financial Disclosure: The authors have no financial interests to disclose.
Authorship statement: All authors participated in the design of the research, interpretation of results, and manuscript preparation. All authors reviewed and approved the final manuscript.
REFERENCES
- 1.Miller JP, Perry EH, Price TH, et al. Recovery and safety profiles of marrow and PBSC donors: experience of the National Marrow Donor Program. Biol Blood Marrow Transplant. 2008;14:29–36. doi: 10.1016/j.bbmt.2008.05.018. [DOI] [PubMed] [Google Scholar]
- 2.Pulsipher MA, Chitphakdithai P, Miller J, et al. Adverse events among 2408 unrelated donors of peripheral blood stem cells: results of a prospective trial from the National Marrow Donor Program. Blood. 2009;113:3604–3611. doi: 10.1182/blood-2008-08-175323. [DOI] [PMC free article] [PubMed] [Google Scholar]
- 3.Pulsipher MA, Chitphakdithai P, Logan BR, et al. Acute toxicities of unrelated bone marrow versus peripheral blood stem cell donation: results of a prospective trial from the National Marrow Donor Program. Blood. 2013;121:197–206. doi: 10.1182/blood-2012-03-417667. [DOI] [PMC free article] [PubMed] [Google Scholar]
- 4.Pulsipher MA, Chitphakdithai P, Logan BR, et al. Lower risk for serious adverse events and no increased risk for cancer after PBSC vs BM donation. Blood. 2014;123:3655–3663. doi: 10.1182/blood-2013-12-542464. [DOI] [PMC free article] [PubMed] [Google Scholar]
- 5.Shaw BE, Logan BR, Kiefer DM, et al. Analysis of the effect of race, socioeconomic status, and center size on unrelated National Marrow Donor Program donor outcomes: donor toxicities are more common at low-volume bone marrow collection centers. Biol Blood Marrow Transplant. 2015;21:1830–1838. doi: 10.1016/j.bbmt.2015.06.013. [DOI] [PMC free article] [PubMed] [Google Scholar]
- 6.Gordon SV, Nivison-Smith I, Szer J, Chapman JR. Volunteer unrelated donor experience after administration of filgrastim and apheresis for the collection of haemopoietic stem cells: the Australian perspective. Intern Med J. 2013;43:1183–1190. doi: 10.1111/imj.12282. [DOI] [PubMed] [Google Scholar]
- 7.Rinaldi C, Savignano C, Pasca S, et al. Efficacy and safety of peripheral blood stem cell mobilization and collection: a single-center experience in 190 allogeneic donors. Transfusion. 2012;52:2387–2394. doi: 10.1111/j.1537-2995.2012.03619.x. [DOI] [PubMed] [Google Scholar]
- 8.Mueller MM, Bialleck H, Bomke B, et al. Safety and efficacy of healthy volunteer stem cell mobilization with filgrastim G-CSF and mobilized stem cell apheresis: results of a prospective longitudinal 5-year follow-up study. Vox Sang. 2013;104:46–54. doi: 10.1111/j.1423-0410.2012.01632.x. [DOI] [PubMed] [Google Scholar]
- 9.Chen SH, Yang SH, Chu SC, et al. The role of donor characteristics and post-granulocyte colony-stimulating factor white blood cell counts in predicting the adverse events and yields of stem cell mobilization. Int J Hematol. 2011;93:652–659. doi: 10.1007/s12185-011-0844-5. [DOI] [PubMed] [Google Scholar]
- 10.Hölig K, Kramer M, Kroschinsky P, et al. Safety and efficacy of hematopoietic stem cell collection from mobilized peripheral blood in unrelated volunteers: 12 years of single-center experience in 3928 donors. Blood. 2009;114:2757–2763. doi: 10.1182/blood-2009-04-218651. [DOI] [PubMed] [Google Scholar]
- 11.Karlsson L, Quinlan D, Guo D, et al. Mobilized blood cells vs bone marrow harvest: experience compared in 171 donors with particular reference to pain and fatigue. Bone Marrow Transplant. 2004;33:709–713. doi: 10.1038/sj.bmt.1704418. [DOI] [PubMed] [Google Scholar]
- 12.Martino M, Bonizzoni E, Moscato T, et al. Mobilization of hematopoietic stem cells with lenograstim in healthy donors: Efficacy and safety analysis according to donor age. Biol Blood Marrow Transplant. 2015;21:881–888. doi: 10.1016/j.bbmt.2015.01.021. [DOI] [PubMed] [Google Scholar]
- 13.Favre G, Beksac M, Bacigalupo A, et al. Differences between graft product and donor side effects following bone marrow or stem cell donation. Bone Marrow Transplant. 2003;32(9):873–880. doi: 10.1038/sj.bmt.1704245. [DOI] [PubMed] [Google Scholar]
- 14.Bredeson C, Leger C, Couban S, et al. An evaluation of the donor experience in the Canadian multicenter randomized trial of bone marrow versus peripheral blood allografting. Biol Blood Marrow Transplant. 2004;10:405–414. doi: 10.1016/j.bbmt.2004.02.003. [DOI] [PubMed] [Google Scholar]
- 15.Fortanier C, Kuentz M, Sutton L, et al. Healthy sibling donor anxiety and pain during bone marrow or peripheral blood stem cell harvesting for allogeneic transplantation: results of a randomised study. Bone Marrow Transplant. 2002;29:145–149. doi: 10.1038/sj.bmt.1703338. [DOI] [PubMed] [Google Scholar]
- 16.Heldal D, Brinch L, Tjonnfjord G, et al. Donation of stem cells from blood or bone marrow: results of a randomised study of safety and complaints. Bone Marrow Transplant. 2002;29:479–486. doi: 10.1038/sj.bmt.1703418. [DOI] [PubMed] [Google Scholar]
- 17.Kennedy GA, Morton J, Western R, Butler J, Daly J, Durrant S. Impact of stem cell donation modality on normal donor quality of life: a prospective randomized study. Bone Marrow Transplant. 2003;31:1033–1035. doi: 10.1038/sj.bmt.1704053. [DOI] [PubMed] [Google Scholar]
- 18.Rowley SD, Donaldson G, Lilleby K, Bensinger WI, Appelbaum FR. Experiences of donors enrolled in a randomized study of allogeneic bone marrow or peripheral blood stem cell transplantation. Blood. 2001;97:2541–2548. doi: 10.1182/blood.v97.9.2541. [DOI] [PubMed] [Google Scholar]
- 19.Anasetti C, Logan BR, Lee SJ, et al. Peripheral-blood stem cells versus bone marrow from unrelated donors. N Eng J Med. 2012;367:1487–1496. doi: 10.1056/NEJMoa1203517. [DOI] [PMC free article] [PubMed] [Google Scholar]
- 20.Billen A, Madrigal JA, Strydom A, Szydlo RM, Switzer GE, Shaw BE. Predonation health-related quality of life scores predict time to recovery in hematopoietic stem cell donors. Biol Blood Marrow Transplant. 2015;21:350–356. doi: 10.1016/j.bbmt.2014.10.028. [DOI] [PubMed] [Google Scholar]
- 21.Switzer GE, Bruce JG, Harrington D, et al. Health-related quality of life of bone marrow versus peripheral blood stem cell donors: a prespecified subgroup analysis from a phase III RCT-BMTCTN protocol 0201. Biol Blood Marrow Transplant. 2004;20:118–127. doi: 10.1016/j.bbmt.2013.10.024. [DOI] [PMC free article] [PubMed] [Google Scholar]


