

Abstract
Chronic alcohol use is associated with declines in gray matter (GM) volume, as is the normal aging process. Less apparent, however, is how the interaction between aging and heavy alcohol use affects changes in GM across the lifespan. There is some evidence that women are more vulnerable to the negative effects of alcohol use on GM than men. In the current study, we examined whether localized GM was related to measures of alcohol use disorder (e.g., AUDIT score) in a large sample (N = 436) of participants, ages 18–55 years, with a range of disease severity, using both voxel‐based morphometry (VBM) and surface‐based morphometry (SBM). We also explored whether GM associations with alcohol use disorder (AUD) severity are moderated by sex and age. Results showed significant negative associations between AUD severity and GM volume throughout temporal, parietal, frontal, and occipital lobes. Women showed more negative effects of alcohol use than men for cortical thickness in left orbitofrontal cortex, but evidence for increased vulnerability based on sex was limited overall. Similarly, a specific age by alcohol use interaction was observed for volume of right insula, but other regional or global interactions were not statistically supported. However, significant negative associations between heavy alcohol use and GM volumes were observed as early as 18–25 years. These findings support that alcohol has deleterious effects on global and regional GM above and beyond age, and, of particular importance, that regional associations emerge in early adulthood. Hum Brain Mapp 37:2276–2292, 2016. © 2016 Wiley Periodicals, Inc.
Keywords: aging, sex differences, alcohol use disorder, neuroimaging, voxel‐based morphometry, surface‐based morphometry
Abbreviations
- ACC
Anterior cingulate cortex
- AUD
Alcohol use disorder
- BAI
Beck anxiety inventory
- BDI‐II
Beck depression inventory
- FWHM
Full‐width half‐maximum
- GM
Gray matter
- ICV
intracranial volume
- MNI
Montreal neurological institute
- OFC
Orbitofrontal cortex
- SBM
Surface‐based morphometry
- TLFB
Timeline follow‐back
- VBM
Voxel‐based morphometry
INTRODUCTION
Cognitive decline and structural and functional neuroadaptations characterize the normal aging process in healthy adults [Harada et al., 2013; Kalpouzos et al., 2009]. Global cortical thinning and gray matter (GM) volume loss, as well as other indicators of atrophy such as ventricle size, are associated with poorer neuropsychological test scores and cognitive decline with aging [Draganski et al., 2013; Raz et al., 1998]. Structural brain imaging studies have consistently shown an inverse relationship between aging and total cerebral brain volume [Pfefferbaum et al., 1994] at an estimated rate of 1.9% per decade [Seshadri et al., 2004], although these declines are not uniform across the brain [Resnick et al., 2000]. Volume reductions associated with increased age are largest in the frontal lobes (approximately 12% difference in volume between older adults ages 71 to 96 and adults ages 34 to 54) and temporal lobes (approximately 9% age‐related difference in volume) [DeCarli et al., 2005; Jernigan et al., 1991, 2001], and evidence suggests that prefrontal GM is most susceptible to age‐related volume loss in healthy individuals [Raz et al., 1997].
In addition, neuroimaging studies provide strong evidence of the negative effects of chronic alcohol use on brain structure. Alcohol consumption is associated with volume loss in the brain globally [Harper and Kril, 1985; Hommer et al., 2001; Jernigan et al., 1991; Paul et al., 2008; Pfefferbaum et al., 1992], as well as in specific cortical structures [Fein et al., 2002; Makris et al., 2008]. Studies among alcohol dependent inpatients [Grodin et al., 2013; Le Berre et al., 2014; Momenan et al., 2012] have shown global differences in GM volumes, with patients showing a global loss of up to 12% compared to non‐alcohol dependent controls [Le Berre et al., 2014]. More regionally specific GM differences have been reported in the frontal, parietal, and mesial temporal lobes [Jernigan et al., 1991], in the dorsolateral prefrontal cortex and insula [Makris et al., 2008], the precentral and middle central gyri [Mechtcheriakov et al., 2007], and the lateral frontal and parietal cortices [Shear et al., 1992]. Further, GM volume has consistently been inversely associated with severity of alcohol use disorders (AUD) (i.e., dependence), both globally and in regions related to reward processing [Durazzo et al., 2011; Le Berre et al., 2014; van Holst et al., 2012]. In particular, measures associated with chronic alcoholism such as number of withdrawals and relapses are negatively correlated with GM volume in regions including the anterior cingulate cortex (ACC), insula, and cerebellum [Le Berre et al., 2014], as well as orbitofrontal cortex [OFC; Le Berre et al., 2014; Durazzo et al., 2011]. However, it is often difficult to determine the extent of GM loss from chronic alcohol use due to the large proportion of variance in GM attributable to age and direct confounds between duration of alcohol use and age [Fein et al., 2002].
Additionally, evidence suggests that alcohol use may have a differing association with brain structure across the lifespan [Di Sclafani et al., 1995; Pfefferbaum et al., 1997]. There is some evidence that the aging brain is particularly vulnerable to the effects of chronic alcohol abuse [e.g., the accelerated aging model, Ellis and Oscar‐Berman, 1989; Pfefferbaum et al., 1992]. Differences in brain structure between alcohol dependent populations and non‐ or light drinkers are typically described in samples with a mean age in the 40s or 50s [Durazzo et al., 2011; Makris et al., 2008; van Holst et al., 2012]. To date, only limited studies of morphometry and alcohol have focused on emerging and young adulthood (i.e., the 20s and 30s). For example, a recent review found seven studies with a mean sample age between 21 and 40 years that showed consistently lower volume of frontal cortex GM (and, with less consistency, total GM) among individuals with AUD [Welch et al., 2013]. However, these studies included a substantial number of subjects greater than 40 years of age whose data could have driven those findings [Welch et al., 2013]. In fact, a more recent study found that young adults (age M 22.43, SD 1.03) who had engaged in binge drinking patterns for at least 3 years had significantly larger GM volumes of the left mid‐dorsolateral prefrontal cortex compared to controls, controlling for age and sex [Doallo et al., 2014]. Another study found that young binge drinkers (age M 22.95, SD 3.14) had significantly larger ventral striatal GM volumes compared to age‐matched controls, though no relationships were found with AUD severity [Howell et al., 2013]. These results demonstrating volume differences could reflect developmental delays given that GM volume decreases during the normal, healthy neurodevelopmental period of young adulthood [Sowell et al., 1999]. This remains an open question given the limited research in emerging adult populations. More work is needed to clarify the associations between heavy drinking and morphometry in young adults compared to middle‐aged and older adults.
Finally, sex may be a moderating factor in chronic alcohol use and brain volume differences. Women tend to show a telescoping trajectory of AUD, such that they begin heavy drinking later in the lifespan but develop disorder symptoms, including brain atrophy, more rapidly than men [Mann et al., 2005]. This pattern has been observed in structural neuroimaging studies. Female patients compared to non‐dependent women showed greater differences in gray and white matter volumes than dependent versus non‐dependent men, with a lower proportion of GM in particular [Hommer et al., 2001]. These findings suggest that women are particularly susceptible to the neurotoxic effects of alcohol, despite drinking for relatively fewer years on average. In contrast, one study found less brain atrophy among alcohol‐dependent women compared to alcohol‐dependent men [Pfefferbaum et al., 2001]. An updated characterization of sex effects on brain morphology in alcohol dependence is warranted given limited sample sizes and inconsistencies in the literature to date.
Therefore, the current study sought to provide an updated characterization of GM patterns associated with sex, age, and alcohol use severity in a large sample of emerging to middle‐aged adults. We sought to differentiate potential regions especially vulnerable to heavy alcohol use across genders and this age spectrum (i.e., 18 to 55 years of age). We hypothesized that women would show more GM loss in the context of heavy alcohol use than men. We also hypothesized that regions including the OFC, cerebellum, and insula [Le Berre et al., 2014] are likely more susceptible to detrimental effects of alcohol at increased ages. Using general linear models, we examined the association between heavy alcohol use and GM volume, over and above terms for age, sex, and possible confounding factors of marijuana and cigarette use, depression symptoms, anxiety symptoms, and intracranial volume (ICV). Additional models in extracted data tested sex and age by alcohol use interactions, as well as within‐group analyses for better characterization of effects. Beyond these primary aims, we also sought to compare results from voxel‐based morphometry (VBM) and surface‐based morphometry (SBM), two common structural imaging techniques for assessing GM. These approaches are rarely compared in morphometry studies [John et al., 2015; Smolker et al., 2015]; however, both methods provide estimates of volume, albeit by using different calculations [relative proportion of GM in VBM, versus surface area by cortical thickness in SBM; Smolker et al., 2015] that may provide complementary information about underlying pathology. While VBM is useful as an overall index, SBM might provide more useful information for further investigation of underlying mechanisms. To our knowledge, no studies in the alcohol dependence literature have utilized both approaches to analyze GM in relation to clinical status or disorder severity.
MATERIALS AND METHODS
Sample and Procedures
Data were obtained by pooling participants from existing studies that collected data on alcohol and other substance use as well as neuroimaging [e.g., Claus et al., 2011]. Briefly, participants were recruited from the Albuquerque metropolitan region through advertisements in local print, online media, and radio advertisements. Exclusionary criteria across studies included previous brain injury or loss of consciousness for more than 5 minutes, history of bipolar disorder or a psychotic disorder, or a positive pregnancy test. Additional inclusionary criteria impacting a portion of the final sample (i.e., related to study‐specific screening) are as follows: 51.9% of participants reported no history of alcohol withdrawal severe enough to require medical treatment and were not currently taking antipsychotic medications; and 35.4% of participants underwent and passed toxicology screening for illicit substances (opiates, cocaine, amphetamines), had no serious medical illness within the past 6 months or passed a medical screen, and did not meet criteria for major depressive disorder. Subjects abstained from smoking 2 hours before scanning, were asked to stop drinking 24 hours prior, and had to pass a breathalyzer prior to participation. Written informed consent, approved by the University of New Mexico Human Research Committee, was obtained from all participants.
Data were included for all available participants with complete measures needed for analyses (i.e., including measures used as covariates), and missing items related to substance use were a limiting factor (e.g., self‐reported years of regular smoking). Of 608 participants with structural neuroimaging data, N = 436 had complete data for main variables across questionnaires. With this sample size, power analyses suggested approximately 80% power to detect small effect sizes with α = 0.05 for a single regression coefficient in linear multiple regression [G*Power 3.1; Faul et al., 2009].
Measures
In addition to providing basic demographic information, participants responded to substance use, mood, and anxiety questionnaires. Participants completed the Alcohol Use Disorders Identification Test [AUDIT; Saunders et al., 1993] to assess symptoms of alcohol abuse and dependence over the last 6 months. Participants indicated the frequency of alcohol use and alcohol‐related problems by answering 10 items (e.g., “How often during the last 6 months have you been unable to remember what happened the night before because you had been drinking?”). Responses were coded “never” (0), “less than monthly” (1), “monthly” (2), “weekly” (3), or “daily or almost daily” (4). The first three items of the AUDIT were summed to provide a separate measure of alcohol consumption alone, and the remaining items (i.e., 4 through 10) were summed to provide a measure of dependence and alcohol‐related problems. An additional measure of quantity (drinks per drinking day) of alcohol consumption was computed from the 60‐day Timeline Follow‐Back [TLFB; Sobell and Sobell, 1992]. A portion (n = 339) of the sample also completed a measure of drinking history, which is reported here for qualitative description (i.e., not included in general linear models). Participants provided numeric estimates of their age of onset of regular drinking and years of regular drinking.
Measures of marijuana use, cigarette smoking, depression, and anxiety were included for use as covariates. Marijuana use was derived from the 60‐day TLFB. Due to non‐normality of marijuana use within the sample, as well as disadvantages of using a binary code to designate use or non‐use, days of marijuana use was recoded along a 5‐point scale corresponding to none, less than once per week, about once or twice per week, about 3 to 5 times per week, and about 6 times per week to every day. Cigarette use was derived from variables for cigarettes per day and years of regular smoking as an estimate of long‐term smoking habits. Participants completed the Beck Depression Inventory [BDI‐II; Beck et al., 1996] to assess depression symptom severity in the past two weeks. Participants evaluated their symptoms using a 0 to 3 scale. BDI‐II total scores range from 0 to 63, with categorical depression ratings of “minimal” (0–13), “mild” (14–19), “moderate” (20–28), and “severe” (29–63). Similarly, the Beck Anxiety Inventory (BAI; Beck and Steer, 1993) assessed anxiety symptom severity during the past week on a 0 to 3 scale with categorical cutoffs of “low anxiety” (0‐21), “moderate anxiety” (22–35), and “severe anxiety” (36–63).
Image Acquisition
MRI was performed on a 3T Siemens Trio (Erlangen, Germany) whole body scanner with a 12‐channel radio frequency coil. A high‐resolution T1‐weighted structural image was acquired with a 5‐echo multi‐echo MPRAGE sequence with TE = 1.64, 3.50, 5.36, 7.22, and 9.08 ms, TR = 2.53 s, TI = 1.20 s, flip angle = 7°, NEX = 1, slice thickness = 1 mm, 33 slices, FOV = 256 × 256 mm, resolution = 256 × 256 × 176, voxel size = 1 × 1 × 1 mm, and pixel bandwidth = 650 Hz.
Voxel‐Based Morphometry
VBM analyses were performed using FSL's (v5.0.1) FSLVBM analysis pipeline following standard automated processing [Ashburner and Friston, 2000; Good et al., 2001], as in other publications [Smolker et al., 2015; Weiland et al., 2015]. This pipeline uses modulation to incorporate the volumetric changes during normalization in the analysis for optimized VBM. Briefly, the raw T1‐weighted images were brain‐extracted (i.e., removal of any non‐brain tissue and skull) using the FSL default BET brain extraction process. The resulting GM images were aligned to Montreal Neurological Institute (MNI) standard space using the affine registration tool FLIRT, followed by nonlinear registration using FNIRT, and then averaged into a study‐specific template. Native GM images were then non‐linearly re‐registered to this template using FNIRT. The registered partial volume images were then modulated by dividing the Jacobian of the warp field. The modulated segmented images were then smoothed with an isotropic Gaussian kernel with a sigma of 3, yielding full‐width half‐maximum (FWHM) 3 × 2.3 mm = 6.9 mm.
Surface‐Based Morphometry
SBM analyses used FreeSurfer v5.1 (https://surfer.nmr.mgh.harvard.edu/) to perform cortical reconstruction and segmentation. These methods included motion correction [Reuter et al., 2010], removal of non‐brain tissue using a hybrid watershed/surface deformation procedure [Ségonne et al., 2004], automated Talairach transformation, segmentation of cortical and subcortical volumetric structures [Fischl et al., 2002; Fischl et al., 2004], intensity normalization [Sled et al., 1998], tessellation of the gray/white‐matter boundary, automated topology correction [Fischl et al., 2001; Ségonne et al., 2007], surface deformation using intensity gradients, and parcellation into cortical and subcortical structures [Dale and Sereno, 1993; Dale et al., 1999; Fischl and Dale, 2000]. Visual quality control verified the skull stripping and gray/white‐matter boundary segmentation following procedures in previous work [Weiland et al., 2014a].
Data Analyses
General linear models
Initial general linear models (GLM) evaluated relationships between GM volume/density and AUDIT score, controlling for age, sex, marijuana use, cigarette pack years, depression, anxiety, and ICV in both VBM and SBM. Significant clusters were identified at P < 0.05 and then P < 0.001 for increased localization. Multiple comparison correction for whole brain VBM analyses used voxelwise thresholding applied using FSL's Randomise permutation‐based non‐parametric testing with Monte Carlo simulations. A total of 5,000 simulations were run for each permutation test, and threshold‐free cluster enhancement was used to identify clusters of significant association. Multiple comparison correction in SBM used Monte Carlo simulations to identify clusters of significant association.
Follow‐up analyses
Masks of significant clusters at P < 0.05 were used to extract individual participant values for follow up analyses conducted in SPSS. In order to explore a moderating effect of sex on the relationship between AUDIT and GM morphometry, a sex by AUDIT interaction term was computed and added to GLMs. Similarly, in order to identify clusters where alcohol use might have increased impact on brain volumes with increasing age, initial GLMs were repeated with an additional age by AUDIT interaction term.
Within‐group analyses are also reported to illustrate effects across clusters by sex and age group. To clarify age effects, the whole sample was split into age groups of 18–25 years, 26–35 years, and 36–55 years. Regressions replicated initial GLMs (i.e., entering AUDIT, age, marijuana and cigarette use, depression, anxiety, and ICV, as well as sex in age group analyses) to explore amount of variance in volume of significant clusters attributed to AUDIT score within women and men and in different age ranges. Significance values were corrected under false discovery rate for each group of analyses (e.g., one correction across both VBM and SBM clusters for sex interaction terms in the whole sample, and another correction for values across all clusters and both sexes in within‐group analyses; repeated for age analyses).
Finally, because SBM volume is computed by multiplying surface area and cortical thickness, these values were extracted and used to repeat follow‐up analyses specific to SBM. First, alcohol use variables, surface area, and cortical thickness in each cluster were entered in partial correlations controlling for age, sex, marijuana and cigarette use, depression, anxiety, and ICV. Subsequent analyses repeated interaction and within‐group GLMs using surface area and cortical thickness values. Similarly, significance values were corrected under false discovery rate.
RESULTS
Sample Characteristics
Participants were predominantly male (60%) with a mean age of 31.61 years (SD = 9.63; range 18–55; see Table 1). Participants were largely representative of the ethnic background of the southwestern United States (47% Caucasian; 21% Latino; 13% Biracial or Mixed; 7% Native American; 2% African American; 1% Asian/Pacific Islander; 9% unknown or declined to state). A wide range of AUD severity was represented in the current sample, with AUDIT scores ranging from 0 to 39 (i.e., out of a maximum score of 40). Within the whole sample, age and AUDIT were significantly positively correlated [partial r(429) = 0.14, P = 0.003] when controlling for sex, marijuana use, cigarette use, depression, and anxiety. On average, participants reported minimal levels of depression and anxiety, although 16% of participants endorsed depression symptoms of moderate or greater severity and 7% of participants endorsed anxiety of moderate or greater severity.
Table 1.
Sample characteristics
| Whole sample | Females | Males | Ages | Ages | Ages | |
|---|---|---|---|---|---|---|
| 18–25 | 26–35 | 36–55 | ||||
| N | 436 | 176 | 260 | 155 | 145 | 133 |
| Ethnicity | ||||||
| Caucasian | 204 | 77 | 127 | 75 | 65 | 64 |
| Latino | 91 | 45 | 46 | 26 | 30 | 35 |
| Native American | 32 | 12 | 20 | 13 | 10 | 9 |
| African American | 8 | 1 | 7 | 3 | 2 | 3 |
| Asian/Pacific Islander | 5 | 2 | 3 | 3 | 0 | 2 |
| Mixed | 57 | 24 | 33 | 20 | 22 | 15 |
| Unknown | 39 | 15 | 24 | 15 | 16 | 8 |
| Females:Males | 176:260 | 58:97 | 64:81 | 54:82 | ||
| Agea | 31.61 (9.63) | 31.95 (9.98) | 31.37 (9.40) | 22.77 (1.66) | 29.22 (2.84) | 44.22 (5.56) |
| AUDIT Total Scorea ,b | 13.64 (8.55) | 12.23 (8.86) | 14.58 (8.21) | 12.13 (6.36) | 13.34 (8.52) | 15.67 (10.25) |
| AUDIT Consumption Scoreb | 7.33 (2.98) | 6.60 (3.09) | 7.83 (2.81) | 7.25 (2.44) | 7.25 (2.96) | 7.52 (3.54) |
| AUDIT Dependence/Problems Scorea | 6.30 (6.31) | 5.63 (6.44) | 6.75 (6.19) | 4.88 (4.77) | 6.09 (6.31) | 8.15 (7.34) |
| TLFB Drinks per Drinking Daya,b | 5.63 (3.94) | 4.59 (3.38) | 6.33 (4.13) | 5.50 (3.49) | 5.08 (3.37) | 6.36 (4.80) |
| TLFB Marijuana Smoking Daysa | 7.92 (16.63) | 6.81 (16.14) | 8.66 (16.94) | 9.50 (18.14) | 9.97 (18.18) | 3.92 (11.81) |
| Cigarette Pack Yearsa | 6.11 (7.08) | 6.15 (7.41) | 6.09 (6.86) | 4.52 (6.27) | 5.89 (6.38) | 8.17 (8.13) |
| BDI‐IIa | 10.17 (8.99) | 10.72 (9.84) | 9.80 (8.36) | 8.33 (7.54) | 9.76 (9.34) | 12.72 (9.59) |
| BAI | 8.05 (8.29) | 8.95 (8.57) | 7.43 (8.05) | 7.98 (8.10) | 8.63 (8.90) | 7.50 (7.83) |
| Age of Onset of Regular Drinkinga ,b,c | 19.21 (4.77) | 20.50 (6.05) | 18.40 (3.53) | 18.06 (2.26) | 19.12 (3.54) | 20.52 (6.99) |
| Years of Regular Drinkinga ,c | 12.80 (9.67) | 11.79 (9.25) | 13.44 (9.89) | 4.88 (2.60) | 10.11 (3.96) | 23.85 (8.19) |
AUDIT: Alcohol Use Disorders Identification Test; BDI‐II: Beck Depression Inventory ‐ II; BAI: Beck Anxiety Inventory; TLFB: Timeline Follow‐Back (60 days).
Significant difference among age groups, P < 0.05.
Significant difference between females and males, P < 0.05.
Incomplete response rate; Whole sample n = 339; Females n = 131, Males n = 208; Ages 18–25 n = 117, Ages 26–35 n = 111, Ages 36–55 n = 111.
General Linear Models
As expected, AUDIT showed global negative association with GM above and beyond the large global effect of age, in 13 clusters for VBM and 11 clusters for SBM, although clusters with peak effects were too large at P < 0.05 for useful localization (see Table 2 and Figs. 1 and 2; the largest cluster from VBM showed 80,704 voxels, and SBM volume showed clusters including 7,024 and 4,341 surface voxels for left and right hemispheres, respectively). Thus, the significance threshold was increased to P < 0.001 (see Table 3). Peak age effects were observed in the right caudate for VBM and in two frontal clusters for SBM, although these clusters continued to be very large in size and encompass numerous regions. Peak AUDIT association was located in the right cerebellum for VBM. For SBM, peak AUDIT association was lateralized to the left hemisphere and located in the lateral orbitofrontal, supramarginal, precentral, superior temporal, middle temporal, and inferior parietal cortices, as well as precuneus. In both modalities, medium effect sizes of heavy alcohol use were observed beyond the expected, large effect of age.
Table 2.
General linear model cluster results at P < 0.05 for age and Alcohol Use Disorders Identification Test (AUDIT) predictors, controlling for sex, depression, anxiety, marijuana use, cigarette pack years, and intracranial volume
| Annotation | Peak t | Cluster Sizea | Coordinatesb | Effect Sizec (Cohen's d) | |||
|---|---|---|---|---|---|---|---|
| X | Y | Z | |||||
| Voxel‐Based Morphometry (VBM) | |||||||
| Age | |||||||
| R Caudate | −12.60 | 1248976 | 12 | 8 | 4 | −1.22 | |
| AUDIT | |||||||
| V1 | L/R Cerebellum | −5.62 | 80704 | 0 | −62 | −28 | −0.54 |
| V2 | R Insula | −4.57 | 5184 | 26 | 20 | −2 | −0.44 |
| V3 | L Frontal Medial Cortex | −4.56 | 12008 | −14 | 46 | −4 | −0.44 |
| V4 | L/R Paracingulate Gyrus | −4.42 | 3168 | 0 | 18 | 40 | −0.43 |
| V5 | L Heschl's Gyrus | −4.32 | 6368 | −40 | −26 | 4 | −0.42 |
| V6 | L Precentral Gyrus | −4.09 | 11184 | −40 | 6 | 28 | −0.40 |
| V7 | R Parietal Operculum Cortex | −3.95 | 520 | 52 | −28 | 28 | −0.38 |
| V8 | R Frontal Pole | −3.94 | 1944 | 30 | 50 | 14 | −0.38 |
| V9 | L Supramarginal Gyrus | −3.70 | 264 | −32 | −50 | 36 | −0.36 |
| V10 | R Postcentral Gyrus | −3.62 | 240 | 66 | −18 | 38 | −0.35 |
| V11 | L Caudate | −3.61 | 96 | −16 | 26 | −6 | −0.35 |
| V12 | R Paracingulate Gyrus | −3.15 | 16 | 14 | 18 | 40 | −0.30 |
| V13 | L Superior Temporal Gyrus | −2.81 | 8 | −68 | −16 | 8 | −0.27 |
| Surface‐Based Morphometry (SBM) | |||||||
| Age | |||||||
| R Precentral | −23.45 | 69029 | 46.0 | 5.1 | 6.4 | −2.27 | |
| L Superior Frontal | −21.93 | 67906 | −6.6 | 16.1 | 56.3 | −2.12 | |
| AUDIT | |||||||
| S1 | L Lateral Orbitofrontal | −6.07 | 7024 | −27.3 | 24.6 | 1.3 | −0.59 |
| S2 | R Supramarginal | −4.93 | 4341 | 57.5 | −18.9 | 20.3 | −0.48 |
| S3 | L Precuneus | −4.23 | 2540 | −7.5 | −54.3 | 37.3 | −0.41 |
| S4 | L Superior Temporal | −4.10 | 1929 | −44.4 | 12.2 | −22.9 | −0.40 |
| S5 | R Lateral Occipital | −4.07 | 1333 | 41.3 | −67.6 | 6.2 | −0.39 |
| S6 | L Inferior Parietal | −4.01 | 1267 | −40.2 | −63.4 | 37.8 | −0.39 |
| S7 | L Paracentral | −3.85 | 1416 | −15.0 | −20.9 | 42.3 | −0.37 |
| S8 | R Middle Temporal | −3.75 | 956 | 53.9 | −24.3 | −9.8 | −0.36 |
| S9 | L Lingual | −3.40 | 1148 | −23.5 | −57.5 | −3.7 | −0.33 |
| S10 | L Rostral Middle Frontal | −3.23 | 796 | −40.1 | 35.6 | 20.7 | −0.31 |
| S11 | R Inferior Parietal | −2.95 | 893 | 37.1 | −73.7 | 32.0 | −0.29 |
L = Left; R = Right.
Voxels (mm3) for FSL VBM; surface area (mm2) reported by FreeSurfer.
Unaltered from space for each analysis package; MNI for FSL VBM and FreeSurfer's Talairach for SBM.
Calculated from peak t.
Figure 1.
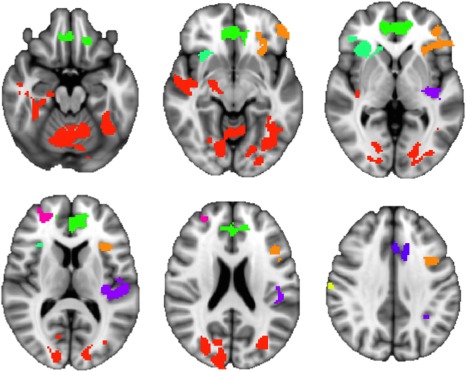
Clusters of GM volume showing significant negative association with AUDIT in FSL VBM (P < 0.05, z= −20, −10, 0, 10, 20, and 35; random color assignment by cluster).
Figure 2.
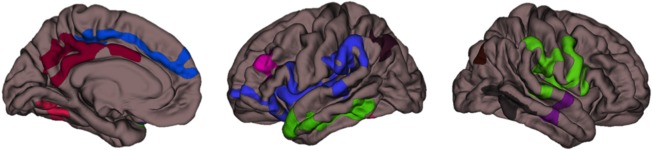
Clusters of GM volume showing significant negative association with AUDIT score for FreeSurfer SBM (P < 0.05; medial pial surfaces for left hemisphere, lateral pial surfaces for left and right hemispheres, respectively; random color assignment by cluster).
Table 3.
General linear model cluster results at P < 0.001 for age and Alcohol Use Disorders Identification Test (AUDIT) predictors, controlling for sex, depression, anxiety, marijuana use, cigarette pack years, and intracranial volume
| Annotation | Peak t | Cluster Sizea | Coordinatesb | Effect Sizec (Cohen's d) | ||
|---|---|---|---|---|---|---|
| X | Y | Z | ||||
| Voxel‐Based Morphometry (VBM) | ||||||
| Age | ||||||
| R Caudate | −12.60 | 1170424 | 12 | 8 | 4 | −1.22 |
| AUDIT | ||||||
| L/R Cerebellum | −5.62 | 3048 | 0 | −62 | −28 | −0.54 |
| R Cerebellum | −4.39 | 984 | 30 | −72 | −42 | −0.42 |
| Surface‐Based Morphometry (SBM) | ||||||
| Age | ||||||
| R Precentral | −23.45 | 55764 | 46.0 | 5.1 | 6.4 | −2.27 |
| L Superior Frontal | −21.93 | 51899 | −6.6 | 16.1 | 56.3 | −2.12 |
| L Lingual | −12.56 | 3540 | −22.4 | −58.5 | −4.5 | −1.22 |
| L Inferior Temporal | −4.93 | 235 | −50.6 | −53.3 | −9.7 | −0.48 |
| AUDIT | ||||||
| L Lateral Orbitofrontal | −6.07 | 143 | −27.3 | 24.6 | 1.3 | −0.59 |
| L Supramarginal | −5.78 | 170 | −47.1 | −34.7 | 26.1 | −0.56 |
| L Precentral | −5.60 | 358 | −47.5 | 1.6 | 6.8 | −0.54 |
| L Superior Temporal | −5.05 | 125 | −60.9 | −29.8 | 2.7 | −0.49 |
| L Precuneus | −4.23 | 128 | −7.5 | −54.3 | 37.3 | −0.41 |
| L Middle Temporal | −4.17 | 125 | −53.0 | −59.4 | 10.7 | −0.40 |
| L Inferior Parietal | −4.01 | 131 | −40.2 | −63.4 | 37.8 | −0.39 |
L = Left; R = Right.
Voxels (mm3) for FSL VBM; surface area (mm2) reported by FreeSurfer.
Unaltered from space for each analysis package; MNI for FSL VBM and FreeSurfer's Talairach for SBM.
Calculated from peak t.
Sex by AUDIT Interaction
None of the 13 VBM clusters or 11 SBM clusters showed statistically significant sex by AUDIT interaction (see Table 4). In VBM clusters, the peak AUDIT associations for women were in the cerebellum [V1: standardized ß = −0.44, t(168) = −5.92, P < 0.01] and paracingulate gyri [V4: standardized ß = −0.30, t(168) = −3.41, P < 0.01], while in men the peak effects were in the left medial frontal cortex [V3: standardized ß = −0.32, t(252) = −5.31, P < 0.01] and cerebellum [V1: standardized ß = −0.30, t(252) = −5.29, P < 0.01]. In SBM clusters, the peak AUDIT association was in the left lateral OFC for both women [S1: standardized ß = −0.34, t(168) = −4.68, P < 0.01] and men [S1: standardized ß = −0.18, t(252) = −3.48, P < 0.01], followed by right middle temporal cortex for women [S8: standardized ß = −0.29, t(168) = −4.68, P < 0.01] and left inferior parietal cortex for men [S6: standardized ß = −0.17, t(252) = −2.64, P < 0.05].
Table 4.
Whole sample sex by Alcohol Use Disorders Identification Test (AUDIT) interaction and within‐groups AUDIT regression coefficients for Voxel‐Based Morphometry (VBM) and Surface‐Based Morphometry (SBM) cluster volumes
| Whole Sample | Within Groups | |||||||||
|---|---|---|---|---|---|---|---|---|---|---|
| Sex × AUDIT Interaction | AUDIT Total Score | |||||||||
| Females | Males | |||||||||
| Annotation | ß | t | P | ß | t | P | ß | t | P | |
| VBM | ||||||||||
| V1 | L/R Cerebellum | 0.061 | 1.606 | 0.109 | −0.444 | −5.921 | <0.001** | −0.302 | −5.293 | <0.001** |
| V2 | R Insula | 0.054 | 1.323 | 0.186 | −0.181 | −2.414 | 0.017* | −0.195 | −3.127 | 0.002** |
| V3 | L Frontal Medial Cortex | −0.001 | −0.019 | 0.985 | −0.205 | −2.715 | 0.007* | −0.323 | −5.305 | <0.001** |
| V4 | L/R Paracingulate Gyrus | 0.038 | 0.797 | 0.426 | −0.303 | −3.410 | <0.001** | −0.196 | −2.858 | 0.005* |
| V5 | L Heschl's Gyrus | 0.021 | 0.476 | 0.634 | −0.195 | −2.426 | 0.016* | −0.270 | −4.229 | <0.001** |
| V6 | L Precentral Gyrus | 0.020 | 0.465 | 0.642 | −0.172 | −2.052 | 0.042 | −0.205 | −3.206 | 0.002** |
| V7 | R Parietal Operculum Cortex | 0.032 | 0.711 | 0.477 | −0.287 | −3.420 | <0.001** | −0.170 | −2.528 | 0.012* |
| V8 | R Frontal Pole | 0.078 | 1.675 | 0.095 | −0.247 | −2.892 | 0.004* | −0.165 | −2.395 | 0.017* |
| V9 | L Supramarginal Gyrus | −0.020 | −0.416 | 0.677 | −0.080 | −0.907 | 0.366 | −0.231 | −3.335 | <0.001** |
| V10 | R Postcentral Gyrus | 0.083 | 1.891 | 0.059 | −0.224 | −2.615 | 0.010* | −0.143 | −2.154 | 0.032* |
| V11 | L Caudate | −0.034 | −0.694 | 0.488 | −0.114 | −1.234 | 0.219 | −0.209 | −2.976 | 0.003** |
| V12 | R Paracingulate Gyrus | −0.045 | −0.991 | 0.322 | −0.066 | −0.753 | 0.452 | −0.235 | −3.463 | <0.001** |
| V13 | L Superior Temporal Gyrus | −0.004 | −0.081 | 0.936 | −0.130 | −1.433 | 0.154 | −0.145 | −2.059 | 0.041 |
| SBM | ||||||||||
| S1 | L Lateral Orbitofrontal | 0.049 | 1.402 | 0.162 | −0.344 | −4.681 | <0.001** | −0.176 | −3.447 | <0.001** |
| S2 | R Supramarginal | 0.053 | 1.477 | 0.140 | −0.239 | −3.207 | 0.002** | −0.111 | −2.196 | 0.029* |
| S3 | L Precuneus | 0.060 | 1.712 | 0.088 | −0.175 | −2.525 | 0.012* | −0.050 | −0.906 | 0.366 |
| S4 | L Superior Temporal | 0.051 | 1.177 | 0.240 | −0.228 | −2.818 | 0.005* | −0.076 | −1.209 | 0.228 |
| S5 | R Lateral Occipital | 0.054 | 1.194 | 0.233 | −0.109 | −1.247 | 0.214 | −0.010 | −0.151 | 0.880 |
| S6 | L Inferior Parietal | 0.005 | 0.119 | 0.905 | −0.228 | −2.699 | 0.008* | −0.170 | −2.643 | 0.009* |
| S7 | L Paracentral | 0.015 | 0.358 | 0.721 | −0.174 | −2.145 | 0.033* | −0.117 | −1.901 | 0.058 |
| S8 | R Middle Temporal | 0.016 | 0.370 | 0.712 | −0.286 | −3.369 | <0.001** | −0.116 | −1.882 | 0.061 |
| S9 | L Lingual | 0.085 | 1.895 | 0.059 | −0.253 | −2.933 | 0.004* | −0.022 | −0.319 | 0.750 |
| S10 | L Rostral Middle Frontal | 0.009 | 0.207 | 0.836 | −0.218 | −2.610 | 0.010* | −0.100 | −1.498 | 0.135 |
| S11 | R Inferior Parietal | 0.013 | 0.270 | 0.787 | −0.110 | −1.229 | 0.221 | −0.156 | −2.254 | 0.025* |
L = Left; R = Right.
**FDR < 0.01.
*FDR < 0.05.
Age by AUDIT Interaction
Two of the 13 VBM clusters and none of the 11 SBM clusters showed statistically significant age by AUDIT interaction (see Table 5), although only one VBM cluster in the right insula survived false discovery rate correction [V2: standardized ß = −0.13, t(426) = −3.08, P < 0.05]. In the right insula, the association between AUDIT and GM was more strongly negative with increased age (see Fig. 3).
Table 5.
Whole sample age by Alcohol Use Disorders Identification Test (AUDIT) interaction and within‐groups AUDIT regression coefficients for Voxel‐Based Morphometry (VBM) and Surface‐Based Morphometry (SBM) cluster volumes
| Whole Sample | Within Groups | ||||||||||||
|---|---|---|---|---|---|---|---|---|---|---|---|---|---|
| Age × AUDIT Interaction | AUDIT Total Score | ||||||||||||
| Age 18–25 years | Age 26–35 years | Age 36–55 years | |||||||||||
| Annotation | ß | t | P | ß | t | P | ß | t | P | ß | t | P | |
| VBM | |||||||||||||
| V1 | L/R Cerebellum | −0.003 | −0.074 | 0.941 | −0.335 | −4.149 | <0.001** | −0.473 | −4.954 | <0.001** | −0.401 | −4.794 | <0.001** |
| V2 | R Insula | −0.131 | −3.076 | 0.002* | −0.112 | −1.296 | 0.197 | −0.107 | −1.101 | 0.273 | −0.321 | −3.598 | <0.001** |
| V3 | L Frontal Medial Cortex | −0.060 | −1.444 | 0.149 | −0.184 | −2.141 | 0.034 | −0.386 | −4.038 | <0.001** | −0.377 | −4.488 | <0.001** |
| V4 | L/R Paracingulate Gyrus | −0.021 | −0.415 | 0.678 | −0.125 | −1.397 | 0.165 | −0.289 | −2.697 | 0.008* | −0.357 | −3.762 | <0.001** |
| V5 | L Heschl's Gyrus | −0.113 | −2.474 | 0.014 | −0.127 | −1.426 | 0.156 | −0.127 | −1.163 | 0.247 | −0.428 | −4.901 | <0.001** |
| V6 | L Precentral Gyrus | −0.001 | −0.014 | 0.989 | −0.165 | −1.958 | 0.052 | −0.290 | −2.763 | 0.007* | −0.237 | −2.600 | 0.010* |
| V7 | R Parietal Operculum Cortex | −0.058 | −1.223 | 0.222 | −0.043 | −0.496 | 0.621 | −0.168 | −1.554 | 0.122 | −0.488 | −5.450 | <0.001** |
| V8 | R Frontal Pole | −0.007 | −0.139 | 0.889 | −0.239 | −2.733 | 0.007* | −0.109 | −1.013 | 0.313 | −0.316 | −3.367 | 0.001** |
| V9 | L Supramarginal Gyrus | 0.054 | 1.081 | 0.280 | −0.287 | −3.323 | 0.001** | −0.149 | −1.334 | 0.184 | −0.217 | −2.184 | 0.031 |
| V10 | R Postcentral Gyrus | 0.001 | 0.026 | 0.979 | −0.225 | −2.710 | 0.008* | −0.062 | −0.573 | 0.568 | −0.231 | −2.511 | 0.013* |
| V11 | L Caudate | −0.051 | −0.992 | 0.322 | 0.003 | 0.034 | 0.973 | −0.174 | −1.594 | 0.113 | −0.294 | −3.012 | 0.003* |
| V12 | R Paracingulate Gyrus | −0.019 | −0.404 | 0.686 | −0.070 | −0.814 | 0.417 | −0.239 | −2.258 | 0.026 | −0.236 | −2.460 | 0.015* |
| V13 | L Superior Temporal Gyrus | −0.050 | −0.978 | 0.329 | 0.034 | 0.389 | 0.698 | −0.153 | −1.381 | 0.170 | −0.388 | −4.091 | <0.001** |
| SBM | |||||||||||||
| S1 | L Lateral Orbitofrontal | 0.004 | 0.106 | 0.915 | −0.137 | −1.864 | 0.064 | −0.334 | −4.444 | <0.001** | −0.262 | −3.324 | 0.001** |
| S2 | R Supramarginal | −0.022 | −0.589 | 0.556 | −0.099 | −1.397 | 0.164 | −0.187 | −2.347 | 0.020* | −0.192 | −2.232 | 0.027 |
| S3 | L Precuneus | −0.062 | −1.693 | 0.091 | 0.077 | 1.018 | 0.310 | −0.178 | −2.355 | 0.020* | −0.169 | −2.169 | 0.032 |
| S4 | L Superior Temporal | −0.040 | −0.880 | 0.379 | −0.019 | −0.218 | 0.827 | −0.252 | −2.546 | 0.012* | −0.196 | −2.115 | 0.036 |
| S5 | R Lateral Occipital | −0.068 | −1.422 | 0.156 | 0.116 | 1.355 | 0.178 | −0.029 | −0.283 | 0.778 | −0.153 | −1.558 | 0.122 |
| S6 | L Inferior Parietal | −0.030 | −0.633 | 0.527 | −0.096 | −1.084 | 0.280 | −0.259 | −2.521 | 0.013* | −0.220 | −2.323 | 0.022 |
| S7 | L Paracentral | 0.033 | 0.759 | 0.448 | −0.099 | −1.182 | 0.239 | −0.260 | −2.761 | 0.007* | −0.139 | −1.593 | 0.114 |
| S8 | R Middle Temporal | 0.067 | 1.496 | 0.135 | −0.189 | −2.319 | 0.022 | −0.280 | −2.793 | 0.006* | −0.107 | −1.133 | 0.259 |
| S9 | L Lingual | −0.021 | −0.447 | 0.655 | −0.004 | −0.054 | 0.957 | −0.067 | −0.642 | 0.522 | −0.151 | −1.591 | 0.114 |
| S10 | L Rostral Middle Frontal | −0.012 | −0.255 | 0.799 | −0.057 | −0.679 | 0.498 | −0.213 | −2.185 | 0.031 | −0.178 | −1.853 | 0.066 |
| S11 | R Inferior Parietal | −0.019 | −0.381 | 0.703 | 0.018 | 0.195 | 0.846 | −0.330 | −3.179 | 0.002** | −0.136 | −1.379 | 0.170 |
L = Left; R = Right.
**FDR < 0.01.
*FDR < 0.05.
Figure 3.
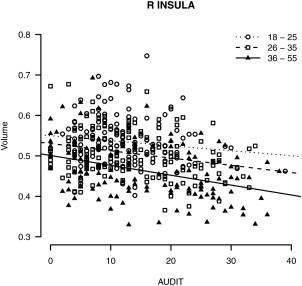
Significant age by AUDIT interaction for FSL VBM volume in the right insula, plotted by age group (18–25, 26–35, and 36–55 years old).
Within‐group analyses of relationships between AUDIT and volume by age group (see Tables I and V) suggested that negative associations are apparent as early as 18–25 years. In VBM, peak effects were observed in the cerebellum for the two younger age groups [V1: 18–25, standardized ß = −0.34, t(146) = −4.15, P < 0.01; 26–35, standardized ß = −0.47, t(136) = −4.95, P < 0.01], and in the right parietal operculum cortex for the 36–55 group [V7: standardized ß = −0.49, t(127) = −5.45, P < 0.01]. In SBM, no clusters survived correction in the 18–25 group. Peak SBM effects were located in the left lateral OFC for the two older groups [S1: 26–35, standardized ß = −0.33, t(136) = −4.44, P < 0.01; 36–55, standardized ß = −0.26, t(127) = −3.32, P < 0.01].
Surface Area versus Cortical Thickness in SBM
Repeating analyses within SBM values that comprise volume showed that associations between AUDIT and volume are driven by cortical thickness rather than surface area (see Table 6), which is consistent across alcohol use quantity and problems. Interaction and within‐group GLMs for both sex (see Table 7) and age (see Table 8) showed consistent effects in cortical thickness and not surface area, with overall patterns more comparable with VBM results.
Table 6.
Partial correlation values between FreeSurfer Surface‐Based Mophometry (SBM) surface area and cortical thickness and alcohol variables, with age, sex, depression, anxiety, marijuana use, cigarette pack years, and intracranial volume included as covariates
| Cluster | ||||||||||||||||
|---|---|---|---|---|---|---|---|---|---|---|---|---|---|---|---|---|
| AUD | AUD‐C | AUD‐D | DpDD | S1 | S2 | S3 | S4 | S5 | S6 | S7 | S8 | S9 | S10 | S11 | ||
| AUD | 0.82** | 0.96** | 0.53** | −0.27** | −0.23** | −0.23** | −0.26** | −0.25** | −0.23** | −0.21** | −0.22** | −0.21** | −0.18** | −0.18** | ||
| AUD−C | 0.82** | 0.62** | 0.53** | −0.23** | −0.16* | −0.12* | −0.22** | −0.18** | −0.13* | −0.17** | −0.20** | −0.18** | −0.16* | −0.10 | ||
| AUD−D | 0.96** | 0.62** | 0.46** | −0.26** | −0.24** | −0.25** | −0.25** | −0.25** | −0.26** | −0.20** | −0.20** | −0.20** | −0.17** | −0.19** | ||
| DpDD | 0.53** | 0.53** | 0.46** | −0.20** | −0.16* | −0.13* | −0.16* | −0.15* | −0.18** | −0.12* | −0.15* | −0.22** | −0.14* | −0.21** | ||
| Cluster | S1 | −0.11* | −0.09 | −0.10 | −0.08 | 0.82** | 0.70** | 0.58** | 0.57** | 0.60** | 0.65** | 0.52** | 0.55** | 0.49** | 0.49** | |
| S2 | 0.00 | 0.00 | 0.00 | −0.02 | 0.62** | 0.68** | 0.49** | 0.60** | 0.55** | 0.60** | 0.52** | 0.55** | 0.41** | 0.54** | ||
| S3 | 0.03 | 0.02 | 0.04 | −0.04 | 0.41** | 0.46** | 0.43** | 0.52** | 0.61** | 0.58** | 0.47** | 0.47** | 0.37** | 0.55** | ||
| S4 | 0.04 | 0.06 | 0.03 | −0.01 | 0.19** | 0.24** | 0.18** | 0.48** | 0.36** | 0.42** | 0.54** | 0.42** | 0.35** | 0.33** | ||
| S5 | 0.07 | 0.04 | 0.08 | 0.08 | 0.10 | 0.11* | 0.17** | 0.02 | 0.44** | 0.42** | 0.46** | 0.46** | 0.33** | 0.44** | ||
| S6 | −0.05 | −0.05 | −0.05 | 0.02 | 0.09 | 0.17** | 0.18** | 0.13* | 0.11* | 0.47** | 0.37** | 0.41** | 0.37** | 0.53** | ||
| S7 | −0.03 | −0.02 | −0.03 | 0.02 | 0.37** | 0.27** | 0.17** | 0.12* | 0.08 | 0.19** | 0.48** | 0.41** | 0.36** | 0.47** | ||
| S8 | −0.03 | −0.01 | −0.03 | −0.04 | 0.21** | 0.24** | 0.22** | 0.11* | 0.03 | 0.12* | 0.15* | 0.43** | 0.32** | 0.39** | ||
| S9 | 0.03 | −0.01 | 0.04 | 0.10 | 0.25** | 0.16* | 0.15* | 0.02 | 0.08 | 0.08 | 0.18** | 0.14* | 0.25** | 0.34** | ||
| S10 | −0.02 | −0.01 | −0.02 | −0.03 | 0.17* | 0.20** | 0.13* | 0.17** | −0.02 | 0.01 | 0.12* | 0.07 | 0.05 | 0.28** | ||
| S11 | −0.06 | −0.03 | −0.06 | −0.04 | 0.07 | 0.11* | 0.06 | 0.11* | 0.03 | 0.14* | 0.01 | 0.05 | 0.07 | −0.02 | ||
Surface area results are shown below the diagonal; cortical thickness results are shown above the diagonal. See Table 2 for cluster labels.
AUD = AUDIT total score; AUD‐C = AUDIT consumption score; AUD‐D = AUDIT dependence and alcohol‐related problems score; DpDD = TLFB‐60 Drinks per Drinking Day.
**FDR < 0.001.
*FDR < 0.05.
Table 7.
Whole sample sex by Alcohol Use Disorders Identification Test (AUDIT) interaction and within‐groups AUDIT regression coefficients for Surface‐Based Morphometry (SBM) cortical thickness and surface area
| Whole Sample | Within Groups | |||||||||
|---|---|---|---|---|---|---|---|---|---|---|
| Sex × AUDIT Interaction | AUDIT Total Score | |||||||||
| Females | Males | |||||||||
| Annotation | ß | t | P | ß | t | P | ß | t | P | |
| Cortical Thickness | ||||||||||
| S1 | L Lateral Orbitofrontal | 0.131 | 3.363 | <0.001** | −0.414 | −6.062 | <0.001** | −0.153 | −2.566 | 0.011* |
| S2 | R Supramarginal | 0.109 | 2.727 | 0.007 | −0.353 | −4.816 | <0.001** | −0.139 | −2.341 | 0.020* |
| S3 | L Precuneus | 0.083 | 2.092 | 0.037 | −0.259 | −3.622 | <0.001** | −0.168 | −2.782 | 0.006* |
| S4 | L Superior Temporal | 0.109 | 2.438 | 0.015 | −0.408 | −4.936 | <0.001** | −0.195 | −2.967 | 0.003* |
| S5 | R Lateral Occipital | 0.043 | 0.986 | 0.325 | −0.299 | −3.535 | <0.001** | −0.226 | −3.540 | <0.001** |
| S6 | L Inferior Parietal | 0.049 | 1.140 | 0.255 | −0.268 | −3.195 | 0.002** | −0.218 | −3.451 | <0.001** |
| S7 | L Paracentral | 0.069 | 1.678 | 0.094 | −0.247 | −3.322 | 0.001** | −0.143 | −2.287 | 0.023* |
| S8 | R Middle Temporal | 0.051 | 1.168 | 0.244 | −0.360 | −4.265 | <0.001** | −0.149 | −2.346 | 0.020* |
| S9 | L Lingual | 0.087 | 2.048 | 0.041 | −0.311 | −3.896 | <0.001** | −0.160 | −2.585 | 0.010* |
| S10 | L Rostral Middle Frontal | 0.048 | 1.070 | 0.285 | −0.232 | −2.761 | 0.006* | −0.149 | −2.210 | 0.028 |
| S11 | R Inferior Parietal | 0.049 | 1.101 | 0.271 | −0.204 | −2.345 | 0.020* | −0.148 | −2.295 | 0.023* |
| Surface Area | ||||||||||
| S1 | L Lateral Orbitofrontal | −0.017 | −0.477 | 0.634 | −0.096 | −1.141 | 0.255 | −0.109 | −1.986 | 0.048 |
| S2 | R Supramarginal | −0.007 | −0.179 | 0.858 | 0.008 | 0.098 | 0.922 | −0.019 | −0.338 | 0.735 |
| S3 | L Precuneus | 0.023 | 0.605 | 0.546 | −0.005 | −0.058 | 0.954 | 0.052 | 0.843 | 0.400 |
| S4 | L Superior Temporal | 0.007 | 0.145 | 0.885 | 0.008 | 0.093 | 0.926 | 0.070 | 1.038 | 0.300 |
| S5 | R Lateral Occipital | 0.035 | 0.755 | 0.451 | 0.034 | 0.372 | 0.710 | 0.088 | 1.271 | 0.205 |
| S6 | L Inferior Parietal | −0.024 | −0.530 | 0.596 | −0.079 | −0.879 | 0.381 | −0.070 | −1.044 | 0.298 |
| S7 | L Paracentral | −0.035 | −0.827 | 0.408 | 0.033 | 0.378 | 0.706 | −0.046 | −0.740 | 0.460 |
| S8 | R Middle Temporal | −0.025 | −0.558 | 0.577 | −0.054 | −0.612 | 0.541 | −0.028 | −0.424 | 0.672 |
| S9 | L Lingual | 0.063 | 1.369 | 0.172 | −0.100 | −1.085 | 0.279 | 0.064 | 0.927 | 0.355 |
| S10 | L Rostral Middle Frontal | −0.024 | −0.533 | 0.594 | −0.045 | −0.519 | 0.605 | −0.023 | −0.333 | 0.739 |
| S11 | R Inferior Parietal | −0.026 | −0.549 | 0.583 | 0.020 | 0.217 | 0.829 | −0.111 | −1.562 | 0.120 |
L = Left; R = Right.
**FDR < 0.01.
*FDR < 0.05.
Table 8.
Whole sample age by Alcohol Use Disorders Identification Test (AUDIT) interaction and within‐groups AUDIT regression coefficients for Surface−Based Morphometry (SBM) cortical thickness and surface area
| Whole Sample | Within Groups | ||||||||||||
|---|---|---|---|---|---|---|---|---|---|---|---|---|---|
| Age × AUDIT Interaction | AUDIT Total Score | ||||||||||||
| Age 18–25 years | Age 26–35 years | Age 36–55 years | |||||||||||
| Annotation | ß | t | P | ß | t | P | ß | t | P | ß | t | P | |
| Cortical thickness | |||||||||||||
| S1 | L Lateral Orbitofrontal | 0.019 | 0.446 | 0.656 | −0.263 | −2.987 | 0.003* | −0.430 | −4.537 | <0.001** | −0.245 | −2.566 | 0.011* |
| S2 | R Supramarginal | 0.002 | 0.053 | 0.958 | −0.232 | −2.637 | 0.009* | −0.340 | −3.394 | <0.001** | −0.228 | −2.390 | 0.018 |
| S3 | L Precuneus | −0.019 | −0.459 | 0.646 | −0.057 | −0.643 | 0.522 | −0.511 | −5.177 | <0.001** | −0.168 | −1.740 | 0.084 |
| S4 | L Superior Temporal | −0.054 | −1.129 | 0.260 | −0.162 | −1.808 | 0.073 | −0.340 | −3.250 | 0.001** | −0.353 | −3.722 | <0.001** |
| S5 | R Lateral Occipital | 0.036 | 0.778 | 0.437 | −0.232 | −2.625 | 0.010* | −0.387 | −3.696 | <0.001** | −0.247 | −2.560 | 0.012* |
| S6 | L Inferior Parietal | −0.030 | −0.649 | 0.517 | −0.055 | −0.619 | 0.537 | −0.509 | −5.025 | <0.001** | −0.252 | −2.727 | 0.007* |
| S7 | L Paracentral | 0.040 | 0.920 | 0.358 | −0.222 | −2.565 | 0.011* | −0.266 | −2.635 | 0.009* | −0.161 | −1.670 | 0.097 |
| S8 | R Middle Temporal | −0.023 | −0.491 | 0.623 | −0.137 | −1.528 | 0.129 | −0.294 | −2.706 | 0.008* | −0.274 | −2.839 | 0.005* |
| S9 | L Lingual | −0.050 | −1.102 | 0.271 | −0.177 | −2.046 | 0.043 | −0.192 | −1.849 | 0.067 | −0.299 | −3.125 | 0.002* |
| S10 | L Rostral Middle Frontal | −0.011 | −0.232 | 0.817 | −0.141 | −1.602 | 0.111 | −0.278 | −2.637 | 0.009* | −0.195 | −2.031 | 0.044 |
| S11 | R Inferior Parietal | −0.014 | −0.287 | 0.774 | −0.100 | −1.156 | 0.249 | −0.292 | −2.696 | 0.008* | −0.189 | −2.063 | 0.041 |
| Surface area | |||||||||||||
| S1 | L Lateral Orbitofrontal | −0.008 | −0.206 | 0.837 | −0.025 | −0.359 | 0.720 | −0.143 | −1.915 | 0.058 | −0.134 | −1.762 | 0.080 |
| S2 | R Supramarginal | −0.058 | −1.476 | 0.141 | 0.042 | 0.636 | 0.526 | −0.004 | −0.046 | 0.963 | −0.061 | −0.749 | 0.456 |
| S3 | L Precuneus | −0.094 | −2.377 | 0.018 | 0.138 | 1.925 | 0.056 | 0.076 | 0.933 | 0.352 | −0.109 | −1.408 | 0.162 |
| S4 | L Superior Temporal | 0.002 | 0.051 | 0.960 | 0.052 | 0.615 | 0.540 | 0.002 | 0.021 | 0.984 | 0.063 | 0.669 | 0.505 |
| S5 | R Lateral Occipital | −0.106 | −2.210 | 0.028 | 0.228 | 2.737 | 0.007* | 0.116 | 1.153 | 0.251 | −0.042 | −0.430 | 0.668 |
| S6 | L Inferior Parietal | −0.021 | −0.428 | 0.669 | −0.049 | −0.567 | 0.572 | −0.017 | −0.165 | 0.869 | −0.077 | −0.804 | 0.423 |
| S7 | L Paracentral | 0.009 | 0.196 | 0.845 | 0.025 | 0.318 | 0.751 | −0.104 | −1.158 | 0.249 | −0.051 | −0.593 | 0.554 |
| S8 | R Middle Temporal | 0.083 | 1.778 | 0.076 | −0.095 | −1.169 | 0.244 | −0.116 | −1.145 | 0.254 | 0.062 | 0.682 | 0.497 |
| S9 | L Lingual | −0.003 | −0.058 | 0.953 | 0.069 | 0.837 | 0.404 | 0.011 | 0.103 | 0.918 | −0.018 | −0.192 | 0.848 |
| S10 | L Rostral Middle Frontal | −0.023 | −0.483 | 0.629 | 0.021 | 0.255 | 0.799 | −0.028 | −0.283 | 0.778 | −0.064 | −0.663 | 0.508 |
| S11 | R Inferior Parietal | −0.029 | −0.571 | 0.568 | 0.118 | 1.325 | 0.187 | −0.246 | −2.334 | 0.021 | −0.050 | −0.507 | 0.613 |
L = Left; R = Right.
**FDR < 0.01.
*FDR < 0.05.
Within cortical thickness, one cluster in left lateral OFC survived false discovery rate correction for significant sex by AUDIT interaction, such that cortical thickness showed stronger negative association with higher AUDIT score in women compared to men (see Fig. 4). In regard to age effects, there were no significant interactions within the whole sample GLMs, and results were similar in pattern to volume GLMs.
Figure 4.
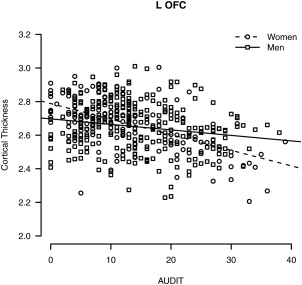
Significant sex by AUDIT interaction for FreeSurfer SBM cortical thickness in the left lateral OFC.
DISCUSSION
The current study employed two common anatomical analysis techniques in a large sample of adults to examine contributions of sex, age, and alcohol use severity to global GM loss. The two main aims of the current study were to provide updated localizations of regions vulnerable to heavy alcohol use, and to further localize regions that may be more vulnerable to heavy alcohol use among women compared to men and across this age spectrum (i.e., 18 to 55 years). While heavy alcohol use is well known for its negative association with brain structure, previous studies have been conducted among smaller samples, and updates to the existing literature are warranted for examination of sex and age effects. GLMs in both VBM and SBM included terms for age, alcohol use, sex, marijuana use, cigarette use, depression symptoms, anxiety symptoms, and ICV. In order to further characterize possible interactions with alcohol use, additional models also examined sex as a moderating factor and age by alcohol use interactions. As expected, age showed strongly negative associations with GM volume, but in larger than expected clusters that accounted for most of the cortical surface. Alcohol use severity showed medium effects above and beyond age and other covariates, with significant negative associations with regional volumes in all four lobes and the cerebellum, consistent with previous findings that suggest a broad, global effect of alcohol on GM volume [Le Berre et al., 2014]. The hypothesis that women would show more GM loss in the context of heavy alcohol use than men was partially supported, but interaction effects were weak overall. The hypothesis that regions including the OFC, cerebellum, and insula are likely to be more negatively impacted by alcohol at increased ages was also partially supported, but again interaction effects were relatively weak overall. An age by alcohol use interaction in the right insula survived statistical correction for multiple comparisons, such that the association between volume and AUDIT score was stronger with increased age. Within‐group analyses for age showed significant negative associations between AUDIT and volume in OFC, cerebellum, and other regions, with significant regional associations even within the youngest age group. Finally, repeating analyses within cortical thickness and surface area, which comprise the SBM measure of volume, indicated that volume effects are driven by reductions in cortical thickness as opposed to surface area.
With respect to peak effects of alcohol observed in this sample, higher AUDIT scores were negatively associated with GM volume in bilateral cerebellum for VBM, and in the left lateral OFC, supramarginal gyrus, precentral gyrus, superior and middle temporal cortices, precuneus, and inferior parietal cortex for SBM. Observed associations of alcohol with GM were of medium effect size over and above age and other covariates. Clusters suggest converging areas of particular association with heavy alcohol use, and replicate regions found in other studies among alcohol dependent patients, especially for frontal and temporal cortices, which broadly contribute to abilities in judgment, executive control and goal‐directed behaviors, and memory and sensory processing, respectively [Cardenas et al., 2007; Grodin et al., 2013; Jang et al., 2007; Le Berre et al., 2014]. These somewhat distributed regional findings were all replicated within our single sample. Overall, our results are consistent with global rather than regional associations of GM with heavy alcohol use, similar to other studies among younger samples [i.e., with a mean age in the 30s; Fein et al., 2010; Grodin et al., 2013].
Sex was examined as a moderating factor in associations between alcohol use and GM morphometry in order to expand and clarify the existing literature. Reports on sex effects on alcohol use and in vivo GM morphometry are relatively sparse considering evidence that the typical trajectory of disordered use is different between women and men [Mann et al., 2005]. Among adult samples, one existing study found an effect of sex such that the difference in GM volume between alcohol‐dependent and non‐dependent participants was greater for women than men [Hommer et al., 2001], although another study reported less brain atrophy among alcohol‐dependent women than men [Pfefferbaum et al., 2001]. For both VBM and SBM in the current results, the only statistically significant sex interaction occurred in the left lateral OFC for SBM cortical thickness. OFC volume is associated with alcohol dependence [Durazzo et al., 2011], particularly the compulsive quality of addictive behavior [Volkow and Fowler, 2000], and is involved in the reward/salience network. This finding could be consistent with the telescoping pattern that women tend to display in developing disordered drinking [Mann et al., 2005], such that women could develop problematic drinking over shorter exposure due to vulnerability of the OFC (i.e., steeper atrophy of the OFC leading to loss of control over drinking). More specific examination of sex effects may be warranted, and longitudinal investigation of the predictive value of OFC in trajectories of heavy drinking and sex differences could be particularly informative.
The current study also aimed to identify specific regions that might be more susceptible to the synergistic effects of age and heavy alcohol use. While more negative associations were observed across nearly all VBM clusters in the 36–55 group, these differences largely did not meet statistical significance in direct tests of the interaction. A significant age by AUDIT interaction was found in the right insula, in which the negative AUDIT to VBM association was greater with increasing age. This finding is consistent with a meta‐analysis showing that alcohol dependence is associated with GM atrophy in the insula [Xiao et al., 2015]. Given the role of the insula in reward learning [Preuschoff and Bossaerts, 2007] and interoception, our results suggest that with increased age, heavy alcohol exposure might lead to deficits in self awareness and increase sensitivity to physical sensations of craving [Goldstein et al., 2009].
Importantly, our results suggest that increased vulnerability to the deleterious effects of alcohol on brain atrophy might emerge earlier in the lifespan than has been previously investigated [i.e., starting the fifth decade of life as suggested by Welch, Carson and Lawrie, 2013]. Each age group showed significant negative effects in the large cluster that peaked in the cerebellum, which has an important role in processes classically associated with frontal lobe functioning, including problem solving and planning [Sullivan and Pfefferbaum, 2005]. Structural deficits in the cerebellum with heavy alcohol use may thus represent one source of acquired declines in executive functioning. The 18–25 group (i.e., emerging adults) additionally showed significant effects in the left supramarginal gyrus and right frontal pole and postcentral gyrus, while the 26–35 group (i.e., young adults) showed effects in the left medial frontal cortex, left precentral gyrus, and bilateral paracingulate gyrus. Overall, these results suggest that distributed regions related to reward‐related decision making [e.g., frontoparietal regions; Liu et al., 2011] may be vulnerable to structural decrements from heavy alcohol use beginning in emerging to young adulthood.
A strength of the current study is the complementary use of two commonly used anatomical analysis methods, FSL VBM and FreeSurfer SBM. Initial analyses in VBM and SBM showed qualitatively similar global associations of AUDIT and GM volume, although more cluster values were found with VBM than SBM. However, further analysis of the cortical thickness versus surface area indices showed comparable effects between SBM cortical thickness and VBM. Peak effects at higher significance thresholds localized to separate anatomical regions. Specifically, VBM resulted in peak significance in the cerebellum, while SBM resulted in several smaller clusters throughout temporal, parietal, and frontal regions. This lack of overlap of peak effects may be attributable to a range of differences in these analysis packages. FreeSurfer SBM does not include the cerebellum for whole‐brain surface‐based analyses. Beyond preventing direct comparison, this may have impacted calculation of significance thresholds based on larger number of voxels in the VBM analysis. Given that the cerebellum is a region involved in frontal/executive networks that have been implicated in heavy alcohol use [Weiland et al., 2014b], we chose to include the cerebellum in VBM models for an unaltered comparison of the two techniques. Future studies could consider masking out the cerebellum as a potentially more direct comparison of results. Further, volume assessed by VBM may be best conceptualized as a gross index of GM morphometry, while SBM measures may be somewhat more specialized [Smolker et al., 2015]. Specifically, cortical thickness showed stronger negative associations with AUDIT than surface area or volume, and further analyses exploring interactions among individual measures (e.g., cortical thickness and folding) may account for more variance in behavioral measures than these indices in isolation [Smolker et al., 2015]. Future studies on mechanisms underlying effects of alcohol on GM structure that investigate thinning of particular cortical layers could be extremely useful for informing cognitive functioning and treatment implications in AUD.
Limitations to the interpretation of our results include use of cross‐sectional data, which prevents full consideration of causality or the possible contributions of any preexisting conditions. This is particularly important to consider given that within‐subjects longitudinal designs would be most informative for separating age effects from other variables of interest. Participants whose data were included in these analyses were pooled from several studies, although with similar research foci, and the AUDIT was selected as the primary measure of interest due to its inclusion in all of those existing studies. The AUDIT offers high reliability and validity in terms of clinical symptoms of alcohol dependence [Saunders et al., 1993], as well as an advantage in providing an estimate of alcohol use severity without being as highly confounded with other common measures such as years of regular alcohol use. However, it is important to recognize that age and AUDIT were correlated at .14 in this sample (e.g., those with more severe symptoms are likely to develop disordered drinking over many years), and that it provides a measure of the previous 6 months rather than accounting for a more detailed history. This may then underestimate long‐term alcohol effects, and especially impact participants at the upper end of the age range. Further, these analyses utilized a continuous variable approach rather than including a separate control group and were restricted to a linear analysis. This might be an explanation for the lack of an age by AUDIT interaction effect in the current results, and represents a potential area of further study. Quadratic age effects have been observed in some regions [Terribilli et al., 2011], and nonlinear analyses may better capture associations among samples with a wider age range (i.e., late adolescents or emerging adults through middle adulthood).
In addition, these analyses included covariates for likely concomitant substance use of marijuana and tobacco, but any other substance use history is not accounted for in analyses, and only a portion of the sample underwent toxicology screening prior to participation or reported on major medical conditions that might impact brain structure. Marijuana and tobacco use were estimates only for the purpose of inclusion as covariates. Recent studies have suggested that marijuana use has equivocal or small associations with brain morphometry above and beyond heavy alcohol use [Lisdahl et al., 2014; Weiland et al., 2015]. Studies have more consistently demonstrated GM reductions with tobacco smoking [Brody et al., 2004; Gazdzinski et al., 2005]. In particular, one study found that patients with comorbid alcohol and tobacco use had smaller right precentral cortex than non‐drinking non‐smoking controls [Luhar et al., 2013]. Cigarette smoking has also been associated with exacerbated age‐related brain atrophy [Akiyama et al., 1997; Hayee et al., 2003; Kubota et al., 1987]. Including these variables as covariates may not adequately control for potential contributions of other substance use history, given how the covariates likely share a meaningful relationship with the predictor variable that can lead to inflated effect size estimates and Type I error [Miller and Chapman, 2001]. However, given the estimated effect sizes of alcohol use over and above age in this study, future studies that primarily focus on tobacco and marijuana use should carefully control for alcohol use history [Weiland et al., 2015].
CONCLUSION
Global reductions in GM volume at younger than expected ages (i.e., as early as emerging to young adulthood) may have important implications for AUD treatments. Given the early age of negative associations with heavy alcohol use suggested by our results, it is imperative to increase efficacy of treatments to avoid continued and increased harm with age. Heightened vulnerability to atrophy in frontoparietal regions involved in executive functions and reward processing as early as emerging adulthood suggests a possible mechanism of disorder progression. Our findings in temporal regions are consistent with a previous study on alcohol dependence that found GM decrease in superior temporal gyri, which was associated with perseverative responses and errors during an executive function measure [Jang et al., 2007]. Similarly, among alcohol dependent patients (ages 25–65), reduced GM volume in distributed regions including the frontal lobe, insula, and cerebellum was correlated with decrements in neuropsychological performance across a number of domains, particularly executive function [Chanraud et al., 2007]. Deficits in executive functioning that characterize alcohol dependence have been consistently associated with poorer treatment outcomes [Bates et al., 2013]. Cognitive rehabilitation may offer improved outcomes for recovery from problematic alcohol use beyond traditional treatments that require intact cognitive skills [Bates et al., 2013], especially considering recent evidence that GM volumes may begin to partially recover relatively quickly after the onset of abstinence [van Eijk et al., 2013].
REFERENCES
- Akiyama H, Meyer JS, Mortel KF, Terayama Y, Thornby JI, Konno S (1997): Normal human aging: Factors contributing to cerebral atrophy. J Neurol Sci 152:39–49. [DOI] [PubMed] [Google Scholar]
- Ashburner J, Friston KJ (2000): Voxel‐based morphometry—The methods. Neuroimage 11:805–821. [DOI] [PubMed] [Google Scholar]
- Bates ME, Buckman JF, Nguyen TT (2013): A role for cognitive rehabilitation in increasing the effectiveness of treatment for alcohol use disorders. Neuropsychol Rev 23:27–47. [DOI] [PMC free article] [PubMed] [Google Scholar]
- Beck AT, Steer RA (1993): Beck Anxiety Inventory Manual. San Antonio, TX: Psychological Corporation. [Google Scholar]
- Beck AT, Steer RA, Brown GK (1996): Manual for the Beck Depression Inventory‐II. San Antonio, TX: Psychological Corporation. [Google Scholar]
- Brody AL, Mandelkern MA, Jarvik ME, Lee GS, Smith EC, Huang JC, Bota RG, Bartzokis G, London ED (2004): Differences between smokers and nonsmokers in regional gray matter volumes and densities. Biol Psychiatry 55:77–84. [DOI] [PubMed] [Google Scholar]
- Cardenas VA, Studholme C, Gazdzinski S, Durazzo TC, Meyerhoff DJ (2007): Deformation‐based morphometry of brain changes in alcohol dependence and abstinence. Neuroimage 34:879–887. [DOI] [PMC free article] [PubMed] [Google Scholar]
- Chanraud S, Martelli C, Delain F, Kostogianni N, Douaud G, Aubin HJ, Reynaud M, Martinot JL (2007): Brain morphometry and cognitive performance in detoxified alcohol‐dependents with preserved psychosocial functioning. Neuropsychopharmacology 32:429–438. [DOI] [PubMed] [Google Scholar]
- Claus ED, Kiehl KA, Hutchison KE (2011): Neural and behavioral mechanisms of impulsive choice in alcohol use disorder. Alcohol Clin Exp Res 35:1209–1219. [DOI] [PMC free article] [PubMed] [Google Scholar]
- Dale AM, Sereno MI (1993): Improved localization of cortical activity by combining EEG and MEG with MRI cortical surface reconstruction: A linear approach. J Cogn Neurosci 5:162–176. [DOI] [PubMed] [Google Scholar]
- Dale AM, Fischl B, Sereno MI (1999): Cortical surface‐based analysis. I. Segmentation and surface reconstruction. Neuroimage 9:179–194. [DOI] [PubMed] [Google Scholar]
- DeCarli C, Massaro J, Harvey D, Hald J, Tullberg M, Au R, Beiser A, D'Agostino R, Wolf PA (2005): Measures of brain morphology and infarction in the Framingham Heart Study: Establishing what is normal. Neurobiol Aging 26:491–510. [DOI] [PubMed] [Google Scholar]
- V Di Sclafani, F Ezekiel, DJ Meyerhoff, S MacKay, WP Dillon, MW Weiner, G Fein (1995): Brain atrophy and cognitive function in older abstinent alcoholic men. Alcohol Clin Exp Res 19:1121–1126. [DOI] [PMC free article] [PubMed] [Google Scholar]
- Doallo S, Cadaveira F, Corral M, Mota N, López‐Caneda E, Holguín SR (2014): Larger mid‐dorsolateral prefrontal gray matter volume in young binge drinkers revealed by voxel‐based morphometry. PLoS One 9:e96380. [DOI] [PMC free article] [PubMed] [Google Scholar]
- B Draganski, A Lutti, F Kherif (2013): Impact of brain aging and neurodegeneration on cognition: evidence from MRI. Curr Opin Neurol 26:640–645. [DOI] [PubMed] [Google Scholar]
- Durazzo TC, Tosun D, Buckley S, Gazdzinski S, Mon A, Fryer SL, Meyerhoff DJ (2011): Cortical thickness, surface area, and volume of the brain reward system in alcohol dependence: Relationships to relapse and extended abstinence. Alcohol Clin Exp Res 35:1187–1200. [DOI] [PMC free article] [PubMed] [Google Scholar]
- RJ Ellis, M Oscar‐Berman (1989): Alcoholism, aging, and functional cerebral asymmetries. Psychol Bull 106:128–147. [DOI] [PubMed] [Google Scholar]
- Faul F, Erdfelder E, Buchner A, Lang AG (2009): Statistical power analyses using G*Power 3.1: Tests for correlation and regression analyses. Behav Res Methods 41:1149–1160. [DOI] [PubMed] [Google Scholar]
- Fein G, Di Sclafani V, Cardenas VA, Goldmann H, Tolou‐Shams M, Meyerhoff DJ (2002): Cortical gray matter loss in treatment‐naïve alcohol dependent individuals. Alcohol Clin Exp Res 26:558–564. [PMC free article] [PubMed] [Google Scholar]
- Fein G, Shimotsu R, Barakos J (2010): Age‐related gray matter shrinkage in a treatment naïve actively drinking alcohol‐dependent sample. Alcohol Clin Exp Res 34:175–182. [DOI] [PMC free article] [PubMed] [Google Scholar]
- Fischl B, Dale AM (2000): Measuring the thickness of the human cerebral cortex from magnetic resonance images. Proc Natl Acad Sci U S A 97:11050–11055. [DOI] [PMC free article] [PubMed] [Google Scholar]
- Fischl B, Liu A, Dale AM (2001): Automated manifold surgery: Constructing geometrically accurate and topologically correct models of the human cerebral cortex. IEEE Trans Med Imaging 20:70–80. [DOI] [PubMed] [Google Scholar]
- Fischl B, Salat DH, Busa E, Albert M, Dieterich M, Haselgrove C, van der Kouwe A, Killiany R, Kennedy D, Klaveness S, Montillo A, Makris N, Rosen B, Dale AM (2002): Whole brain segmentation: Automated labeling of neuroanatomical structures in the human brain. Neuron 33:341–355. [DOI] [PubMed] [Google Scholar]
- Fischl B, van der Kouwe A, Destrieux C, Halgren E, Ségonne F, Salat DH, Busa E, Seidman LJ, Goldstein J, Kennedy D, Caviness V, Makris N, Rosen B, Dale AM (2004): Automatically parcellating the human cerebral cortex. Cereb Cortex 14:11–22. [DOI] [PubMed] [Google Scholar]
- Gazdzinski S, Durazzo TC, Studholme C, Song E, Banys P, Meyerhoff DJ (2005): Quantitative brain MRI in alcohol dependence: Preliminary evidence for effects of concurrent chronic cigarette smoking on regional brain volumes. Alcohol Clin Exp Res 29:1484–1495. [DOI] [PubMed] [Google Scholar]
- RZ Goldstein, AD Craig, A Bechara, H Garavan, AR Childress, MP Paulus, ND Volkow (2009): The neurocircuitry of impaired insight in drug addiction. Trends Cogn Sci 13:372–380. [DOI] [PMC free article] [PubMed] [Google Scholar]
- Good CD, Johnsrude IS, Ashburner J, Henson RN, Friston KJ, Frackowiak RS (2001): A voxel‐based morphometric study of ageing in 465 normal adult human brains. Neuroimage 14:21–36. [DOI] [PubMed] [Google Scholar]
- Grodin EN, Lin H, Durkee CA, Hommer DW, Momenan R (2013): Deficits in cortical, diencephalic and midbrain gray matter in alcoholism measured by VBM: Effects of co‐morbid substance abuse. Neuroimage Clin 2:469–476. [DOI] [PMC free article] [PubMed] [Google Scholar]
- Harada CN, Natelson Love MC, Triebel KL (2013): Normal cognitive aging. Clin Geriatr Med 29:737–752. [DOI] [PMC free article] [PubMed] [Google Scholar]
- Harper C, Kril J (1985): Brain atrophy in chronic alcoholic patients: A quantitative pathological study. J Neurol Neurosurg Psychiatry 48:211–217. [DOI] [PMC free article] [PubMed] [Google Scholar]
- Hayee A, Haque A, Anwarullah AK, Rabbani MG (2003): Smoking enhances age related brain atrophy—A quantitative study with computed tomography. Bangladesh Med Res Counc Bull 29:118–124. [PubMed] [Google Scholar]
- Hommer D, Momenan R, Kaiser E, Rawlings R (2001): Evidence for a gender‐related effect of alcoholism on brain volumes. Am J Psychiatry 158:198–204. [DOI] [PubMed] [Google Scholar]
- Howell NA, Worbe Y, Lange I, Tait R, Irvine M, Banca P, Harrison, Bullmore ET, Hutchison WD, Voon V (2013): Increased ventral striatal volume in college‐aged binge drinkers. PLoS One 8:e74164. [DOI] [PMC free article] [PubMed] [Google Scholar]
- Jang DP, Namkoong K, Kim JJ, Park S, Kim IY, Kim SI, Kim YB, Cho ZH, Lee E (2007): The relationship between brain morphometry and neuropsychological performance in alcohol dependence. Neurosci Lett 428:21–26. [DOI] [PubMed] [Google Scholar]
- Jernigan TL, Archibald SL, Berhow MT, Sowell ER, Foster DS, Hesselink JR (1991): Cerebral structure on MRI, Part I: Localization of age‐related changes. Biol Psychiatry 29:55–67. [DOI] [PubMed] [Google Scholar]
- Jernigan TL, Archibald SL, Fennema‐Notestine C, Gamst AC, Stout JC, Bonner J, Hesselink JR (2001): Effects of age on tissues and regions of the cerebrum and cerebellum. Neurobiol Aging 22:581–594. [DOI] [PubMed] [Google Scholar]
- John JP, Lukose A, Bagepally BS, Halahalli HN, Moily NS, Vijayakumari AA, Jain S (2015): A systematic examination of brain volumetric abnormalities in recent‐onset schizophrenia using voxel‐based, surface‐based and region‐of‐interest‐based morphometric analyses. J Negat Results Biomed 14:11. [DOI] [PMC free article] [PubMed] [Google Scholar]
- Kalpouzos G, Chételat G, Baron JC, Landeau B, Mevel K, Godeau C, Barré L, Constans JM, Viader F, Eustache F, Desgranges B (2009): Voxel‐based mapping of brain gray matter volume and glucose metabolism profiles in normal aging. Neurobiol Aging 30:112–124. [DOI] [PubMed] [Google Scholar]
- Kubota K, Matsuzawa T, Fujiwara T, Yamaguchi T, Ito K, Watanabe H, Ono S (1987): Age‐related brain atrophy enhanced by smoking: A quantitative study with computed tomography. Tohoku J Exp Med 153:303–311. [DOI] [PubMed] [Google Scholar]
- Le Berre AP, Rauchs G, La Joie R, Mézenge F, Boudehent C, Vabret F, Segobin S, Viader F, Allain P, Eustache F, Pitel AL, Beaunieux H (2014): Impaired decision‐making and brain shrinkage in alcoholism. Eur Psychiatry 29:125–133. [DOI] [PubMed] [Google Scholar]
- Lisdahl KM, Wright NE, Kirchner‐Medina C, Maple KE, Shollenbarger S (2014): Considering cannabis: The effects of regular cannabis use on neurocognition in adolescents and young adults. Curr Addict Rep 1:144–156. [DOI] [PMC free article] [PubMed] [Google Scholar]
- Liu X, Hairston J, Schrier M, Fan J (2011): Common and distinct networks underlying reward valence and processing stages: A meta‐analysis of functional neuroimaging studies. Neurosci Biobehav Rev 35:1219–1236. [DOI] [PMC free article] [PubMed] [Google Scholar]
- Luhar RB, Sawyer KS, Gravitz Z, Ruiz SM, Oscar‐Berman M (2013): Brain volumes and neuropsychological performance are related to current smoking and alcoholism history. Neuropsychiatr Dis Treat 9:1767–1784. [DOI] [PMC free article] [PubMed] [Google Scholar]
- Makris N, Oscar‐Berman M, Jaffin SK, Hodge SM, Kennedy DN, Caviness VS, Marinkovic K, Breiter HC, Gasic GP, Harris GJ (2008): Decreased volume of the brain reward system in alcoholism. Biol Psychiatry 64:192–202. [DOI] [PMC free article] [PubMed] [Google Scholar]
- Mann K, Ackermann K, Croissant B, Mundle G, Nakovics H, Diehl A (2005): Neuroimaging of gender differences in alcohol dependence: Are women more vulnerable? Alcohol Clin Exp Res 29:896–901. [DOI] [PubMed] [Google Scholar]
- Mechtcheriakov S, Brenneis C, Egger K, Koppelstaetter F, Schocke M, Marksteiner J (2007): A widespread distinct pattern of cerebral atrophy in patients with alcohol addiction revealed by voxel‐based morphometry. J Neurol Neurosurg Psychiatry 78:610–614. [DOI] [PMC free article] [PubMed] [Google Scholar]
- Miller GA, Chapman JP (2001): Misunderstanding analysis of covariance. J Abnorm Psychol 110:40–48. [DOI] [PubMed] [Google Scholar]
- Momenan R, Steckler LE, Saad ZS, van Rafelghem S, Kerich MJ, Hommer DW (2012): Effects of alcohol dependence on cortical thickness as determined by magnetic resonance imaging. Psychiatry Res 204:101–111. [DOI] [PubMed] [Google Scholar]
- Paul CA, Au R, Fredman L, Massaro JM, Seshadri S, Decarli C, Wolf PA (2008): Association of alcohol consumption with brain volume in the Framingham study. Arch Neurol 65:1363–1367. [DOI] [PMC free article] [PubMed] [Google Scholar]
- Pfefferbaum A, Lim KO, Zipursky RB, Mathalon DH, Rosenbloom MJ, Lane B, Ha CN, Sullivan EV (1992): Brain gray and white matter volume loss accelerates with aging in chronic alcoholics: A quantitative MRI study. Alcohol Clin Exp Res 16:1078–1089. [DOI] [PubMed] [Google Scholar]
- Pfefferbaum A, Mathalon DH, Sullivan EV, Rawles JM, Zipursky RB, Lim KO (1994): A quantitative magnetic resonance imaging study of changes in brain morphology from infancy to late adulthood. Arch Neurol 51:874–887. [DOI] [PubMed] [Google Scholar]
- A Pfefferbaum, M Rosenboom, A Deshmukh, E Sullivan (2001): Sex differences in the effects of alcohol on brain structure. Am J Psychiatry 158:188–197. [DOI] [PubMed] [Google Scholar]
- A Pfefferbaum, EV Sullivan, DH Mathalon, KO Lim (1997): Frontal lobe volume loss observed with magnetic resonance imaging in older chronic alcoholics. Alcohol Clin Exp Res 21:521–529. [DOI] [PubMed] [Google Scholar]
- Preuschoff K, Bossaerts P (2007): Adding prediction risk to the theory of reward learning. Ann N Y Acad Sci 1104:135–146. [DOI] [PubMed] [Google Scholar]
- Raz N, Gunning FM, Head D, Dupuis JH, McQuain J, Briggs SD, Loken WJ, Thornton AE, Acker JD (1997): Selective aging of the human cerebral cortex observed in vivo: Differential vulnerability of the prefrontal gray matter. Cereb Cortex 7:268–282. [DOI] [PubMed] [Google Scholar]
- Raz N, Gunning‐Dixon FM, Head D, Dupuis JH, Acker JD (1998): Neuroanatomical correlates of cognitive aging: Evidence from structural magnetic resonance imaging. Neuropsychology 12:95. [DOI] [PubMed] [Google Scholar]
- Resnick SM, Goldszal AF, Davatzikos C, Golski S, Kraut MA, Metter EJ, Bryan RN, Zonderman AB (2000): One‐year age changes in MRI brain volumes in older adults. Cereb Cortex 10:464–472. [DOI] [PubMed] [Google Scholar]
- Reuter M, Rosas HD, Fischl B (2010): Highly accurate inverse consistent registration: A robust approach. Neuroimage 53:1181–1196. [DOI] [PMC free article] [PubMed] [Google Scholar]
- Saunders JB, Aasland OG, Babor TF, de la Fuente JR, Grant M (1993): Development of the Alcohol Use Disorders Identification Test (AUDIT): WHO collaborative project on early detection of persons with harmful alcohol consumption–II. Addiction 88:791–804. [DOI] [PubMed] [Google Scholar]
- Ségonne F, Dale AM, Busa E, Glessner M, Salat D, Hahn HK, Fischl B (2004): A hybrid approach to the skull stripping problem in MRI. Neuroimage 22:1060–1075. [DOI] [PubMed] [Google Scholar]
- Ségonne F, Pacheco J, Fischl B (2007): Geometrically accurate topology‐correction of cortical surfaces using nonseparating loops. IEEE Trans Med Imaging 26:518–529. [DOI] [PubMed] [Google Scholar]
- Seshadri S, Wolf PA, Beiser A, Elias MF, Au R, Kase CS, D'Agostino RB, DeCarli C (2004): Stroke risk profile, brain volume, and cognitive function: The Framingham Offspring Study. Neurology 63:1591–1599. [DOI] [PubMed] [Google Scholar]
- Shear PK, Butters N, Jernigan TL, DiTraglia GM, Irwin M, Schuckit MA, Cermak LS (1992): Olfactory loss in alcoholics: Correlations with cortical and subcortical MRI indices. Alcohol 9:247–255. [DOI] [PubMed] [Google Scholar]
- Sled JG, Zijdenbos AP, Evans AC (1998): A nonparametric method for automatic correction of intensity nonuniformity in MRI data. IEEE Trans Med Imaging 17:87–97. [DOI] [PubMed] [Google Scholar]
- Smolker HR, Depue BE, Reineberg AE, Orr JM, Banich MT (2015): Individual differences in regional prefrontal gray matter morphometry and fractional anisotropy are associated with different constructs of executive function. Brain Struct Funct 220:1291–1306. [DOI] [PMC free article] [PubMed] [Google Scholar]
- Sobell LC, Sobell MB (1992): Timeline follow‐back: A technique for assessing self‐reported alcohol consumption In: Litten RZ, Allen JP, editors. Measuring Alcohol Consumption: Psychosocial and Biochemical Methods. New Jersey: The Umana Press Inc; pp 41–72. [Google Scholar]
- Sowell ER, Thompson PM, Holmes CJ, Jernigan TL, Toga AW (1999): In vivo evidence for post‐adolescent brain maturation in frontal and striatal regions. Nat Neurosci 2:859–861. [DOI] [PubMed] [Google Scholar]
- Sullivan EV, Pfefferbaum A (2005): Neurocircuitry in alcoholism: A substrate of disruption and repair. Psychopharmacology 180:583–594. [DOI] [PubMed] [Google Scholar]
- Terribilli D, Schaufelberger MS, Duran FL, Zanetti MV, Curiati PK, Menezes PR, Scazufca M, Amaro E Jr, Leite CC, Busatto GF (2011): Age‐related gray matter volume changes in the brain during non‐elderly adulthood. Neurobiol Aging 32:354–368. [DOI] [PMC free article] [PubMed] [Google Scholar]
- van Eijk J, Demirakca T, Frischknecht U, Hermann D, Mann K, Ende G (2013): Rapid partial regeneration of brain volume during the first 14 days of abstinence from alcohol. Alcohol Clin Exp Res 37:67–74. [DOI] [PubMed] [Google Scholar]
- van Holst RJ, de Ruiter MB, van den Brink W, Veltman DJ, Goudriaan AE (2012): A voxel‐based morphometry study comparing problem gamblers, alcohol abusers, and healthy controls. Drug Alcohol Depend 124:142–148. [DOI] [PubMed] [Google Scholar]
- Volkow ND, Fowler JS (2000): Addiction, a disease of compulsion and drive: Involvement of the orbitofrontal cortex. Cereb Cortex 10:318–325. [DOI] [PubMed] [Google Scholar]
- Weiland BJ, Korycinski ST, Soules M, Zubieta JK, Zucker RA, Heitzeg MM (2014a): Substance abuse risk in emerging adults associated with smaller frontal gray matter volumes and higher externalizing behaviors. Drug Alcohol Depend 137:68–75. [DOI] [PMC free article] [PubMed] [Google Scholar]
- Weiland BJ, Sabbineni A, Calhoun VD, Welsh RC, Bryan AD, Jung RE, Mayer AR, Hutchison KE (2014b): Reduced left executive control network functional connectivity is associated with alcohol use disorders. Alcohol Clin Exp Res 38:2445–2453. [DOI] [PMC free article] [PubMed] [Google Scholar]
- Weiland BJ, Thayer RE, Depue BE, Sabbineni A, Bryan AD, Hutchison KE (2015): Daily marijuana use is not associated with brain morphometric measures in adolescents or adults. J Neurosci 35:1505–1512. [DOI] [PMC free article] [PubMed] [Google Scholar]
- Welch KA, Carson A, Lawrie SM (2013): Brain structure in adolescents and young adults with alcohol problems: Systematic review of imaging studies. Alcohol Alcohol 48:433–444. [DOI] [PubMed] [Google Scholar]