Abstract
Nonalcoholic fatty liver disease (NAFLD) is the most common form of chronic liver disease in developed countries. NAFLD describes a wide range of liver pathologies from simple steatosis to nonalcoholic steatohepatitis (NASH) and cirrhosis. NASH is distinguished from simple steatosis by inflammation, cell death and fibrosis. In this study we found that mice lacking triacylglycerol hydrolase (TGH, also known as carboxylesterase 3 or carboxylesterase 1d) are protected from high-fat diet (HFD) - induced hepatic steatosis via decreased lipogenesis, increased fatty acid oxidation and improved hepatic insulin sensitivity. To examine the effect of the loss of TGH function on the more severe NAFLD form NASH, we ablated Tgh expression in two independent NASH mouse models, Pemt−/− mice fed HFD and Ldlr−/− mice fed high-fat, high-cholesterol Western-type diet (WTD). TGH deficiency reduced liver inflammation, oxidative stress and fibrosis in Pemt−/− mice. TGH deficiency also decreased NASH in Ldlr−/− mice. Collectively, these findings indicate that TGH deficiency attenuated both simple hepatic steatosis and irreversible NASH.
Nonalcoholic fatty liver disease (NAFLD) is recognized as the leading cause of chronic liver injury in Western societies. It is commonly associated with insulin resistance, type 2 diabetes and cardiovascular disease. Clinical phonotypes of NAFLD extend from simple steatosis, which is characterized by excess deposition of triacylglycerol (TG) in the liver, to nonalcoholic steatohepatitis (NASH), which is distinguished from steatosis by the presence of hepatocyte injury (ballooning and cell death), inflammation and/or fibrosis. NASH can further progress to liver cirrhosis and hepatocellular carcinoma1,2.
Mouse carboxylesterases have been shown to participate in hepatic lipid metabolism, including carboxylesterase 3 (Ces3)3,4,5 and carboxylesterase 1 (Ces1)6,7. Mouse Ces3 is also annotated as triacylglycerol hydrolase (TGH) or Ces1d, while Ces1 is also annotated as esterase-x (Es-x) or Ces1 g8. The human ortholog of mouse Ces3/TGH/Ces1d is CES18. The human ortholog of mouse Ces1/Es-x/Ces1 g has not yet been defined. Some reports used the human nomenclature CES1 also for mouse Ces1/Es-x/Ces1 g9,7,10. However, it is important to distinguish between Ces3/TGH/Ces1d and Ces1/Es-x/Ces1 g because these two carboxylesterases play very different metabolic functions6,11. We will refer to CES1/Ces3/Ces1d/TGH as TGH in this study. TGH participates in basal lipolysis in adipocytes12,13. In the liver, TGH is involved in the provision of substrates for the assembly of hepatic very low-density lipoproteins (VLDL) and inhibition of TGH decreased VLDL secretion both in vitro and in vivo4,14,15. Blocking hepatic VLDL assembly and secretion can lead to severe hepatic lipid accumulation16, but this condition was prevented in TGH deficient (Tgh−/−) mice due to the compensatory effect of decreased non-esterified fatty acid (NEFA) flux from the adipose tissue to liver and increased hepatic fatty acid oxidation15,17. In humans, elevated TGH expression was observed in patients with steatosis and NASH18. However, the role of TGH in NAFLD development has not been determined.
Phosphatidylethanolamine N-methyltransferase (PEMT) catalyzes the conversion of phosphatidylethanolamine (PE) to phosphatidylcholine (PC), which is quantitatively important in the liver PC synthesis19,20. Loss-of-function single nucleotide polymorphism in human PEMT is correlated with increased risk of NAFLD21. Pemt−/− mice are susceptible to diet-induced liver steatosis22 and NASH. One week of high-fat diet (HFD) feeding of Pemt−/− mice was sufficient to induce liver steatosis and NASH features including inflammation and oxidative stress22, and prolonged HFD feeding period (10 weeks) resulted in severe liver damage in Pemt−/− mice23. The development of steatosis in Pemt−/− mice is likely to due to the reduction of PC required for VLDL assembly. Aberrant PC homeostasis and decreased PC to PE ratio caused by PEMT deficiency leads to impairment of plasma membrane integrity and leakage of hepatocellular content into the extracellular space, which can provoke NASH features such as inflammation and hepatocyte injury20,22,24. NASH also develops in LDL receptor knockout (Ldlr−/−) mice fed high-fat, high-cholesterol Western-type diet (WTD)25,26. The current study suggests that the loss of TGH function is protective against development of HFD-induced hepatic steatosis and also ameliorates NASH in Pemt−/− and Ldlr−/− mice.
Results
Absence of TGH Attenuates HFD Induced Hepatic Steatosis
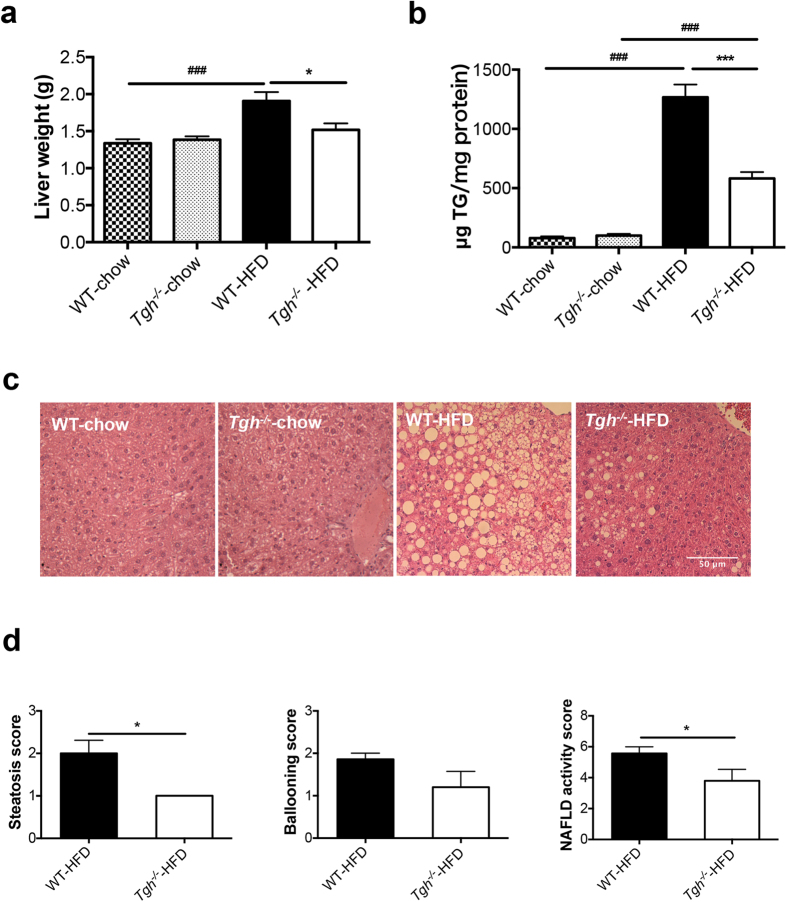
Tgh−/− mice on chow diet showed decreased plasma TG with unaltered liver weight and absence of liver TG accumulation (Supplementary Table 1, Fig. 1a,b). No histological differences in the liver were observed between chow fed Tgh−/− and WT mice (Fig. 1c).
Figure 1. TGH deficiency attenuates diet induced liver steatosis.
(a) Liver weight of WT and Tgh−/− mice on chow and HFD (n = 5–7). (b) Hepatic TG mass (n = 5–7). (c) Liver slices were stained with hematoxylin and eosin (n = 5). (d) Liver histology was clinically assessed for steatosis, ballooning, and NAFLD activity scores. Data are mean ± SEM, *P < 0.05, **P < 0.01, ***P < 0.001 vs WT mice on the same diet condition, ###P < 0.001 vs chow diet fed mice in the same genotype.
Both Tgh−/− and control wild-type (WT) mice exhibited similar increase in weight gain when fed HFD for 16 weeks (Supplementary Table 1). As expected, HFD feeding in WT mice increased liver weight and liver TG accumulation (Fig. 1a,b). However, reduction of liver TG mass by 54.1% was observed in Tgh−/− mice fed HFD when compared with WT mice on the same diet. Importantly, while liver weight of WT mice fed HFD significantly increased, liver weight of Tgh−/− mice fed HFD did not statistically differ from liver weights of WT or Tgh−/− mice fed chow diet (Fig. 1a). Consequently, liver histology showed steatosis in HFD fed WT mice, whereas TGH deficiency ameliorated the pathology (Fig. 1c,d). Hepatic free fatty acid (FFA) concentration in HFD fed Tgh−/− mice showed a decreased trend (p = 0.077) (Supplementary Fig. 1). Perilipin 2, a lipid droplet (LD)-associated protein, was reduced in the liver of Tgh−/− mice fed a HFD (Fig. 2a). Increased mRNA expression of CIDEA is positively correlated with the severity of hepatic steatosis in humans27. Expression of Cidea was significantly reduced in the livers of Tgh−/− mice fed HFD (Fig. 2b).
Figure 2. TGH deficiency ameliorates steatosis through various metabolic pathways.
(a) Perilipin 2 abundance evaluated by immunoblot in HFD fed WT and Tgh−/− mice, Immunoblotting for PDI was used as control for protein loading. (b) mRNA expression of Cidea in HFD fed WT and Tgh−/− mice (n = 5). (c) De novo lipogenesis was assessed by synthesis of FA from [3H]acetic acid that are incorporated into TG in primary hepatocytes isolated from chow and HFD fed WT and Tgh−/− mice. (d) mRNA expression of Srebf1c. (e) Liver SCD-1 abundance in HFD fed WT and Tgh−/− mice was assessed by immunoblotting. Calnexin immunoblotting was used as control for protein loading. (f) Immunoblotting for liver phospho-(Ser79) acetyl-CoA carboxylase (ACC) and total ACC in HFD fed WT and Tgh−/− mice. Immunoreactive bands were quantified by the densitometric analysis and the p-ACC/ACC ratio was calculated. (g) mRNA expression of genes related to FA oxidation (n = 5,6). (h) Hepatic In vivo insulin signaling. Immunoreactive bands were quantified by the densitometric analysis and the pAkt/total-Akt ratio was calculated in each condition. Data are mean ± SEM, *P < 0.05, **P < 0.01, ***P < 0.001 vs WT group on the same diet condition, #P < 0.05, ##P < 0.01, ###P < 0.001 vs chow diet fed group in the same genotype.
Hepatic de novo lipogenesis is an important contributing factor to hepatic steatosis and the role of FA synthesis is especially critical in HFD fed condition28,29. In agreement with the reported effect of HFD feeding on lipogenesis28, de novo TG synthesis assessed by acetate incorporation was increased by 136% in hepatocytes from WT mice fed a HFD when compared to chow fed WT mice and this increase was significantly reduced by the absence of TGH (Fig. 2c). This reduction of lipogenesis in Tgh−/− mice after HFD could be in part attributed to reduced expression of Srebf1c (Fig. 2d) and its key target stearoyl-CoA desaturase-1 (SCD1) (Fig. 2e). Similarly, the abundance of another Srebf1c target acetyl-CoA carboxylase (ACC) was reduced in Tgh−/− livers, while the ratio of phospho-(Ser79) ACC to total ACC was not affected (Fig. 2f). Hepatic expression of FA oxidation related genes Cpt1α, Lcad, and Mcad were increased in HFD fed Tgh−/− mice (Fig. 2g), suggesting increased FA oxidation.
Because augmented lipogenesis after HFD feeding is often associated with impaired hepatic insulin sensitivity30,31, in vivo insulin signaling assay was performed in mice after HFD feeding. Compared to the WT group, livers of Tgh−/− mice showed increased insulin-stimulated Akt phosphorylation, suggesting improved insulin sensitivity (Fig. 2h).
Decreased VLDL-TG Production in Tgh−/−/Pemt−/− Mice
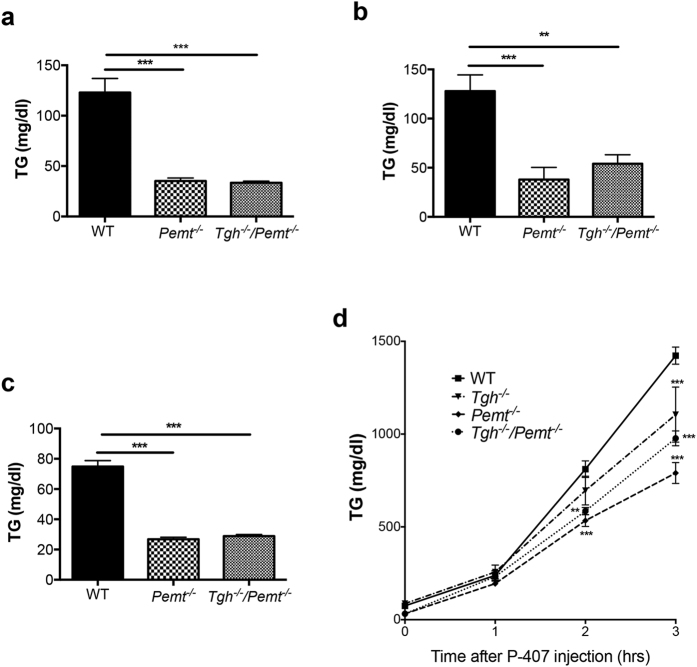
To investigate whether TGH deficiency can prevent NASH, a more severe form of hepatic steatosis, we crossed Tgh−/− mice with Pemt−/− mice (Supplementary Fig. 2). Pemt−/− mice exhibited dramatically decreased plasma TG when fed chow diet (Fig. 3a), after short-term (1 week) HFD feeding (Fig. 3b), and after long-term (10 weeks) HFD feeding (Fig. 3c). Tgh−/−/Pemt−/− mice fed chow and HFD showed similar decrease of plasma TG concentrations as Pemt−/− mice on the same diet condition (Fig. 3a–c). Reduced VLDL-TG secretion rate in vivo was observed in 10-week HFD fed Tgh−/−, Pemt−/− and Tgh−/−/Pemt−/− mice (Fig. 3d).
Figure 3. VLDL production and plasma TG concentrations in Pemt−/− and Tgh−/−/Pemt−/− mice fed chow and HFD.
(a) Plasma TG levels in WT, Pemt−/−, and Tgh−/−/Pemt−/− mice fed chow. (b) Plasma TG levels in WT, Pemt−/−, and Tgh−/−/Pemt−/− mice after 1 week of HFD. (c) Plasma TG levels in WT, Pemt−/−, and Tgh−/−/Pemt−/− mice after 10 weeks of HFD. (d) In vivo VLDL-TG secretion in WT, Tgh−/−, Pemt−/−, and Tgh−/−/Pemt−/− mice after 10 weeks of HFD. n = 5,6. Data are mean ± SEM, **P < 0.01, ***P < 0.001 vs WT control.
TGH Deficiency Attenuates NASH in Pemt−/− Mice
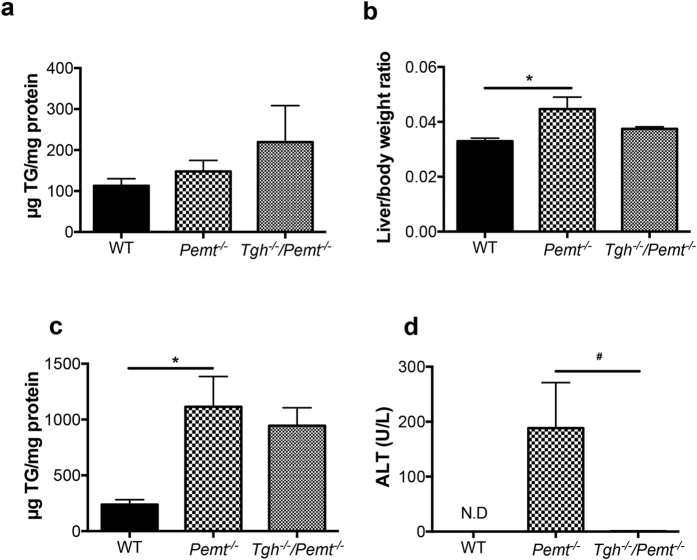
While Pemt−/− and Tgh−/−/Pemt−/− mice contained comparable TG concentration in livers as WT mice when fed a chow diet (Fig. 4a), one week of HFD feeding significantly increased liver weights and TG mass in Pemt−/− mice (Fig. 4b,c). Although liver weight was reduced in Tgh−/−/Pemt−/− mice, TG mass did not change significantly compared with Pemt−/− mice after 1 week HFD (Fig. 4b,c). Liver cholesterol levels also did not differ between Pemt−/− and Tgh−/−/Pemt−/− mice (Supplementary Fig. 3), although the expression of key genes regulating sterol synthesis was decreased by TGH deficiency (Supplementary Fig. 4). However, the dramatically elevated plasma alanine-amino transferase (ALT) in Pemt−/− mice was not observed in Tgh−/−/Pemt−/− mice indicating absence of liver damage in Tgh−/−/Pemt−/− mice (Fig. 4d).
Figure 4. Hepatic metabolic parameters in Pemt−/− and Tgh−/−/Pemt−/− mice fed chow and 1 week HFD.
(a) Liver TG mass in WT, Pemt−/− and Tgh−/−/Pemt−/− mice fed chow. (b) Liver/ body weight ratio in WT, Pemt−/− and Tgh−/−/Pemt−/− mice after 1 week HFD. (c) Liver TG mass in WT, Pemt−/− and Tgh−/−/Pemt−/− mice after 1 week HFD. (d) Plasma ALT in WT, Pemt−/− and Tgh−/−/Pemt−/− mice after 1 week HFD. n = 5,6. Data are mean ± SEM. *P < 0.05 vs WT control, #P < 0.05 vs Pemt−/− mice.
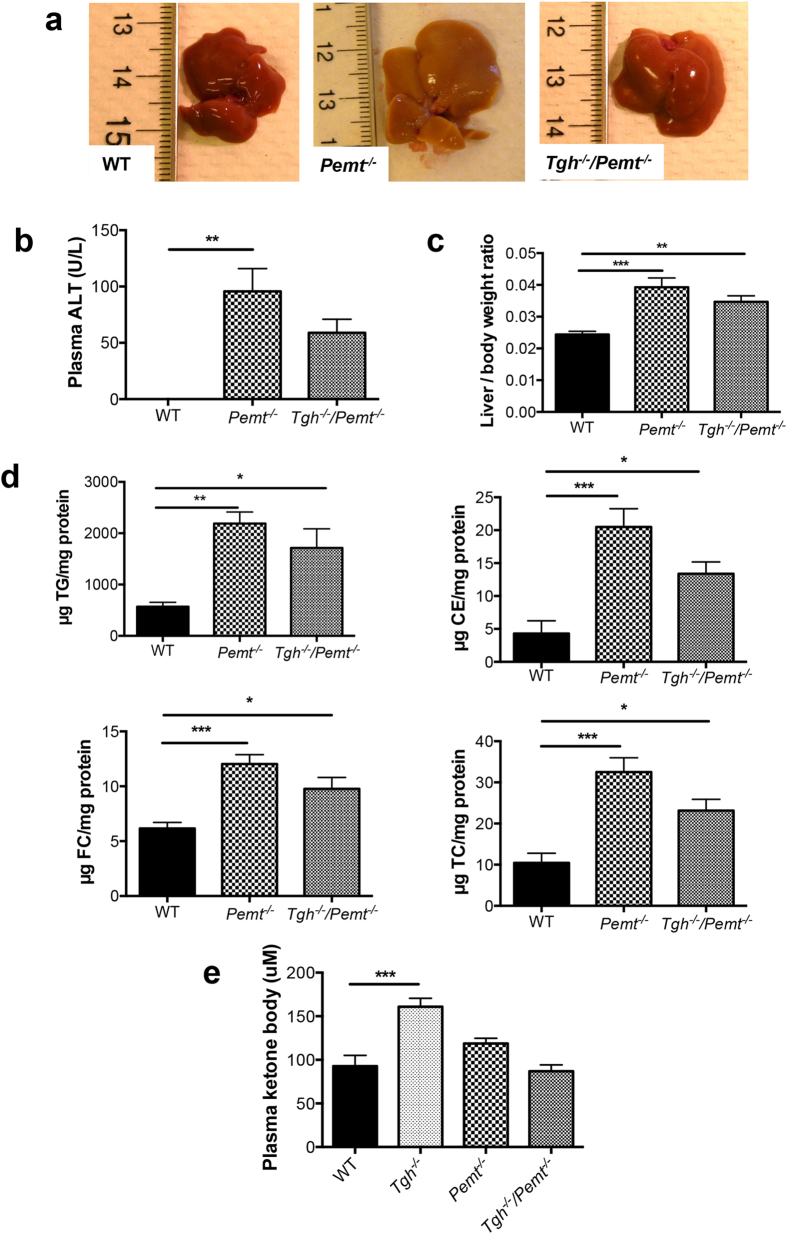
To investigate the effect of TGH deficiency on NASH development, we prolonged the HFD feeding regimen to 10 weeks to induce more advanced steatohepatitis in Pemt−/− mice23. As expected, Pemt−/− mice exhibited liver damage after 10 weeks HFD feeding, whereas the less pale liver appearance and decreased trend of plasma ALT in Tgh−/−/Pemt−/−mice suggested amelioration of the condition (Fig. 5a,b). After 10 weeks HFD feeding PEMT deficiency increased the liver to body weight ratio by 61%, elevated liver TG, cholesteryl ester (CE), free cholesterol (FC), and total cholesterol (TC) by 286%, 376%, 95%, and 211% respectively, compared with the WT group. Tgh−/−/Pemt−/−mice did not show significantly reduced liver lipids when compared with Pemt−/− mice (Fig. 5c,d). No difference in liver FFA was observed among all groups (Supplementary Fig. 5). Interestingly, increased concentration of ketone bodies observed in plasma of HFD fed Tgh−/− mice was attenuated in Tgh−/−/Pemt−/−mice (Fig. 5e). No changes in body weight were observed between Pemt−/− and Tgh−/−/Pemt−/− mice (Supplementary Fig. 6).
Figure 5. Hepatic metabolic parameters in Pemt−/− and Tgh−/−/Pemt−/− mice fed HFD for 10 weeks.
(a) Livers from WT, Pemt−/− and Tgh−/−/Pemt−/− mice. (b) Plasma ALT in WT, Pemt−/− and Tgh−/−/Pemt−/− mice. (c) Liver/ body weight ratio in WT, Pemt−/−, and Tgh−/−/Pemt−/− mice. (d) Liver TG, CE, FC, and TC mass in WT, Pemt−/−, and Tgh−/−/Pemt−/− mice. (e) Plasma ketone bodies concentrations in WT, Tgh−/−, Pemt−/− and Tgh−/−/Pemt−/− mice. n = 5, 6. Data are mean ± SEM. *P < 0.05, **P < 0.01, ***P < 0.001 vs WT control.
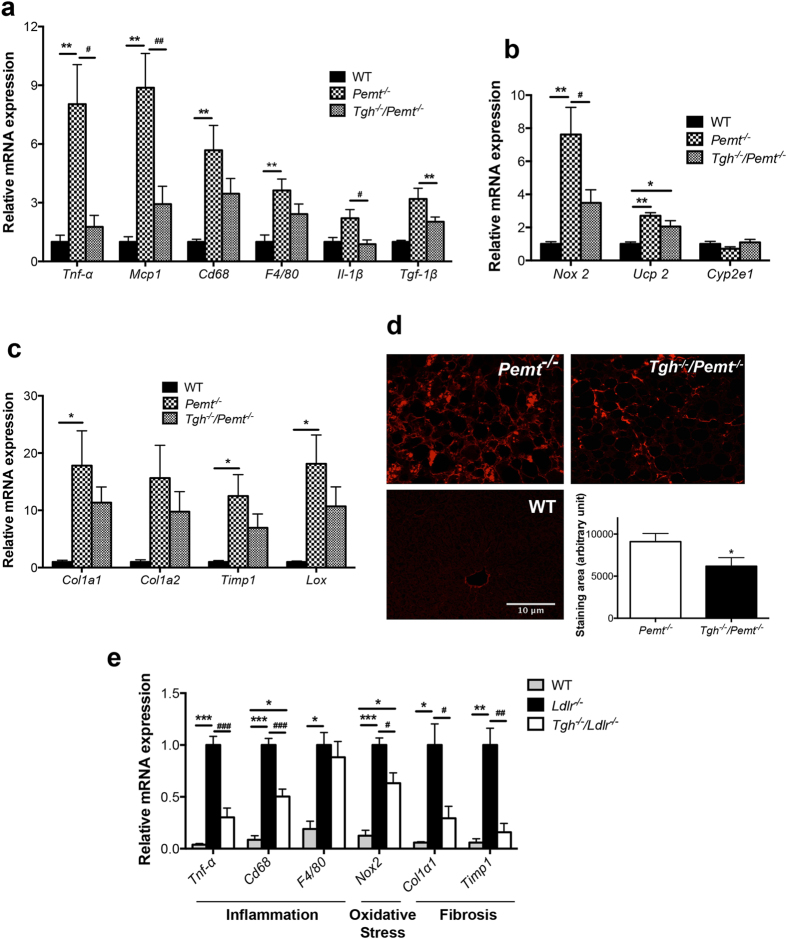
Liver inflammation is an important feature of NASH. After 10 weeks on a HFD, Pemt−/− mice exhibited elevated hepatic expression of proinflammatory cytokines, including tumor necrosis factor alpha (TNF-α), monocyte chemotactic protein-1 (MCP-1), interleukin (IL)-6, IL-1β, and transforming growth factor (TGF)-1β. Increased expression of macrophage markers cluster of differentiation 68 (CD68) and F4/80 were also observed in Pemt−/− livers (Fig. 6a). TGH deficiency significantly attenuated hepatic expression of these inflammatory markers and cytokines in Pemt−/− mice (Fig. 6a). Oxidative stress has been implicated in the progression of NASH32. Ten-week HFD feeding of Pemt−/− mice resulted in increased expression of oxidative stress markers NADPH oxidase 2 (NOX 2) and uncoupling protein-2 (UCP-2) in the liver and the expression of these markers was significantly decreased by TGH deficiency (Fig. 6b).
Figure 6. TGH deficiency ameliorates NASH features in Pemt−/− mice and Ldlr−/− mice.
(a) qPCR analysis of inflammatory genes expression in livers of WT, Pemt−/− and Tgh−/−/Pemt−/− mice after 10 weeks of HFD feeding, (b) qPCR analysis of oxidative stress genes expression in livers of WT, Pemt−/− and Tgh−/−/Pemt−/− mice, (c) qPCR analysis of fibrosis genes expression in livers of WT, Pemt−/− and Tgh−/−/Pemt−/− mice. n = 5. Data are mean ± SEM. *P < 0.05, **P < 0.01 vs WT control, #P < 0.05, ##P < 0.01 vs Pemt−/− mice. (d) Representative picrosirius red (PSR)-stained liver sections, and averaged collagen volume fraction in Pemt−/− and Tgh−/−/Pemt−/− mice. n = 5. Data are mean ± SEM. *P < 0.05, vs Pemt−/− mice. (e) qPCR analysis of representative NASH genes in livers of Ldlr−/− and Tgh−/−/Ldlr−/− after 12 weeks of WTD. n = 5. Data are mean ± SEM. *P < 0.05, **P < 0.01, ***P < 0.001 vs Ldlr−/− mice.
Because inflammatory cytokines including MCP-1, IL-1β and TGF-1β are related to hepatic stellate cell activation and fibrogenesis33,34, expression of liver fibrosis markers was also determined. High hepatic expression of fibrillar extracellular matrix (ECM) collagen type 1 (COL1A1 and COL1A2) was observed in Pemt−/− mice. Tissue inhibitor of metalloproteinase1 (TIMP1), which is capable of inactivating collagenase, and lysyl oxidase (LOX), which is a key enzyme promoting ECM intermolecular cross-linking and was implicated in liver fibrosis35, were also significantly higher in livers of Pemt−/− mice compared to control mice (Fig. 6c). In Tgh−/−/Pemt−/−mice, expression of all tested fibrosis markers showed decreased trends (Fig. 6c). Consequently, severe liver fibrosis observed in Pemt−/− mice was diminished by TGH deficiency (Fig. 6d).
TGH Deficiency Attenuates NASH Features in Ldlr−/− Mice
To investigate if the attenuation of NASH features by TGH deficiency was animal model independent, we used another NASH mouse model. Unlike the hypolipidemic Pemt−/− mice, Ldlr−/− mice develop severe hyperlipidemia and NASH after 12 weeks of WTD feeding36. Liver TG and CE mass were not different between Ldlr−/− and Tgh−/−/Ldlr−/− mice37, nor was liver FFA concentration (Supplementary Fig. 7). However, when compared to Ldlr−/− mice, Tgh−/−/Ldlr−/− mice after WTD feeding exhibited lower expression of inflammatory, oxidative stress and fibrosis markers in the liver, implying ameliorated liver pathophysiology (Fig. 6e).
TGH Deficiency Partially Restores Aberrant Phospholipid Composition in Pemt−/− Mice
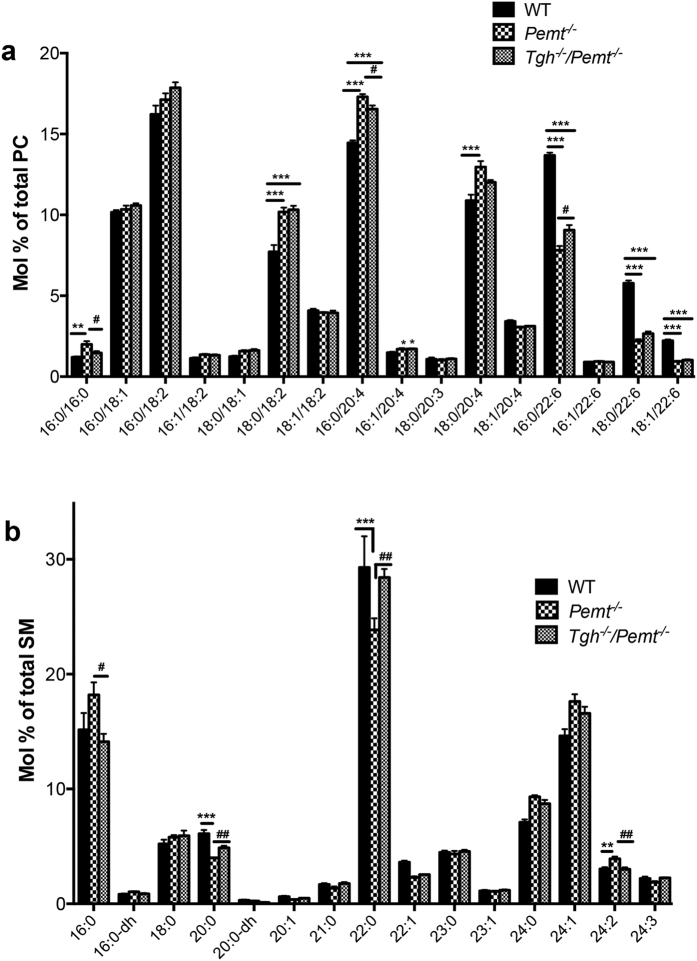
Decreased hepatic PC to PE ratio in PEMT deficient mice leads to impaired lipid bilayer integrity and consequently liver damage and inflammation20,22,24. Ten weeks of HFD feeding decreased the PC to PE ratio by 38% in Pemt−/− mice (Supplementary Fig. 8a). TGH deficiency in Pemt−/− mice increased liver PC mass (Supplementary Fig. 8b), however, no significant difference in hepatic PC to PE ratio was observed between Pemt−/− and Tgh−/−/Pemt−/− mice (Supplementary Fig. 8a), suggesting that ablation of Tgh expression provides protection against inflammation and liver damage by alternative mechanisms than by increasing PC abundance. The PEMT pathway contributes polyunsaturated fatty acid (PUFA) species to liver PC, mainly docosahexaenoic acid (DHA, 22:6n−3)19. Changes in hepatic PC-PUFA composition were observed in Pemt−/− mice after 10 weeks of HFD feeding, yielding elevated arachidonic acid (ARA, 20:4n-6) containing PC and decreased DHA containing PC. TGH deficiency in Pemt−/− mice decreased ARA and increased DHA in PC (Fig. 7a, Supplementary Fig. 9). In addition, increased dipalmitoyl-PC (C16:0/C16:0) concentration in the Pemt−/− livers was reduced by TGH deficiency (Fig. 7a). Increased sphingomyelin (SM) abundance, particularly of species containing saturated fatty acids, is associated with liver steatosis. Increased concentration of palmitoylsphingomyelin (16:0-SM) was observed in the livers of 10-week HFD fed Pemt−/− mice and was normalized to the level of the WT group in the Tgh−/−/Pemt−/− mice (Fig. 7b). Additionally, reduction of 20:0 and 22:0-SM in Pemt−/− mouse liver was reversed by TGH deficiency. No differences were observed in hepatic TG FA composition between Tgh−/− and Tgh−/−/Pemt−/− mice (Supplementary Fig. 10).
Figure 7. Partial restoration of phospholipid molecular species by TGH deficiency in Pemt−/− mice fed HFD for 10 weeks.
(a) Liver PC molecular species in WT, Pemt−/− and Tgh−/−/Pemt−/− mice. (b) Liver SM molecular species in WT, Pemt−/− and Tgh−/−/Pemt−/− mice. n = 5. Data are mean ± SEM. **P < 0.01, ***P < 0.001 vs WT control, #P < 0.05, ##P < 0.01 vs Pemt−/− mice.
TGH deficiency decreases circulating cytokines in Pemt−/− mice
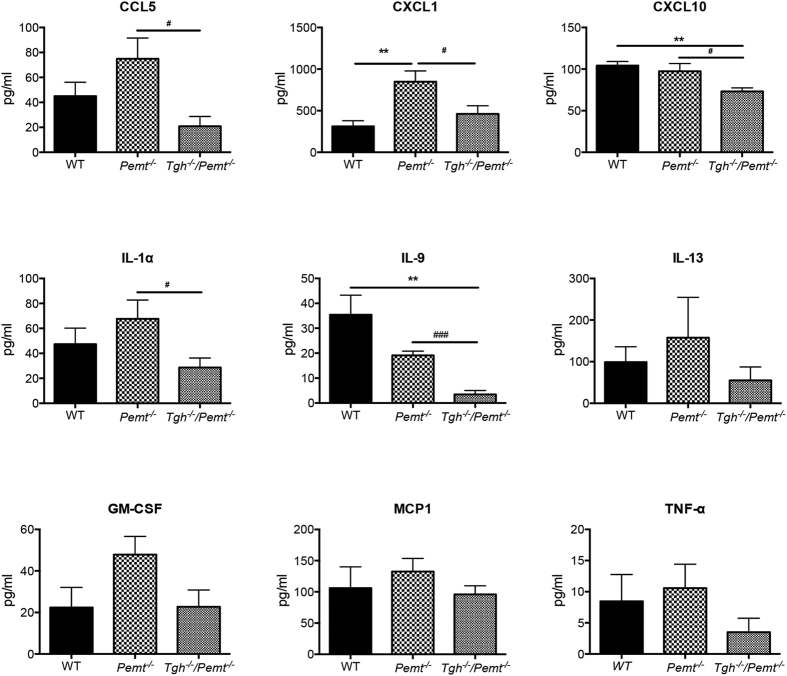
A variety of cytokines (CCL5, CXCL1, CXCL10, IL-1α, IL-9, IL-13, GM-CSF, MCP-1, and TNF-α) that promote liver inflammation and fibrosis, or are upregulated in NASH patients38,39,40,41, were measured in plasma of 10-week HFD fed WT, Pemt−/− and Tgh−/−/Pemt−/− mice. CXCL1 was significantly increased in Pemt−/− mice when compared with WT and ablating Tgh expression in Pemt−/− mice resulted in decreased concentration in this cytokine to levels comparable with WT mice (Fig. 8). Additionally, CCL5, CXCL10, IL-1α, and IL-9 concentrations were diminished in Tgh−/−/Pemt−/− mice compared with Pemt−/− mice to levels comparable with or lower than (CXCL10, IL-9) WT mice (Fig. 8). Therefore, decreased circulating cytokines may have also contributed to the attenuated NASH development in Tgh−/−/Pemt−/− mice.
Figure 8. TGH deficiency decreases plasma cytokines levels in Pemt−/− mice.
n = 5. Data are mean mean ± SEM. *P < 0.05, **P < 0.01 vs WT mice, #P < 0.05, ### < 0.001 vs Pemt−/− mice.
NASH in Pemt−/− Mice Was Not Accompanied by Aggravated Hepatic Insulin Resistance
Compared with the WT group, both Pemt−/− and Tgh−/−/Pemt−/− groups exhibited increased trend of Akt activation by phosphorylation (Supplementary Fig. 11). This result implied dissociation of hepatic insulin resistance and NASH in Pemt−/− mice, which is consistent with previous findings23.
TGH deficiency did not affect ER stress in Pemt−/− mice
ER dysfunction is related to hepatic steatosis progression and the development of NASH features such as inflammation, hepatocyte injury and oxidative stress42,43. ER stress markers and sensors have been assessed including calreticulin and BiP44, activating transcription factor (ATF) 6 and inositol-requiring enzyme (IRE) 1α45, total and spliced X-box binding protein-1 (XBP1)46 (Supplementary Fig. 12). Only total and spliced XBP1 mRNA showed increased abundance in HFD fed groups when compared with chow fed WT control but no differences in HFD-induced Xbp1 and spliced XBP1 mRNA were observed among the HFD-fed groups.
Discussion
The clinical and histological spectrum of NAFLD ranges from reversible simple steatosis to NASH, which is characterized by liver damage, inflammatory infiltrate and/or collagen deposition (fibrosis). NASH can progress to cirrhosis and hepatocellular carcinoma1,2.
NAFLD is commonly associated with severe obesity and various metabolic disorders such as insulin resistance, type 2 diabetes, dyslipidemia and cardiovascular disease. However, NAFLD can also occur in normolipidemic patients that are not obese or diabetic47. In the current study, we have interrogated the role of TGH in NAFLD progression. Chow fed TGH deficient mice are protected from hepatic lipid accumulation despite decreased VLDL secretion15. Therefore, we investigated whether TGH deficiency would be protective against HFD-induced hepatic steatosis in a diet-induced obese mouse model and found that after 16 weeks HFD feeding Tgh−/− mice had decreased liver lipid mass and steatosis severity when compared with WT mice. Patients afflicted with NAFLD present with elevated de novo lipogenesis, which contributes to hepatic lipid accumulation48. Decreased de novo lipogenesis was observed in Tgh−/− mice, as a result of decreased SREBP1c pathway. Augmented FA oxidation and improved insulin sensitivity may have additionally contributed to protection from steatosis.
To investigate whether TGH deficiency would attenuate progression to the inflammatory steatohepatitis, we used two different NASH mouse models: Pemt−/− mice fed HFD for 10 weeks and Ldlr−/− mice fed WTD for 12 weeks. TGH deficiency ameliorated NASH features including inflammation, oxidative stress and fibrosis in both of these animal models.
Pemt−/− mouse fed HFD for 10 weeks is a NASH model that is disassociated from insulin resistance and hyperlipidemia23. Unlike the significantly decreased steatosis in HFD fed Tgh−/− mice, Tgh−/−/Pemt−/− mice contained similar liver lipid levels as Pemt−/− mice. Hepatic protein expression of two key enzymes in the de novo lipogenesis, SCD-1 and fatty acid synthase (FAS), was decreased in Pemt−/− mice when compared with WT mice23 and additional reduction was not observed in Tgh−/−/Pemt−/− mice. Furthermore, hepatic insulin signaling remains normal in HFD fed Pemt−/− mice despite profound steatosis with NASH features and TGH deficiency did not further affect insulin signaling. Although TGH deficiency alone increased plasma ketone bodies concentration, Tgh−/−/Pemt−/− mice had similar plasma ketone bodies levels as Pemt−/− and WT mice.
One potential mechanism by which TGH deficiency attenuates NASH progression in Pemt−/− mice is through partial reconstitution of phospholipid molecular species in the liver. Decreased DHA-PC and increased dipalmitoyl-PC may have contributed to the decreased fluidity and dysfunction of cell membranes observed in NASH induced in Pemt−/− mice24. By normalizing the FA composition of PC, TGH deficiency restored the membrane disorder found in Pemt−/− mice and attenuated inflammation and liver damage leading to NASH.
In the absence of the PEMT pathway PE is converted to TG through phospholipase C and D pathways49 yielding increased PUFA content in TG. In this study increased hepatic PUFA in TG was also observed in Tgh−/− mice, which might have been due to decreased TG turnover of these species. However, further increment of PUFA in liver TG was not observed in Tgh−/−/Pemt−/− mice, suggestive of an alternative pathway that channels PUFA-rich metabolites derived from PE. In our previous study50, increased PC synthesis through CDP-choline pathway was observed in Tgh−/− hepatocytes, which may have normalized FA composition in liver PC in Tgh−/−/Pemt−/− mice.
Importantly, it has been shown that hepatic TGH expression is regulated by IL-6, TGF-β, and TNF-α51, thus implying the general relationship between TGH activity and inflammation. However, detailed mechanism of how TGH regulates inflammation still remains to be elucidated. Notably, the present study showed that although circulating cytokines were not comprehensively increased in Pemt−/− mice when compared with WT mice, TGH deficiency reduced circulating concentrations of several cytokines in Pemt−/− mice after 10 weeks HFD, which may have also contributed to the amelioration of NASH in the Tgh−/−/Pemt−/− mice. Because TGH is expressed in both adipose tissue and liver, tissue specific contribution of TGH to inflammation and NASH development should next be studied in tissue-specific TGH deficient mice.
Ldlr−/− mice fed WTD for 3 months develop metabolic disorders that include hyperlipidemia, obesity, insulin resistance, atherosclerosis and NASH with different etiology from Pemt−/− mice. In our previous study, the loss of TGH in Ldlr−/− mice ameliorated insulin resistance and atherosclerosis37. Because oxidized LDL plays an important role to trigger liver inflammatory response in Ldlr−/− mice25,52, decreased sustained circulating LDL levels in Tgh−/−/Ldlr−/− mice37 may have contributed to the ameliorated liver inflammation in this hyperlipidemic NASH model. We have previously demonstrated that Tgh−/−/Ldlr−/− mice had lower concentration of hepatic free cholesterol than Ldlr−/− mice after 3 months of WTD37. Free cholesterol is known to promote liver injury and NASH pathogenesis53,54,55. It has been reported that SREBP2 can activate NOX2 expression and enhance inflammation56. Decreased SREBP2 expression and pathway found in Tgh−/−/Ldlr−/− mice37 may have contributed to the attenuated NASH features. In the present study, loss of TGH was also found to reduce SREBP2 pathway in 1 week HFD fed Pemt−/− mice, a time period at which inflammation was first detected22.
In summary, roles of TGH in NAFLD progression were studied in three independent mouse models, 16-week HFD-fed obese mice, hypolipidemic and insulin sensitive PEMT deficient mice, and hyperlipidemic and insulin resistant LDLR deficient mice to represent different phases of NAFLD accompanied with different metabolic disorders. Although the pathogenesis of NAFLD in these three models is different, TGH deficiency attenuated disease progression in all the models. Therefore, pharmacological inactivation of human TGH (CES1) could potentially ameliorate fatty liver disease, and prevent progression from simple steatosis to NASH.
Materials and Methods
Mice
All animal experiments were approved by the University of Alberta Animal Care and Use Committee and were performed in accordance with the guidelines of the Canadian Council on Animal Care. Tgh−/− mice generated previously15 were backcrossed on to C57BL/6J background for 10 generations. Tgh−/− mice were bred with Pemt−/− mice to produce Tgh−/−/Pemt−/− mice. Tgh−/−/Ldlr−/−mice (C57BL/6J background) were generated previously37. All mice were maintained on a chow diet (LabDiet, PICO laboratory Rodent diet 20). At 10 weeks of age, age matched male C57BL/6J and Tgh−/− mice were fed with the high-fat diet (HFD, F3282, Bio-serv, Flemington, NJ) containing 60% calories from fat for 16 weeks. Alternatively, at 10–12 weeks of age, male C57BL/6J wild-type (WT), Tgh−/−, Pemt−/− and Tgh−/−/Pemt−/− mice were fed with a HFD for 10 weeks. At 12 weeks of age, age matched male Tgh−/−/Ldlr−/− and Ldlr−/−mice were fed with a high-fat, high-cholesterol diet (TD 88137, Harlan Teklad) containing 21% fat, 0.2% cholesterol by weight, which is usually referred to as a Western-type diet (WTD), for 12 weeks. Tail vein blood and tissues were collected from overnight fasted mice.
Lipid and Lipidomic Analysis
Liver and plasma lipid mass was determined by either high-performance liquid chromatography (HPLC) or a kit assay (Roche Diagnostics GmbH, Mannheim, Germany), lipidomic analyses were carried out on the Acquity Ultra Performance LC and a Xevo TQ MS (Waters, Milford, MA, US) as described in the Supplementary Methods.
Metabolic Labeling Studies
Primary hepatocytes prepared from mice were incubated overnight with serum-free DMEM. To assess hepatic de novo lipogenesis, hepatocytes were incubated for 4 hours in DMEM containing 10 μCi [3H]acetic acid and 250 μM non-radiolabeled acetic acid. Cells were harvested, lipids were extracted, resolved by thin layer chromatography (TLC), and radioactivity in various lipid classes was determined.
RNA Isolation and Real Time qPCR Analysis
Liver RNA extraction and real time qPCR were performed using the specific primers (Supplementary Table 2) as described in the Supplementary Methods.
Plasma Cytokine and Chemokine Assay
Mouse plasma cytokine and chemokine levels were determined using the Multiplexing LASER Bead Assay (Eve Technologies, Calgary, AB, CA).
In vivo Insulin Signaling
Animals were fasted for 12 hours then 1 unit/kg body weight of human insulin or phosphate-buffered saline (PBS) was injected intraperitoneally. Fifteen minutes after injection, livers were collected. Phospho-Akt and total Akt levels in the livers were detected by immunoblotting.
In vivo VLDL-TG Secretion
Mice were fasted overnight then injected intraperitoneally with Poloxamer 407 (1 g/kg body weight). Blood was collected before and after 1, 2, and 3 hours of injection. TG content was determined by a kit assay (Roche Diagnostics GmbH, Mannheim, Germany).
Statistical Analysis
Data are presented as the mean ± SEM. Analysis was performed using the GraphPad PRISM® 5 software. Statistical analysis was performed by unpaired two-tailed t test and one-way ANOVA followed by Bonferroni post-test. Data from studies in WT and Tgh−/− mice on both chow and HFD were analyzed by two-way ANOVA followed by Bonferroni post-test. In vivo VLDL-TG secretion test was analyzed by two-way ANOVA followed by Bonferroni post-tests. P < 0.05 was interpreted as significantly different.
Additional Information
How to cite this article: Lian, J. et al. Ces3/TGH deficiency attenuates steatohepatitis. Sci. Rep. 6, 25747; doi: 10.1038/srep25747 (2016).
Supplementary Material
Acknowledgments
LC/MS, HPLC and GC analysis of lipids was performed at the Faculty of Medicine and Dentistry Lipid Analysis Core that receives funding from the Women and Children Health Research Institute. We thank Dr. Dennis Vance for Pemt−/− mice. This research was funded by a grant from the Canadian Institutes of Health Research MOP-69043 (R.L.), Alberta Diabetes Institute Pilot grant (R.L.) and MOP-15291 (M.M.). M.H. was a fellow of the Sigrid Jusélius Foundation. J.L. was a recipient of AIHS postdoctoral fellowship. R.L. is an AIHS Scientist.
Footnotes
The authors declare no competing financial interests.
Author Contributions J.L. and E.W. performed the majority of in vivo experiments, lipid and gene expression analysis and immunoblotting. J.G. performed ER stress experiments. S.K.D. performed fibrosis analysis. M.H. performed LC/MS analysis. L.L. generated Tgh−/−/Pemt−/− and Tgh−/−/Ldlr−/− mice and assisted in experiments. R.W. performed lipid analysis and immunoblotting. A.T. performed liver pathology and analyzed the data. G.Y.O. analyzed fibrosis data and reviewed the manuscript. M.M. designed and interpreted ER stress experiments. J.L. and R.L. developed the hypothesis, designed the experiments and analyzed, discussed, and interpreted the data and wrote the manuscript. R.L. coordinated and directed the project.
References
- Cohen J. C., Horton J. D. & Hobbs H. H. Human fatty liver disease: old questions and new insights. Science 332, 1519–1523 (2011). [DOI] [PMC free article] [PubMed] [Google Scholar]
- Tiniakos D. G., Vos M. B. & Brunt E. M. Nonalcoholic fatty liver disease: pathology and pathogenesis. Annu Rev Pathol 5, 145–171 (2010). [DOI] [PubMed] [Google Scholar]
- Lehner R. & Verger R. Purification and characterization of a porcine liver microsomal triacylglycerol hydrolase. Biochemistry 36, 1861–1868 (1997). [DOI] [PubMed] [Google Scholar]
- Lehner R. & Vance D. E. Cloning and expression of a cDNA encoding a hepatic microsomal lipase that mobilizes stored triacylglycerol. Biochem J 343 Pt 1, 1–10 (1999). [PMC free article] [PubMed] [Google Scholar]
- Dolinsky V. W., Sipione S., Lehner R. & Vance D. E. The cloning and expression of a murine triacylglycerol hydrolase cDNA and the structure of its corresponding gene. Biochim Biophys Acta 1532, 162–172 (2001). [DOI] [PubMed] [Google Scholar]
- Quiroga A. D. et al. Deficiency of carboxylesterase 1/esterase-x results in obesity, hepatic steatosis, and hyperlipidemia. Hepatology 56, 2188–2198 (2012). [DOI] [PubMed] [Google Scholar]
- Xu J. et al. Hepatic carboxylesterase 1 is essential for both normal and farnesoid X receptor-controlled lipid homeostasis. Hepatology 59, 1761–1771 (2014). [DOI] [PMC free article] [PubMed] [Google Scholar]
- Holmes R. S. et al. Recommended nomenclature for five mammalian carboxylesterase gene families: human, mouse, and rat genes and proteins. Mamm Genome 21, 427–441 (2010). [DOI] [PMC free article] [PubMed] [Google Scholar]
- Xu J. et al. Carboxylesterase 1 Is Regulated by Hepatocyte Nuclear Factor 4alpha and Protects Against Alcohol- and MCD diet-induced Liver Injury. Sci Rep 6, 24277 (2016). [DOI] [PMC free article] [PubMed] [Google Scholar]
- Xu J., et al. Hepatic carboxylesterase 1 is induced by glucose and regulates postprandial glucose levels. PLoS One 9, e109663 (2014). [DOI] [PMC free article] [PubMed] [Google Scholar]
- Wei E. et al. Loss of TGH/Ces3 in mice decreases blood lipids, improves glucose tolerance, and increases energy expenditure. Cell Metab 11, 183–193 (2010). [DOI] [PubMed] [Google Scholar]
- Wei E., Gao W. & Lehner R. Attenuation of adipocyte triacylglycerol hydrolase activity decreases basal fatty acid efflux. J Biol Chem 282, 8027–8035 (2007). [DOI] [PubMed] [Google Scholar]
- Dominguez E. et al. Integrated phenotypic and activity-based profiling links Ces3 to obesity and diabetes. Nat Chem Biol 10, 113–121 (2014). [DOI] [PMC free article] [PubMed] [Google Scholar]
- Gilham D. et al. Inhibitors of hepatic microsomal triacylglycerol hydrolase decrease very low density lipoprotein secretion. FASEB J 17, 1685–1687 (2003). [DOI] [PubMed] [Google Scholar]
- Wei E. et al. Loss of TGH/Ces3 in mice decreases blood lipids, improves glucose tolerance, and increases energy expenditure. Cell Metab 11, 183–193 (2010). [DOI] [PubMed] [Google Scholar]
- Raabe M. et al. Analysis of the role of microsomal triglyceride transfer protein in the liver of tissue-specific knockout mice. J Clin Invest 103, 1287–1298 (1999). [DOI] [PMC free article] [PubMed] [Google Scholar]
- Lian J. et al. Liver specific inactivation of carboxylesterase 3/triacylglycerol hydrolase decreases blood lipids without causing severe steatosis in mice. Hepatology 56, 2154–2162 (2012). [DOI] [PubMed] [Google Scholar]
- Ashla A. A. et al. Genetic analysis of expression profile involved in retinoid metabolism in non-alcoholic fatty liver disease. Hepatol Res 40, 594–604 (2010). [DOI] [PubMed] [Google Scholar]
- DeLong C. J., Shen Y. J., Thomas M. J. & Cui Z. Molecular distinction of phosphatidylcholine synthesis between the CDP-choline pathway and phosphatidylethanolamine methylation pathway. J Biol Chem 274, 29683–29688 (1999). [DOI] [PubMed] [Google Scholar]
- Vance D. E. Phospholipid methylation in mammals: from biochemistry to physiological function. Biochim Biophys Acta 1838, 1477–1487 (2014). [DOI] [PubMed] [Google Scholar]
- Song J. et al. Polymorphism of the PEMT gene and susceptibility to nonalcoholic fatty liver disease (NAFLD). FASEB J 19, 1266–1271 (2005). [DOI] [PMC free article] [PubMed] [Google Scholar]
- Ling J., Chaba T., Zhu L. F., Jacobs R. L. & Vance D. E. Hepatic ratio of phosphatidylcholine to phosphatidylethanolamine predicts survival after partial hepatectomy in mice. Hepatology 55, 1094–1102 (2012). [DOI] [PubMed] [Google Scholar]
- Jacobs R. L. et al. Impaired de novo choline synthesis explains why phosphatidylethanolamine N-methyltransferase-deficient mice are protected from diet-induced obesity. J Biol Chem 285, 22403–22413 (2010). [DOI] [PMC free article] [PubMed] [Google Scholar]
- Li Z. et al. The ratio of phosphatidylcholine to phosphatidylethanolamine influences membrane integrity and steatohepatitis. Cell Metab 3, 321–331 (2006). [DOI] [PubMed] [Google Scholar]
- Bieghs V. et al. LDL receptor knock-out mice are a physiological model particularly vulnerable to study the onset of inflammation in non-alcoholic fatty liver disease. PloS One 7, e30668 (2012). [DOI] [PMC free article] [PubMed] [Google Scholar]
- Depner C. M. et al. A Metabolomic Analysis of Omega-3 Fatty Acid-Mediated Attenuation of Western Diet-Induced Nonalcoholic Steatohepatitis in LDLR (−/−) Mice. PloS One 8, e83756 (2013). [DOI] [PMC free article] [PubMed] [Google Scholar]
- Zhou L. et al. Cidea promotes hepatic steatosis by sensing dietary fatty acids. Hepatology 56, 95–107 (2012). [DOI] [PubMed] [Google Scholar]
- Villanueva C. J. et al. Specific role for acyl CoA:Diacylglycerol acyltransferase 1 (Dgat1) in hepatic steatosis due to exogenous fatty acids. Hepatology 50, 434–442 (2009). [DOI] [PMC free article] [PubMed] [Google Scholar]
- Postic C. & Girard J. The role of the lipogenic pathway in the development of hepatic steatosis. DiabetesMetab 34, 643–648 (2008). [DOI] [PubMed] [Google Scholar]
- Neschen S. et al. Prevention of hepatic steatosis and hepatic insulin resistance in mitochondrial acyl-CoA:glycerol-sn-3-phosphate acyltransferase 1 knockout mice. Cell Metab 2, 55–65 (2005). [DOI] [PubMed] [Google Scholar]
- Perry R. J., Samuel V. T., Petersen K. F. & Shulman G. I. The role of hepatic lipids in hepatic insulin resistance and type 2 diabetes. Nature 510, 84–91 (2014). [DOI] [PMC free article] [PubMed] [Google Scholar]
- Koek G. H., Liedorp P. R. & Bast A. The role of oxidative stress in non-alcoholic steatohepatitis. Clin Chim Acta 412, 1297–1305 (2011). [DOI] [PubMed] [Google Scholar]
- Bataller R. & Brenner D. A. Liver fibrosis. J Clin Invest 115, 209–218 (2005). [DOI] [PMC free article] [PubMed] [Google Scholar]
- Dowman J. K., Tomlinson J. W. & Newsome P. N. Pathogenesis of non-alcoholic fatty liver disease. Q J Med 103, 71–83 (2010). [DOI] [PMC free article] [PubMed] [Google Scholar]
- Kagan H. M. Lysyl oxidase: mechanism, regulation and relationship to liver fibrosis. Pathol Research Pract 190, 910–919 (1994). [DOI] [PubMed] [Google Scholar]
- Depner C. M., Philbrick K. A. & Jump D. B. Docosahexaenoic acid attenuates hepatic inflammation, oxidative stress, and fibrosis without decreasing hepatosteatosis in a Ldlr(−/−) mouse model of western diet-induced nonalcoholic steatohepatitis. J Nutr 143, 315–323 (2013). [DOI] [PMC free article] [PubMed] [Google Scholar]
- Lian J., Quiroga A. D., Li L. & Lehner R. Ces3/TGH deficiency improves dyslipidemia and reduces atherosclerosis in Ldlr(−/−) mice. Circ Res 111, 982–990 (2012). [DOI] [PubMed] [Google Scholar]
- Berres M. L. et al. Antagonism of the chemokine Ccl5 ameliorates experimental liver fibrosis in mice. J Clin Invest 120, 4129–4140 (2010). [DOI] [PMC free article] [PubMed] [Google Scholar]
- Kamari Y. et al. Lack of interleukin-1alpha or interleukin-1beta inhibits transformation of steatosis to steatohepatitis and liver fibrosis in hypercholesterolemic mice. J Hepatol 55, 1086–1094 (2011). [DOI] [PMC free article] [PubMed] [Google Scholar]
- Wynn T. A. IL-13 effector functions. Annu Rev Immunol 21, 425–456 (2003). [DOI] [PubMed] [Google Scholar]
- Marra F. & Tacke F. Roles for chemokines in liver disease. Gastroenterology 147, 577–594 e571 (2014). [DOI] [PubMed] [Google Scholar]
- Rinella M. E. et al. Dysregulation of the unfolded protein response in db/db mice with diet-induced steatohepatitis. Hepatology 54, 1600–1609 (2011). [DOI] [PMC free article] [PubMed] [Google Scholar]
- Pagliassotti M. J. Endoplasmic reticulum stress in nonalcoholic fatty liver disease. Annu Review Nutr 32, 17–33 (2012). [DOI] [PubMed] [Google Scholar]
- Coe H. & Michalak M. Calcium binding chaperones of the endoplasmic reticulum. Gen Physiol Biophys 28 Spec No Focus, F96–F103 (2009). [PubMed] [Google Scholar]
- Hetz C., Martinon F., Rodriguez D. & Glimcher L. H. The unfolded protein response: integrating stress signals through the stress sensor IRE1alpha. Physiol Rev 91, 1219–1243 (2011). [DOI] [PubMed] [Google Scholar]
- Yoshida H., Matsui T., Yamamoto A., Okada T. & Mori K. XBP1 mRNA is induced by ATF6 and spliced by IRE1 in response to ER stress to produce a highly active transcription factor. Cell 107, 881–891 (2001). [DOI] [PubMed] [Google Scholar]
- Marchesini G. et al. Nonalcoholic fatty liver, steatohepatitis, and the metabolic syndrome. Hepatology 37, 917–923 (2003). [DOI] [PubMed] [Google Scholar]
- Donnelly K. L. et al. Sources of fatty acids stored in liver and secreted via lipoproteins in patients with nonalcoholic fatty liver disease. J Clin Invest 115, 1343–1351 (2005). [DOI] [PMC free article] [PubMed] [Google Scholar]
- Watkins S. M., Zhu X. & Zeisel S. H. Phosphatidylethanolamine-N-methyltransferase activity and dietary choline regulate liver-plasma lipid flux and essential fatty acid metabolism in mice. Journal Nutr 133, 3386–3391 (2003). [DOI] [PubMed] [Google Scholar]
- Wang H. et al. Altered lipid droplet dynamics in hepatocytes lacking triacylglycerol hydrolase expression. Mol Biol Cell 21, 1991–2000 (2010). [DOI] [PMC free article] [PubMed] [Google Scholar]
- Matsubara T. et al. Metabolomics identifies an inflammatory cascade involved in dioxin- and diet-induced steatohepatitis. Cell Metab 16, 634–644 (2012). [DOI] [PMC free article] [PubMed] [Google Scholar]
- Wouters K. et al. Dietary cholesterol, rather than liver steatosis, leads to hepatic inflammation in hyperlipidemic mouse models of nonalcoholic steatohepatitis. Hepatology 48, 474–486 (2008). [DOI] [PubMed] [Google Scholar]
- Puri P. et al. A lipidomic analysis of nonalcoholic fatty liver disease. Hepatology 46, 1081–1090 (2007). [DOI] [PubMed] [Google Scholar]
- Caballero F. et al. Enhanced free cholesterol, SREBP-2 and StAR expression in human NASH. J Hepatol 50, 789–796 (2009). [DOI] [PubMed] [Google Scholar]
- Mari M. et al. Mitochondrial free cholesterol loading sensitizes to TNF- and Fas-mediated steatohepatitis. Cell Metab 4, 185–198 (2006). [DOI] [PubMed] [Google Scholar]
- Xiao H. et al. Sterol regulatory element binding protein 2 activation of NLRP3 inflammasome in endothelium mediates hemodynamic-induced atherosclerosis susceptibility. Circulation 128, 632–642 (2013). [DOI] [PMC free article] [PubMed] [Google Scholar]
Associated Data
This section collects any data citations, data availability statements, or supplementary materials included in this article.


