

Abstract
Background and Purpose
We aimed to develop a mechanistic mixed‐effects pharmacokinetic (PK)–pharmacodynamic (PD) (PKPD) model for recombinant human growth hormone (rhGH) in hypophysectomized rats and to predict the human PKPD relationship.
Experimental Approach
A non‐linear mixed‐effects model was developed from experimental PKPD studies of rhGH and effects of long‐term treatment as measured by insulin‐like growth factor 1 (IGF‐1) and bodyweight gain in rats. Modelled parameter values were scaled to human values using the allometric approach with fixed exponents for PKs and unscaled for PDs and validated through simulations relative to patient data.
Key Results
The final model described rhGH PK as a two compartmental model with parallel linear and non‐linear elimination terms, parallel first‐order absorption with a total s.c. bioavailability of 87% in rats. Induction of IGF‐1 was described by an indirect response model with stimulation of kin and related to rhGH exposure through an Emax relationship. Increase in bodyweight was directly linked to individual concentrations of IGF‐1 by a linear relation. The scaled model provided robust predictions of human systemic PK of rhGH, but exposure following s.c. administration was over predicted. After correction of the human s.c. absorption model, the induction model for IGF‐1 well described the human PKPD data.
Conclusions
A translational mechanistic PKPD model for rhGH was successfully developed from experimental rat data. The model links a clinically relevant biomarker, IGF‐1, to a primary clinical end‐point, growth/bodyweight gain. Scaling of the model parameters provided robust predictions of the human PKPD in growth hormone‐deficient patients including variability.
Abbreviations
- COV
coefficient of variation
- FOCE‐I
first‐order conditional estimation with interaction
- GH
growth hormone
- IGF‐1
insulin‐like growth factor 1
- IIV
inter‐individual variability
- LOCI
luminescence oxygen channelling immunoassay
- LOQ
limit of quantification
- OFV
objective function value
- pcVPC
prediction‐corrected visual predictive check
- PD
pharmacodynamic
- PK
pharmacokinetic
- PKPD
pharmacokinetic–pharmacodynamic
- rhGH
recombinant human growth hormone
- RSE
relative standard error
- RUV
residual unexplained variability
- SHR
shrinkage
Tables of Links
| TARGETS |
|---|
| Catalytic receptors |
| GH receptor |
These Tables list key protein targets and ligands in this article which are hyperlinked to corresponding entries in http://www.guidetopharmacology.org, the common portal for data from the IUPHAR/BPS Guide to PHARMACOLOGY (Pawson et al., 2014) and are permanently archived in the Concise Guide to PHARMACOLOGY 2015/16 (Alexander et al., 2015).
Introduction
Growth hormone (GH), a 191‐amino acid protein weighing approximately 22 kDa, is synthesized and secreted from the somatotroph cells of the anterior pituitary gland. GH is an important endogenous regulator of growth and development during childhood, an effect that is primarily mediated through insulin‐like growth factor 1 (IGF‐1) (Krysiak et al., 2007; Laron, 2011). GH also plays an important role in regulation of carbohydrate, lipid and protein metabolism (Jorgensen et al., 1989).
The hypophysectomized rat, an animal disease model within endocrinology, is used during pre‐clinical development of GH analogues to evaluate their pharmacokinetic (PK) and pharmacodynamic (PD) (PKPD) properties. The animal model resembles the GH deficiency state in humans with lack of GH secretion, low serum IGF‐1 and growth retardation (measured by bodyweight) (Wei et al., 2012).
Non‐linear mixed‐effects modelling of the PKPD relationship of drugs in early pre‐clinical development stage may improve the mechanistic understanding of their actions and form a strong basis for meaningful and accurate predictions of the human PKPD to support dose selection for clinical development. Furthermore, modelling of pre‐clinical data could aid in validation and understanding of animal models and guide evaluation and selection of new compounds to reduce attrition rate and costs (Gibbs, 2010). Mixed‐effects modelling describes both mean parameter values (the ‘population’ value) and inter‐individual variability (IIV) in parameters. As a sampling matrix is often utilized in pre‐clinical studies due to low blood volumes, this approach has the further advantage that a few samples from individual animals will supplement each other in the analysis.
Extrapolation of PK parameters from the pre‐clinical studies is commonly performed by the allometric approach, which is based on the assumption that anatomical and physiological similarities between species scales with bodyweight (Boxenbaum, 1982). The allometric approach has been widely applied to predict the PK of small non‐peptide/protein molecules, and usually, exponents of 0.75, 1.0 and −0.25 are used for clearance processes, volume terms and first‐order rate constants (Mager et al., 2009). The predictive value of the allometric approach has been shown for some proteins, albeit with slightly lower exponents, ranging between 0.6–0.8 for clearance processes and 0.8–1.0 for volume terms (Mordenti et al., 1991).
The larger MW of many proteins may result in different clearance and disposition mechanisms, which can result in non‐linearity. Presence of endogenous proteins might also affect disposition of exogenous proteins, and if the protein and associated receptors are not relatively well‐conserved between species, allometric scaling might not have predictive value (Mordenti et al., 1991; Woo and Jusko, 2007). While relative certainty is assumed with allometric scaling of PK parameters, it is more uncertain which principles to apply when scaling PD parameters such as Emax and EC50. The drug in question and its target could be examined in vitro to establish binding differences between species. However, if the species homology of the targeted system is high, it would be reasonable to assume that PD parameters are (essentially) species‐independent. Scaling of PD could then be based on parameters obtained from modelling of pre‐clinical data (Mager and Jusko, 2008; Mager et al., 2009).
In this study, we set out (i) to describe the PKPD relationship of rhGH in the hypophysectomized rat using non‐linear mixed‐effects modelling and (ii) to predict the clinical PKPD relationship in patients based on scaled parameters from our rat model.
Methods
Data
The mixed‐effects PKPD model was based on data from two types of studies in hypophysectomized rats. The first study type explored the PKPD relationship of a single rhGH dose and IGF‐1 response, whereas the second study type explored the pharmacodynamic effects of daily rhGH doses by steady state IGF‐1 and bodyweight increase.
Animals
All animal care and study protocols were conducted in accordance with the Protection of Animals Act, the Act on Experiments on Animals and the Novo Nordisk Standard Operating Procedures for Experiments on Animals at Novo Nordisk A/S. Animal studies are reported in compliance with the ARRIVE guidelines (Kilkenny et al., 2010; McGrath & Lilley, 2015).
Two hundred thirty male hypophysectomized Sprague Dawley rats weighing approximately 100 g were obtained from Taconic M&B (Ejby, Denmark). The rats were hypophysectomized at age 4 weeks, arrived at Novo Nordisk A/S at age 6 weeks and were acclimatized for 1–2 weeks before study initiation. Rats were housed in Macrolon type‐IV cages with five animals in each cage and had free access to food (Altromin 1324) and drink (tap water). Housing facilities had a temperature between 18–24°C, a relative humidity between 30–70%, air change between 8–15 times per hour and followed a 12 h light/dark cycle. The rats were weighed and examined before inclusion in studies to confirm adequate hypophysectomy.
Experiments
The PKPD study used a sparse sampling matrix in which three rats were sampled per time‐point. As objective assays were available for both drug and biomarker, no blinding was included in the study. Rats were randomly assigned to one of six dose groups and dosed with rhGH i.v. through the tail vein or s.c. into the scruff of the neck. The GH was prepared as follows: lyophilized rhGH (an internal standard, Novo Nordisk A/S) was diluted in a vehicle consisting of 20 mg·mL−1 glycine, 2 mg·mL−1 mannitol and 2.4 mg·mL−1 NaHCO3 with pH adjusted to 8.2. Test solutions were stored at 2–8°C when not in use. A total of six blood samples (50–170 μL) per rat were taken through the tail vein using a 23G needle, transferred to EDTA‐coated tubes and centrifuged at 4000 rpm at 4°C, for 5 min. Plasma samples were split for rhGH (20 μL) and IGF‐1 (50 μL) determination and stored on dry ice before freezing at −20°C. In the PD studies, rats were given daily s.c. injections in the neck of either rhGH or vehicle (for controls). The rats were weighed daily in the morning (between 08:00 and 10:00 hours) before dosing, and blood samples (200 μL) were taken and handled as discussed earlier for IGF‐1 determination. To investigate the effects of treatment on body composition (body fat, lean body mass and free body water), all animals were scanned in a quantitative magnetic resonance scanner pre‐study and at the end of study. At the end of all studies, animals were killed by asphyxiation with CO2. No formal samples size calculations were carried out due to the descriptive aim of the model. But to maximize the likelihood of obtaining an accurate population PKPD model, historical data from the Novo Nordisk database was also included in this study. Table 1 presents an overview of studies included in the PKPD analysis.
Table 1.
Studies of rhGH in hypophysectomized rats included in the mixed‐effects PKPD model
| Type | Year | rhGH doses (μg) a | Route | n group | Sampling scheme (h) | Doses |
|---|---|---|---|---|---|---|
| PKPD | 2013 |
1106, 3319 44, 221, 1106, 3319 |
i.v. s.c. |
12 12b |
Pre, 0.08, 0.17, 0.33, 0.5, 0.67, 0.83, 1, 1.25, 1.5, 2, 2.5, 3, 4, 5, 6, 7, 8, 10, 12, 24, 28, 32 and 48 c | 1 |
| PD | 2011 | Vehicle, 44 | s.c. | 10 | Pre, 24, 72, 120, 168, 240, 336, 408, 504, 576 and 672 | 28 |
| PD | 2006 | Vehicle, 44 | s.c. | 10 | Pre, 24, 72, 120, 168, 240, 336, 408, 504, 576 and 672 | 28 |
| PD | 2006 | Vehicle, 221, 1106, 3319 | s.c. | 10 | Pre, 24, 72, 120 and 168 | 6 |
| PD | 2008 | Vehicle, 22, 221, 2213 | s.c. | 10 | Pre, 24, 72, 120 and 168 | 7 |
| PD | 2008 | Vehicle, 11, 111, 1106 | s.c. | 10 | Pre, 24, 72, 120 and 168 | 7 |
rhGH, recombinant human growth hormone; PKPD, pharmacokinetic–pharmacodynamic.
PKPD study: dosed per 100 g – PD studies: absolute doses throughout the study periods, not dependent on bodyweight.
n is 10 for 44 μg dosing group.
Last rhGH sample at 12 h – IGF‐1 sampled at time points marked with bold.
Assays
Plasma concentrations of rhGH were determined by an automated luminescence oxygen channeling immunoassay (LOCI), a homogenous bead‐based assay. LOCI reagents include two latex bead reagents and biotinylated GH‐binding protein (one generic reagent coated with streptavidin containing photosensitive dye acting as donor beads and one reagent coated with an antibody acting as acceptor beads) (Ullman et al., 1996). Lower and upper limits of quantification (LOQs) for the assay were 0.9 and 2213 μg L−1 respectively.
Plasma concentrations of IGF‐1 were determined by two commercial elisas (Immunodiagnostic Systems Ltd., Boldon, UK) with different specificity. The assays are similar sandwich elisa assays using a highly IGF‐1 specific polyclonal antibody as catcher and a horseradish peroxidase‐labelled high‐affinity monoclonal antibody as detector (Krebs et al., 2008). The lower and upper LOQs were 63 and 4240 ng mL−1 for OCTEIA IGF‐1 and 4 and 100 ng mL−1 for the high‐specific IGF‐1 assay.
Software
Nonlinear mixed‐effects modelling software nonmem® 7.3 (ICON Development Solutions, Hanover, MD, USA) interfaced with Perl‐speaks‐NONMEM (Lindbom et al., 2004) and Pirana (Keizer et al., 2011) was used for PKPD modelling. R (Team, 2013) with packages xpose4 (Jonsson and Karlsson, 1999) and ggplot2 (Wickham, 2009) was used for data manipulation and analysis of nonmem® output.
Data exclusion
Samples reported as below LOQ amounted to 4.6% of all rhGH samples, and it was decided that no method to deal with left censoring would be implemented. For IGF‐1 samples, 24.8% of all measurements were reported as below LOQ, a majority of which were pre‐dose and vehicle group measurements (6.7% and 13.5% of the 24.8%, respectively) in the PD studies performed in 2006 and 2008. A highly specific IGF‐1 assay was available for the studies performed since then, which enabled determination of pre‐dose and control group samples, and it was assumed that reported pre‐dose and vehicle‐group IGF‐1 measurements (168 in total) would describe baseline levels and vehicle effects adequately. No bodyweight measurements were missing.
The four week PD studies showed antibody formation against rhGH in varying concentrations in all treated animals at the end of the study. This was thought to influence IGF‐1, and thus bodyweight gain and PD measurements beyond the first week of dosing (past 168 h) were excluded.
Data analysis
The PKPD analysis of rhGH in hypophysectomized rats was performed with nonmem® using the first‐order conditional estimation method with interaction (FOCE‐I) on untransformed data. Model development was carried out with a step‐wise approach with PK parameters fixed during PD model development but with PK data kept in the data set. The final model was run as a simultaneous fit of PK and PD. Model evaluation was based on the objective function value (OFV), relative standard error (RSE), goodness of fit plots and (prediction‐corrected) visual predictive checks (pcVPC/VPC) (Bergstrand et al., 2011). The OFV reported by nonmem® is proportional to minus two times the log‐likelihood of the data, and statistical improvement of fit was assessed by likelihood ratio testing. A reduction in OFV greater than 3.84 (P ≤ 0.05) was required for inclusion of a structural parameter or a variance term, whereas a reduction in OFV greater than 10.81 (P ≤ 0.001) following backwards deletion was required for covariate inclusion.
Covariates are variables linked to the individual (such as bodyweight) or the drug (such as concentration of the solution injected) that can potentially have predictive value. Continuous covariates can be implemented in the model, usually with centring on the mean value as for bodyweight
| (1) |
where θi is the parameter in the individual, θμ is the parameter population value, COV i is the covariate in the individual, COV mean is a centring value in the covariate range and θCOV is an estimated or fixed value describing the parameter–covariate relationship. Covariates available for testing were animal bodyweight and the concentration and volume of the drug solution injected.
IIV was assumed to be described exponentially by:
| (2) |
where θμ is the population parameter mean, η i is the deviation from the mean for the ith subject and θi is the parameter value in the ith individual. The residual error, ε, was evaluated throughout using additive, proportional or combined error models to describe residual unexplained variability (RUV), and it was assumed that both η i and ε followed a normal distribution with mean zero and variance σ 2.
In total, the PKPD analysis was based on 304 samples of rhGH, 717 samples of IGF‐1 and 1248 bodyweight measurements. The data and statistical analysis comply with the recommendations on experimental design and analysis in pharmacology (Curtis et al., 2015)
PK model for rhGH
Two and three compartmental models with linear, non‐linear or combined elimination were evaluated for i.v. data. As GH is partly eliminated through the kidneys via glomerular filtration (linear process), and partly through receptor‐mediated endocytosis (non‐linear process), a mixed‐type elimination model could prove relevant (Maack et al., 1979; Husman et al., 1988). For s.c. administration, different absorption models were evaluated, including first order, zero order, sequential first and zero order and parallel first order tested with Erlang‐type transit compartments or absorption lag (Rousseau et al., 2004).
Vehicle response
To separate drug effect from a potentially underlying change in PD markers, the IGF‐1 and bodyweight data from control groups were analysed to explore changes over time. This was done using a baseline level while testing multiple models, including a linear slope and a polynomial.
PD model for IGF‐1
Administration of GH to hypophysectomized animals have shown that IGF‐1 expression in the liver is under direct control of GH, given that the amount of IGF‐1 mRNA available can be increased many‐fold after GH administration (Mathews et al., 1986; Roberts et al., 1986). A biological turn‐over process can be described mechanistically by an indirect response model, which describes drug action through stimulation or inhibition of a pharmacological mechanism (Dayneka et al., 1993). When no drug is present, the rate of change in response, R, can be described by
| (3) |
where k in is a zero‐order rate constant that describes production of response and k out is a first‐order rate constant that describes loss of response. The baseline level, R 0, when no drug is present is given by
| (4) |
An indirect response model, which assumes that GH drives IGF‐1 production through stimulation of k in could be described as follows (with an Emax relationship to concentration):
| (5) |
where E max is the maximum stimulation of response relative to baseline, EC50 is the GH concentration required to reach 50% of E max and C P,GH and R IGF‐1 is GH and IGF‐1 plasma concentrations.
It was seen that change in IGF‐1 concentration from baseline was delayed for hours, and a model where C P,GH was delayed through pool compartments to a compartment with CPLAG,GH was attempted. Besides Equation (5), a sigmoidal E max relationship, a log‐linear relationship and an effect compartment model (Cleton et al., 1999) were explored.
PD model for bodyweight gain
The IGF‐1 model of growth envisages that the growth promoting effects of GH are primarily mediated through the action of IGF‐1 (Daughaday, 2000). Therefore, bodyweight gain was linked to the IGF‐1 concentration. Quantitatively, growth of an animal can be divided into four stages: early exponential growth (a) followed by a linear growth phase (b) where more energy is gradually devoted to maintenance resulting in a plateau (c) and eventually senescence (d) (Karkach, 2006). An empirical model was used, where bodyweight would only increase from base bodyweight with a linear (as below) or log–linear relationship to concentration of IGF‐1. The change in bodyweight is given by
| (6) |
where SLD BW is a slope that describes bodyweight gain per hour multiplied by the IGF‐1 concentration minus baseline IGF‐1 (so only rhGH‐induced IGF‐1 contributes).
Prediction of human PKPD
PK parameters from the PKPD model was scaled directly to human values using Equation (1), with fixed exponents of 0.75 and −0.25 for clearance processes (including V max) and first‐order rate constants, respectively, and an animal bodyweight of 0.1 kg. Scaling of distribution volumes was performed with exponents between 0.8 and 1.0 as the value can be slightly lower than the conventional value of 1.0 for proteins (Mordenti et al., 1991). The constant K M was not scaled. Proteins administered s.c. enters the systemic circulation either by diffusion through blood capillaries or through the lymphatic system, and the relative uptake between the two routes are related to the MW (Porter et al., 2001). Therefore, the absorption model established in the PKPD model was used with absorption rate constants scaled with an exponent of −0.25 (Woo and Jusko, 2007).
For prediction of human PD, all estimated parameters were unscaled except baseline IGF‐1, R 0, which was fixed to the mean from an available human dataset (65 ng·mL−1) (Laursen et al., 1996) and the first‐order rate constant k out, which was scaled with weight using Equation (1) with an exponent of −0.25.
A clinical dataset consisting of 10 growth hormone deficient male patients receiving 5 μg·kg−1 rhGH i.v. and 33.5 μg·kg−1 rhGH s.c. was used to access the validity of the predictions (Laursen et al., 1996). This was carried out with nonmem® by defining parameters according to Equation (1), using derived parameter values in the input file and relating the parameters to the individual patients' bodyweight. The dataset with 10 patients were simulated 2000 times with variability as estimated in the PKPD model. The RUV model used corresponded to the one established in the PKPD model with fixed values of 0.25 for PK (proportional and additive) and 10 for PD (additive, IGF‐1).
Results
Data from the PKPD study that established the relation between rhGH dose and IGF‐1 induction as a function of time is shown in Figure 1A, B, and C. IGF‐1 induction appeared non‐linear to dose with counter‐clockwise hysteresis, indicating effect delay relative to the PK profile (not shown). The magnetic resonance scan revealed a decrease in bodyweight‐normalized body fat and an increase in bodyweight normalized lean body mass. The observed increase in total bodyweight is most likely due to an increase in muscle and bone weight and not an increase in body fat or water retention.
Figure 1.
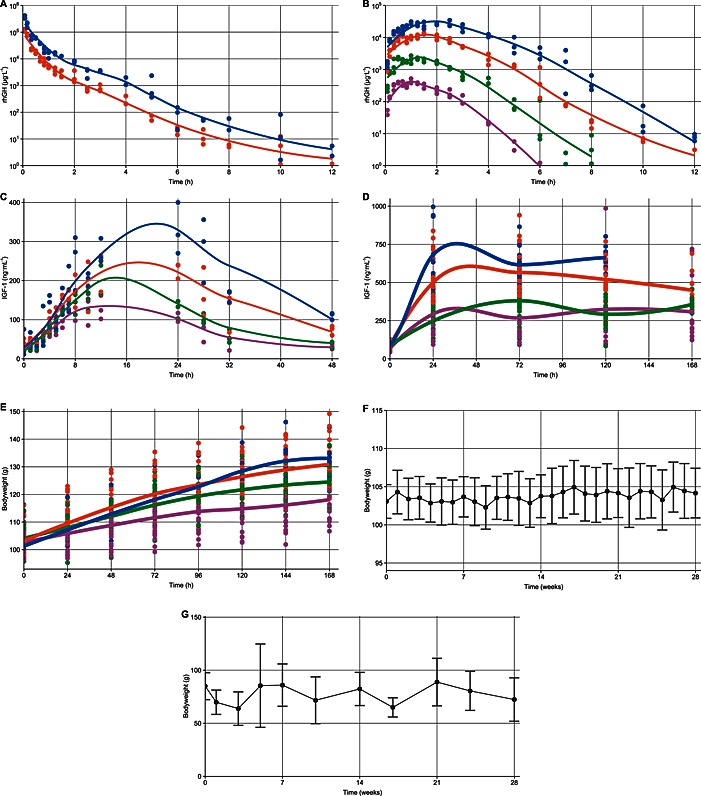
Plots of raw data from the included studies following i.v. (A) and s.c. (B) administration of rhGH, IGF‐1 induction following s.c. administration of rhGH (C) and one‐week IGF‐1 (D) and bodyweight (E) measurements following daily treatment, overlaid with a loess‐smoothed curve. Additionally, plots of raw data from the vehicle groups in the two long‐term studies (n = 20) indicating mean (±95% confidence interval) of bodyweight (F) and IGF‐1 (G) measurements over time. Colours correspond to dose levels of 0 μg (•), 44 μg ( ), 221 μg (
 ), 1106 μg (
 ) and 3319 μg (
 ) rhGH absolute (PD studies) or per 100 g bodyweight (PKPD study).
The final model simultaneously described rhGH PK and the PD effects as measured by IGF‐1 induction, steady‐state IGF‐1 levels and bodyweight gain (Figure 2).
Figure 2.
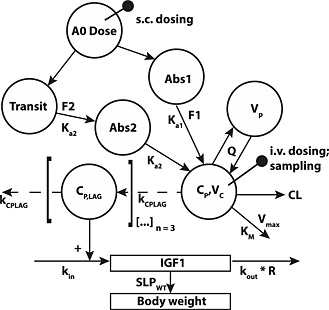
Final model structure used in the mixed‐effects PKPD analysis of rhGH.
Parameter estimates from the final estimation along with relative standard errors (RSEs) from nonmem® covariance step are shown in Table 2. The estimates were generally precisely estimated except for k a1 and F1. However, these two estimates were similar to those from the final PK model where they were estimated more precisely with F1 of 3.47% (24 RSE) and k a1 of 2.99 (25 RSE). A bootstrap for the final PKPD model was unfeasible due to runtimes, but a 2000 sample bootstrap of the final PK model gave similar results with F1 of 3.53% (20 RSE) and k a1 of 3.00 (14 RSE), and the parameters were thus kept in the model.
Table 2.
Parameter values from the mixed‐effects PKPD model in hypophysectomized rats
| Parameter (units) | Parameter definition | Population value (RSE %) | Inter‐individual variation | ||
|---|---|---|---|---|---|
| COV% | (RSE %) | [SHR%] | |||
| CL (L·h−1) | Linear clearance term | 0.0285 (6) | 11.6 | (20) | [31] |
| V max (μg·h−1) | Non‐linear elimination term maximum capacity | 11.5 (36) | — | ||
| K M (μg·L−1) | rhGH concentration at which 50% of V max is reached | 358 (43) | — | ||
| V C (L) | Central volume of distribution | 0.0069 (13) | — | ||
| Q (L·h−1) | Distribution clearance between central and peripheral compartment | 0.0101 (15) | — | ||
| V P (L) | Peripheral volume of distribution | 0.0081 (14) | 18.4 | (20) | [34] |
| k a1 (h−1) | First order absorption rate constant | 3.02 (141) | — | ||
| k a2 (h−1) | First order absorption rate constant – delayed with transit | 1.22 (5) | 9.3 | (18) | [7] |
| F1 | Bioavailability through k a1 following s.c. administration | 3.16% (122) | — | ||
| F2 | Bioavailability through k a2 following s.c. administration | 83.3% (10) | — | ||
| k out (h−1) | First order rate constant for degradation of IGF‐1 | 0.0913 (7) | — | ||
| R 0 (ng·mL−1) | Baseline level of IGF‐1 | 29.4 (13) | 17.0 | (8) | [19] |
| E max | Maximum change relative to baseline (R 0) for PKPD study | 9.88 (19) | — | ||
| E max (PD) | Maximum change relative to baseline (R 0) for PD studies | 23.9 (17) | — | ||
| EC50 (μg·L−1) | rhGH concentration to achieve 50% of E max | 16.3 (18) | — | ||
| k CPLAG (h−1) | First order rate constant to delay rhGH induction of IGF‐1 | 0.599 (6) | — | ||
| SLD | Slope for bodyweight gain | 0.000309 (3) | — | ||
| WTBASE (g) | Estimated bodyweight at study start | 106 (1) | 5.2 | (9) | [23] |
| Prop‐PK (rhGH) | Proportional residual error for PK model | 0.233 (7) | — | ||
| Add‐PK (rhGH) | Additive residual error for PK model | 0.279 (21) | — | ||
| Add‐PD (IGF‐1) | Additive residual error for PD model (IGF‐1) for PKPD study | 21.3 (7) | — | ||
| Add‐PD (IGF‐1) | Additive residual error for PD model (IGF‐1) for PD studies | 78.2 (7) | 58.8 | (13) | [30] |
| Add‐PD (Bodyweight) | Additive residual error for PD bodyweight model | 2.38 (2) | — | ||
PKPD, pharmacokinetic–pharmacodynamic; rhGH, recombinant human growth hormone; IGF‐1, insulin‐like growth factor 1; RSE, residual standard error; COV, coefficient of variation; SHR, shrinkage.
Final model performance was assessed through simulation based diagnostics (pcVPCs) shown in Figure 3.
Figure 3.
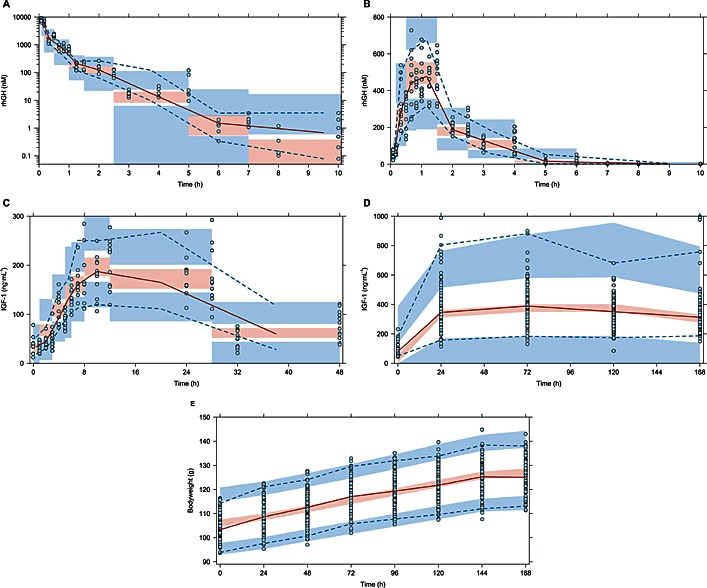
Prediction‐corrected VPCs to assess the models ability to describe the observed data and its variability. The time‐courses shown are: (A) rhGH following i.v. administration, (B) rhGH following s.c. administration, (C) IGF‐1 induction following s.c. administration of a single rhGH dose, (D) steady‐state levels of IGF‐1 and (E) bodyweight gain following daily s.c. doses of rhGH. The ( ) represent observed data, the (
 ) represents the median of the observed data and the (
 ) represent the median of the 2.5 % and 97.5 % outer observations. The (
 ) represents a simulation‐based 95% confidence interval for the median; while the (
 ) represent a simulation‐based 95% confidence interval for the 2.5 % and 97.5 % model‐predicted percentiles.
PK model
The disposition of rhGH was best described by a two‐compartment model with parallel elimination through a non‐linear and a constant clearance term. The parallel routes of elimination significantly improved the model by reduction in the OFV (−91) and IIV and RUV terms. Absorption was described using parallel first‐order absorption rate constants k a1 and k a2, with k a2 delayed through one transit compartment. A minor fraction of the dose (3.2%) was taken up through k a1, and most was absorbed through k a2 (84%) resulting in a total bioavailability of 87%.
IIV terms were included on linear clearance (CL), the peripheral volume (V P) with an estimated negative correlation (−0.568) and on the second absorption rate constant (k a2). PK parameters (CL, Q, V C and V P) were scaled according to bodyweight with fixed exponents of 0.75 and 1.0 for clearance processes and distribution volumes, which were found to be statistically significant following backwards deletion. A combined proportional and additive error model best described RUV.
Vehicle response
No trend or changes over time were observed for measurements following vehicle administration (supported by Figure 1F and G), and both IGF‐1 and bodyweight were modelled as an individual baseline value additive with residual error.
PD model for IGF‐1
Increase in IGF‐1 concentration following s.c. injection was best described by an indirect response model with stimulation of kin. The effect was delayed by use of transit compartments to transfer the rhGH concentration from the central compartment to a delayed ‘pool’ (CPLAG,GH), with an optimal number of three compartments judged by the OFV and VPCs. Two E max terms were used as the rats that received multiple doses reached higher levels of IGF‐1 already following the first dose, although the dose levels were comparable. The RUV was modelled as additive, with one term describing each study design. IIV was included on baseline IGF‐1 and on the error term describing the PD studies as sampling was done with greater uncertainty.
PD model for bodyweight gain
Bodyweight gain was best described using an estimated base bodyweight with IIV and a linear model linked to the IGF‐1 concentration, with RUV modelled as additive.
Prediction of human PKPD
All parameters were scaled for the included individuals using Equation (1) with predicted parameter values for a 70 kg man shown in Table 3.
Table 3.
Scaled parameters for prediction of the human PKPD relationship of rhGH
| Parameter (units) | Model value | b | Predicted a | Inter‐individual variability |
|---|---|---|---|---|
| CL (L·h−1) | 0.0285 | 0.75 | 3.88 | 11.6% |
| V max (μg·h−1) | 11.5 | 0.75 | 1565 | — |
| K M (μg·L−1) | 358 | — | 403 | — |
| V C (L) | 0.0069 | 0.9 | 2.51 | — |
| Q (L·h−1) | 0.0101 | 0.75 | 1.37 | — |
| V P (L) | 0.0081 | 0.9 | 2.94 | 18.4% |
| k a1 (h−1) | 3.02 | −0.25 | 0.587 | — |
| k a2 (h−1) | 1.22 | −0.25 | 0.237 | 19.3% |
| F1 | 0.0316 | — | 0.0316 | — |
| F2 | 0.833 | — | 0.833 | — |
| k out (h−1) | 0.0913 | −0.25 | 0.0178 | — |
| R 0 (ng·mL−1) | 29.4 | — | 65 | 17.0% |
| E max | 9.88 | — | 9.88 | — |
| EC50 (μg L−1) | 16.3 | — | 16.3 | — |
PKPD, pharmacokinetic–pharmacodynamic; rhGH, recombinant human growth hormone.
For a man with a bodyweight of 70 kg and using 0.1 kg as rat bodyweight.
Clearance terms, including V max, were scaled with 0.75 whereas distribution volumes were scaled with exponents of both 0.8, 0.9 and 1.0 and compared through simulation and inspection of pcVPCs (Figure 4A, B, and C). Scaling distribution values with a value of 0.9 gave the best predictions of the observed human data and its variability following i.v. administration (Figure 4b). The constant K M was not scaled.
Figure 4.

Prediction‐corrected VPCs used to evaluate prediction of human PK following an i.v. bolus of rhGH. The graphs represent predictions with the distribution volumes scaled with an exponent of 0.8 (A), 0.9 (B) and 1.0 (C). The () represent observed data, the () represents the median of the observed data and the () represent the median of the 2.5 % and 97.5 % outer observations. The () represents a simulation‐based 95% confidence interval for the median; while the () represent a simulation‐based 95% confidence interval for the 2.5 % and 97.5 % model‐predicted percentiles.
For s.c. administration, the first‐order absorption rate constants were scaled with an exponent of −0.25 with bioavailability kept as estimated in the model. The predictions captured the overall trend in the human absorption profile, but exposure was greater than observed (Figure 5A). To improve the description of s.c. absorption for validation of the variability terms and the prediction of PD, bioavailability for the second absorption route was reduced from 83.4% to 50%, and a transit compartment was added to the first absorption route as predicted initial absorption was slightly high. This improved the predictions, which now adequately described the median of the human data, but slightly underestimated its variability (Figure 5b).
Figure 5.
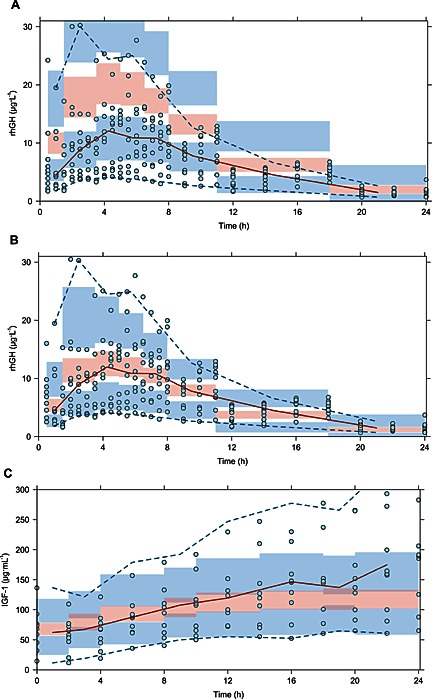
Prediction‐corrected VPCs used to evaluate s.c. absorption (A) and corrected s.c. absorption (B) in order to assess prediction of IGF‐1 induction (C). The () represent observed data, the () represents the median of the observed data and the () represent the median of the 2.5 % and 97.5 % outer observations. The () represents a simulation‐based 95% confidence interval for the median; while the () represent a simulation‐based 95% confidence interval for the 2.5 % and 97.5 % model‐predicted percentiles.
The optimized description of s.c. absorption was used for scaling of the IGF‐1 response, in which k out was scaled according to bodyweight with exponent −0.25, as k in was parameterized through its relation to k out and baseline IGF‐1, as by Equation (4). The effect delay for rats was not included for predictions, as patients had only been deprived of rhGH for 1 week in order to washout IGF‐1 (Laursen et al., 1996). The predicted PD response well described the initial profile and variability observed in humans, but the model predictions reaches a plateau after 12 h, whereas the observed data continues to rise slowly until the last observations (Figure 5C). Furthermore, while the model adequately describes the variability in the beginning, the last observations show greater variability in response than predicted.
Discussion
The mixed‐effects PKPD model presented here is, to our knowledge, the first that provides a mechanistic description of the PKPD relationship following single and multiple doses of rhGH in hypophysectomized rats. The established model, which is based on a rich dataset that represents a wide dose range and a large population of animals, links rhGH concentration to induction of IGF‐1, which is, in turn, linked directly to bodyweight gain.
PK
The final PK model described profiles following both i.v. and s.c. administration well, at all dose levels using two parallel elimination pathways. The non‐linear elimination, which has been shown with similar proteins, for example, erythropoietin, is thought to be caused by receptor‐mediated endocytosis through the GH‐receptor and GH‐binding protein (Husman et al., 1988; Woo et al., 2006). Absorption following s.c. administration through two parallel first‐order absorption rate constants could mechanistically represent uptake through the lymph system versus blood capillaries. Approximately 3% of s.c. administered erythropoietin and bovine and Lispro insulin, proteins similar in MW to rhGH, have been found in lymph fluid in the rat, which corresponds to the estimated bioavailability for uptake through the first absorption route (k a1) (Kagan et al., 2007).
The inclusion of bodyweight as covariate on clearance and disposition parameters is a well‐established methodology (Boxenbaum, 1982), but the slight, and statistically non‐significant, improvement can potentially be attributed to the low bodyweight differences of the animals, which were in the range of 90–110 g. Estimating the exponents did not return meaningful values or improvement over fixed values of 0.75 and 1.0.
PD
When modelling the PD, it is important to determine if measured PD end points are changing without drug administration (Gao and Jusko, 2012). Hypophysectomy is an invasive technique that deprives the animal of many hormones at once, and while inadequate removal of the pituitary gland might show as slow but steady growth, a non‐recovering animal might lose bodyweight over the study period. Furthermore, as pre‐dose measurements did not check levels of endogenous GH, the vehicle group analysis supports the assumption that observed effects are the result of exogenous rhGH administration.
The indirect response model provides the best description of IGF‐1 induction, but a long delay was observed before IGF‐1 concentrations increased from baseline. The plausible explanation for this is the deprivation of hypophysectomized rats from GH for up to four weeks before dosing due to recovery, transport and acclimatization. As exogenous GH administration promotes IGF‐1 synthesis from the liver, IGF‐1 mRNA must be up‐regulated before IGF‐1 synthesis can start. This delay is only thought to be present following the first dose, as the level of mRNA adjusts upon GH exposure (Roberts et al., 1986). However, the data to support this theory was not at hand, and the established delay was kept for repeated dosing.
The difference in maximum achieved levels of IGF‐1 between the two study types (Emax of 9.8 vs. 23.8) can partly be explained by a combination of differences in study design and because rodents undergo physiological changes with excess administration of exogenous GH. The intense sampling carried out in the single‐dose PKPD study will dilute the IGF‐1 level for each sample taken, compared with the PD studies in which the rats were dosed, then left for 24 h before the first sample. However, rodents have also been shown to respond to excess GH by an increased expression of the GH receptor, membrane‐associated GH‐binding protein and GH‐binding protein. As the former two both contribute to the hepatic GH binding capacity, daily administration of GH is likely to affect both PK and PD parameters, resulting in increased non‐linear elimination capacity and higher concentrations of IGF‐1 through increased GH receptor binding (Gonzalez et al., 2007). The combination of study design and physiological alterations, combined with the delay in IGF‐1 synthesis described above, might explain the differences in maximum IGF‐1 levels achievable following daily dosing (~700 ng·mL−1), compared with a single dose (~300 ng·mL−1).
Increase in bodyweight was modelled as a linear function of the IGF‐1 concentration, which captured the established E max dose–response relation between rhGH and IGF‐1. This model is empirical as growth will gradually decrease with time (Karkach, 2006), but it sufficiently described the growth observed during the first week, for the dose range examined. Linear bodyweight gain in the rat can be expected to last for several weeks of rhGH dosing, if hypophysectomy is carried out around the age of four weeks (Hubert et al., 2000). However, this is complicated by formation of antibodies against rhGH and the fact that supra‐physiological doses are likely to introduce a state of acromegaly, which could affect the interpretation of growth data. Antibody formation is thought to hinder rhGH binding to the GH receptor and thus inhibit IGF‐1 production, whereas closing of the epiphyseal plates will mean that even high IGF‐1 concentrations will not increase bodyweight.
The presented model is similar to a previous model of rhGH in monkeys following both i.v. and s.c. administration (Sun et al., 1999). Differences exist, mainly with regards to the identification of parallel elimination and absorption and differences in E max. The study in monkeys found a 3.2 maximum increase of IGF‐1 compared with our estimates of 9.88 and 23.9, which are likely to be due to our use of a hypophysectomized animal model with lower baseline IGF‐1. Further, the maximum levels of IGF‐1 reached in our studies (~700 ng·mL−1) correspond well to the value reported in monkeys following continuous rhGH administration (Sun et al., 1999).
Prediction of human PKPD
In order to predict the human PKPD relationship, model parameters were scaled allometrically with fixed exponents of 0.75, 0.9 and −0.25. The exponent of 0.9 for distribution volumes predicts a V C of 2.51 L for a 70 kg man, which corresponds approximately to the plasma volume, whereas exponents of 0.8 and 1.0 yields 1.30 and 4.83 L respectively. The predicted time‐course of an i.v. bolus including IIV fits well with the observed human data when using an exponent of 0.9. However, it is unclear if the relation between disposition and elimination parameters differs in humans, as the allometric predictions assumes that all differences between rats and humans can be described by differences in bodyweight.
Predictions of rhGH concentrations following s.c. administration were higher compared with observed values, but the profile shape corresponded well. If the established absorption model does indeed represent a split between lymphatic and capillary uptake, the rate and fraction absorbed between the two would differ in humans due to differences in composition of s.c. fat and skin. Prediction of absorption based on an animal model like the mini‐pig could prove more accurate, as its hypodermis more closely resembles that in humans (Richter et al., 2012).
With adjusted absorption, the predicted IGF‐1 response was close to that observed for humans until around 14 h after dose, where the model predictions approached a plateau but observations continued to rise. This might be attributed to differences in affinity between rhGH and the rat GH‐receptor vs. human GH‐receptor, as the estimated EC50 of 16.4 μg·L−1 is higher than most of the observed values following s.c. administration. Furthermore, as the highest dose given to rats is 1000 times higher than the 33 μg·kg−1 given in the clinical study used to validate the model predictions, the estimated EC50 might be biased towards higher rhGH concentrations and not directly translatable.
A published analysis of rhGH in humans using similar clearance mechanisms found values of 9.6 L·h−1 for CL/F, 104 μg·h−1 for V max and 3.6 μg·L−1 for K M, which are very different from those predicted on the basis of our analysis (Webster et al., 2008). This might point towards changes to the clearance mechanisms in the animal model we used, which can complicate human predictions. With the concentrations of rhGH that is reached following normal human doses (<<K M), the scaled non‐linear clearance mechanism remains in the linear part of the V max/K M relationship.
To expand on the model and prediction of the human PKPD, it would be interesting to study the PK following multiple doses as this might affect clearance mechanisms. As absorption was the parameter limiting acceptable prediction of the PK following s.c. administration, improved knowledge of absorption processes and s.c. degradation in rats and humans will help us to better understand these differences. Finally, a mixed‐effects PKPD model of human data will allow us to compare the parameters obtained in the rodent model to check species independence of PD parameters. Knowledge of differences between PKPD parameters in rats and humans for rhGH can also help in assessing the potential of new GH analogues and add confidence when predicting their human PKPD relationship. This will enable selection of good starting doses for first‐in‐human studies and potentially reduce attrition rate through clinical development programs.
Conclusion
In conclusion, we have established a mechanistic mixed‐effects PKPD model linking rhGH dose to IGF‐1, a clinically relevant effect biomarker, which in turn was linked directly to a relevant end‐point, bodyweight gain. This demonstrates the usefulness of PKPD modelling of pre‐clinical animal data and provides a quantitative way of comparing results from testing of new GH analogues in the hypophysectomized rat model with those for current treatment. Adequate predictions of both time course and variability were obtained following direct scaling of structural PK parameters, but more knowledge is needed about differences between s.c. absorption in rats and humans. The induction of IGF‐1 was well predicted, after correction of s.c. absorption, with only a minor under‐prediction at the highest concentrations.
Author contributions
A.T., M.K., P.T. and H.A. designed and carried out the analysis. P.T. and T.L. were responsible for the production of data (study design and collection). A.T. and M.K. drafted the manuscript, which were critically revised and received final approval by all authors.
Conflict of interest
All animal studies were sponsored by and carried out at Novo Nordisk A/S, Måløv, Denmark. P.T. and H.A. are employees of Novo Nordisk A/S. M.K. is a current employee of Novo Nordisk A/S but not during the production of this work. A.T. and T.L. declare no conflicts of interest.
Declaration of transparency and scientific rigour
This Declaration acknowledges that this paper adheres to the principles for transparent reporting and scientific rigour of preclinical research recommended by funding agencies, publishers and other organizations engaged with supporting research.
Acknowledgements
B.F., K.M. and S.C. are thanked for their skilful technical assistance and help in conducting animal studies. J.F. is thanked for his assistance with the quantitative analysis of rhGH and IGF‐1 samples.
Thorsted, A. , Thygesen, P. , Agersø, H. , Laursen, T. , and Kreilgaard, M. (2016) Translational mixed‐effects PKPD modelling of recombinant human growth hormone – from hypophysectomized rat to patients. British Journal of Pharmacology, 173: 1742–1755. doi: 10.1111/bph.13473.
References
- Alexander SPH, Fabbro D, Kelly E, Marrion N, Peters JA, Benson HE et al. (2015). The Concise Guide to PHARMACOLOGY 2015/16: Catalytic receptors. Br J Pharmacol 172: 5979–6023. [DOI] [PMC free article] [PubMed] [Google Scholar]
- Bergstrand M, Hooker AC, Wallin JE, Karlsson MO (2011). Prediction‐corrected visual predictive checks for diagnosing nonlinear mixed‐effects models. AAPS J 13: 143–151. [DOI] [PMC free article] [PubMed] [Google Scholar]
- Boxenbaum H (1982). Interspecies scaling, allometry, physiological time, and the ground plan of pharmacokinetics. J Pharmacokinet Biopharm 10: 201–227. [DOI] [PubMed] [Google Scholar]
- Cleton A, de Greef HJMM, Edelbroek PM, Voskuyl RA, Danhof M (1999). Application of a combined "effect compartment/indirect response model" to the central nervous system effects of tiagabine in the rat. J Pharmacokinet Biopharm 27: 301–323. [DOI] [PubMed] [Google Scholar]
- Curtis MJ, Bond RA, Spina D, Ahluwalia A, Alexander SP, Giembycz MA et al. (2015). Experimental design and analysis and their reporting: new guidance for publication in BJP. Br J Pharmacol 172: 3461–3471. [DOI] [PMC free article] [PubMed] [Google Scholar]
- Daughaday WH (2000). Growth hormone axis overview–somatomedin hypothesis. Pediatr Nephrol 14: 537–540. [DOI] [PubMed] [Google Scholar]
- Dayneka NL, Garg V, Jusko WJ (1993). Comparison of four basic models of indirect pharmacodynamic responses. J Pharmacokinet Biopharm 21: 457–478. [DOI] [PMC free article] [PubMed] [Google Scholar]
- Gao W, Jusko WJ (2012). Modeling disease progression and rosiglitazone intervention in type 2 diabetic Goto‐Kakizaki rats. J Pharmacol Exp Ther 341: 617–625. [DOI] [PMC free article] [PubMed] [Google Scholar]
- Gibbs JP (2010). Prediction of exposure‐response relationships to support first‐in‐human study design. AAPS J 12: 750–758. [DOI] [PMC free article] [PubMed] [Google Scholar]
- Gonzalez L, Curto LM, Miquet JG, Bartke A, Turyn D, Sotelo AI (2007). Differential regulation of membrane associated‐growth hormone binding protein (MA‐GHBP) and growth hormone receptor (GHR) expression by growth hormone (GH) in mouse liver. Growth Horm IGF Res 17: 104–112. [DOI] [PubMed] [Google Scholar]
- Hubert MF, Laroque P, Gillet JP, Keenan KP (2000). The effects of diet, ad libitum feeding, and moderate and severe dietary restriction on body weight, survival, clinical pathology parameters, and cause of death in control Sprague–Dawley rats. Toxicol Sci 58: 195–207. [DOI] [PubMed] [Google Scholar]
- Husman B, Gustafsson JA, Andersson G (1988). Receptor‐mediated endocytosis and degradation of bovine growth hormone in rat liver. Mol Cell Endocrinol 59: 13–25. [DOI] [PubMed] [Google Scholar]
- Jonsson EN, Karlsson MO (1999). Xpose–an S‐PLUS based population pharmacokinetic/pharmacodynamic model building aid for NONMEM. Comput Methods Programs Biomed 58: 51–64. [DOI] [PubMed] [Google Scholar]
- Jorgensen JO, Pedersen SA, Thuesen L, Jorgensen J, Ingemann‐Hansen T, Skakkebaek NE et al. (1989). Beneficial effects of growth hormone treatment in GH‐deficient adults. Lancet 1: 1221–1225. [DOI] [PubMed] [Google Scholar]
- Kagan L, Gershkovich P, Mendelman A, Amsili S, Ezov N, Hoffman A (2007). The role of the lymphatic system in subcutaneous absorption of macromolecules in the rat model. Eur J Pharm Biopharm 67: 759–765. [DOI] [PubMed] [Google Scholar]
- Karkach AS (2006). Trajectories and models of individual growth. Demographic Res 15: 348–400. [Google Scholar]
- Keizer RJ, van Benten M, Beijnen JH, Schellens JH, Huitema AD (2011). Pirana and PCluster: a modeling environment and cluster infrastructure for NONMEM. Comput Methods Programs Biomed 101: 72–79. [DOI] [PubMed] [Google Scholar]
- Kilkenny C, Browne W, Cuthill IC, Emerson M, Altman DG (2010). Animal research: reporting in vivo experiments: the ARRIVE guidelines. Br J Pharmacol 160: 1577–1579. [DOI] [PMC free article] [PubMed] [Google Scholar]
- Krebs A, Wallaschofski H, Spilcke‐Liss E, Kohlmann T, Brabant G, Volzke H et al. (2008). Five commercially available insulin‐like growth factor I (IGF‐I) assays in comparison to the former Nichols Advantage IGF‐I in a growth hormone treated population. Clin Chem Lab Med 46: 1776–1783. [DOI] [PubMed] [Google Scholar]
- Krysiak R, Gdula‐Dymek A, Bednarska‐Czerwinska A, Okopien B (2007). Growth hormone therapy in children and adults. Pharmacol Rep 59: 500–516. [PubMed] [Google Scholar]
- Laron Z (2011). Growth hormone therapy: emerging dilemmas. Pediatr Endocrinol Rev 8: 364–373. [PubMed] [Google Scholar]
- Laursen T, Grandjean B, Jorgensen JO, Christiansen JS (1996). Bioavailability and bioactivity of three different doses of nasal growth hormone (GH) administered to GH‐deficient patients: comparison with intravenous and subcutaneous administration. Eur J Endocrinol 135: 309–315. [DOI] [PubMed] [Google Scholar]
- Lindbom L, Ribbing J, Jonsson EN (2004). Perl‐speaks‐NONMEM (PsN)–a Perl module for NONMEM related programming. Comput Methods Programs Biomed 75: 85–94. [DOI] [PubMed] [Google Scholar]
- Mager DE, Jusko WJ (2008). Development of translational pharmacokinetic‐pharmacodynamic models. Clin Pharmacol Ther 83: 909–912. [DOI] [PMC free article] [PubMed] [Google Scholar]
- Mager DE, Woo S, Jusko WJ (2009). Scaling pharmacodynamics from in vitro and preclinical animal studies to humans. Drug Metab Pharmacokinet 24: 16–24. [DOI] [PMC free article] [PubMed] [Google Scholar]
- Mathews LS, Norstedt G, Palmiter RD (1986). Regulation of insulin‐like growth factor I gene expression by growth hormone. Proc Natl Acad Sci U S A 83: 9343–9347. [DOI] [PMC free article] [PubMed] [Google Scholar]
- McGrath JC, Lilley E (2015). Implementing guidelines on reporting research using animals (ARRIVE etc.): new requirements for publication in BJP. Br J Pharmacol 172: 3189–3193. [DOI] [PMC free article] [PubMed] [Google Scholar]
- Mordenti J, Chen SA, Moore JA, Ferraiolo BL, Green JD (1991). Interspecies scaling of clearance and volume of distribution data for five therapeutic proteins. Pharm Res 8: 1351–1359. [DOI] [PubMed] [Google Scholar]
- Maack T, Johnson V, Kau ST, Figueiredo J, Sigulem D (1979). Renal filtration, transport, and metabolism of low‐molecular‐weight proteins: a review. Kidney Int 16: 251–270. [DOI] [PubMed] [Google Scholar]
- Pawson AJ, Sharman JL, Benson HE, Faccenda E, Alexander SPH, Buneman OP et al. (2014). The IUPHAR/BPS Guide to PHARMACOLOGY: an expert‐driven knowledge base of drug targets and their ligands. Nucleic Acids Res 42 (Database Issue): D1098–D1106. [DOI] [PMC free article] [PubMed] [Google Scholar]
- Porter CJ, Edwards GA, Charman SA (2001). Lymphatic transport of proteins after s.c. injection: implications of animal model selection. Adv Drug Deliv Rev 50: 157–171. [DOI] [PubMed] [Google Scholar]
- Richter WF, Bhansali SG, Morris ME (2012). Mechanistic determinants of biotherapeutics absorption following SC administration. AAPS J 14: 559–570. [DOI] [PMC free article] [PubMed] [Google Scholar]
- Roberts CT Jr, Brown AL, Graham DE, Seelig S, Berry S, Gabbay KH et al. (1986). Growth hormone regulates the abundance of insulin‐like growth factor I RNA in adult rat liver. J Biol Chem 261: 10025–10028. [PubMed] [Google Scholar]
- Rousseau A, Leger F, Le Meur Y, Saint‐Marcoux F, Paintaud G, Buchler M et al. (2004). Population pharmacokinetic modeling of oral cyclosporin using NONMEM – comparison of absorption pharmacokinetic models and design of a Bayesion estimator. Ther Drug Monit 26: 23–30. [DOI] [PubMed] [Google Scholar]
- Sun YN, Lee HJ, Almon RR, Jusko WJ (1999). A pharmacokinetic pharmacodynamic model for recombinant human growth hormone effects on induction of insulin‐like growth factor I in monkeys. J Pharmacol Exp Ther 289: 1523–1532. [PubMed] [Google Scholar]
- Team RC (2013). R: A Language and Environment for Statistical Computing. R Foundation for Statistical Computing: Vienna, Austria. [Google Scholar]
- Ullman EF, Kirakossian H, Switchenko AC, Ishkanian J, Ericson M, Wartchow CA et al. (1996). Luminescent oxygen channeling assay (LOCI): sensitive, broadly applicable homogeneous immunoassay method. Clin Chem 42: 1518–1526. [PubMed] [Google Scholar]
- Webster R, Xie R, Didier E, Finn R, Finnessy J, Edgington A et al. (2008). PEGylation of somatropin (recombinant human growth hormone): impact on its clearance in humans. Xenobiotica 38: 1340–1351. [DOI] [PubMed] [Google Scholar]
- Wei Y, Wang Y, Kang A, Wang W, Ho SV, Gao J et al. (2012). A novel sustained‐release formulation of recombinant human growth hormone and its pharmacokinetic, pharmacodynamic and safety profiles. Mol Pharm 9: 2039–2048. [DOI] [PubMed] [Google Scholar]
- Wickham H (2009). ggplot2 – Elegant Graphics for Data Analysis. 1st ed. Springer Verlag: Springer Dordrecht Heidleberg London New York. [Google Scholar]
- Woo S, Jusko WJ (2007). Interspecies comparisons of pharmacokinetics and pharmacodynamics of recombinant human erythropoietin. Drug Metab Dispos 35: 1672–1678. [DOI] [PubMed] [Google Scholar]
- Woo S, Krzyzanski W, Jusko WJ (2006). Pharmacokinetic and pharmacodynamic modeling of recombinant human erythropoietin after intravenous and subcutaneous administration in rats. J Pharmacol Exp Ther 319: 1297–1306. [DOI] [PubMed] [Google Scholar]