

Abstract
Objective
To quantify the platelet concentration in the blood of SHR rats, by means of different centrifugation protocols, and to evaluate what the most effective method for obtaining platelets is.
Methods
We used 40 male rats of the isogenic SHR lineage. The animals were divided into three groups: control, using whole blood without centrifugation; single centrifugation, using whole blood subjected to a single centrifugation at 200 × g and 400 × g; and double centrifugation, using whole blood subjected one centrifugation at different rotations, followed by collection of whole plasma subjected to another centrifugation at different rotations: 200 × g + 200 × g; 200 × g + 400 × g; 200 × g + 800 × g; 400 × g + 400 × g; 400 × g + 800 × g. Samples of 3 ml of blood were drawn from each animal by means of cardiac puncture. The blood was stored in Vacutainer collection tubes containing 3.2% sodium citrate. The blood from the control group animals was analyzed without being subjected to centrifugation. After the blood from the other groups of animals had been subjected to centrifugation, the whole plasma was collected and subjected to platelet counting in the lower third of the sample.
Results
We obtained greatest platelet enrichment in the subgroup with two centrifugations comprising 400 × g for 10 min + 400 × g for 10 min, in which the mean platelet concentration was 11.30 times higher than that of the control group.
Conclusion
It was possible to obtain a high platelet concentration using viable simple techniques, by means of centrifugation of whole blood and use of commonly used materials. The most effective method for obtaining platelet concentrate was found in samples subjected to two centrifugations.
Keywords: Platelet count, Centrifugation, Platelet-rich plasma
Resumo
Objetivo
Quantificar a concentração de plaquetas do sangue de ratos SHR, por meio de diferentes protocolos de centrifugação, e avaliar qual o método mais eficaz de obtenção de plaquetas.
Métodos
Usamos 40 ratos machos da linhagem isogênica SHR. Os animais foram divididos em três grupos: Controle (GCT) - sangue total sem centrifugação; Única Centrifugação (GUC) - sangue total submetido a uma única centrifugação: 200 g e 400 g; Dupla Centrifugação (GDC) - sangue total submetido a uma centrifugação, seguido de coleta do plasma total, e realizado uma centrifugação, em diferentes rotações: 200 g + 200 g; 200 g + 400 g; 200 g + 800 g; 400 g + 400 g; 400 g + 800 g. Foram retirados 3 ml de sangue de cada animal por meio de punção cardíaca. O sangue foi acondicionado em tubo de coleta vacutainer com citrato de sódio 3,2%. O sangue dos animais do grupo controle não foi submetido à centrifugação e foi analisado. Após a centrifugação do sangue dos animais, submetido à centrifugação, o plasma total foi coletado e submetido à contagem de plaquetas no terço inferior da amostra.
Resultados
Obtivemos maior enriquecimento de plaquetas no subgrupo de duas centrifugações (400 g por 10 minutos + 400 g por 10 minutos), no qual ocorreu uma concentração média de plaquetas 11,30 vezes superior em relação ao grupo controle.
Conclusão
Foi possível obter uma alta concentração plaquetária, com técnica simples e viável, por meio de centrifugação do sangue total e uso de materiais de uso corriqueiro; e método mais eficaz de obtenção de concentrado de plaquetas ocorreu nas amostras submetidas a duas centrifugações.
Palavras-chave: Contagem de plaquetas, Centrifugação, Plasma rico em plaquetas
Introduction
Platelets are cytoplasmic anucleate fragments found in blood and produced by megakaryocytes in the bone marrow.1, 2 Of the total number of platelets present in the body, 70% are present in the circulation and 30% in the spleen, remaining in the circulation for an average of 10 days, when they are removed by the reticuloendothelial cells of the spleen and liver.1, 2, 3 Platelets are directly involved in several major diseases, as in severe thrombotic syndromes or conditions such as arterial thrombosis.4, 5
The hemostatic system is inherently responsible for the maintenance of blood flow and vascular integrity, as it is able to form a plug over a damaged surface of the vascular endothelium when it suffers an injury. Thus, hemostasis minimizes blood loss and promotes the restoration of the normal vascular architecture.6, 7, 8
The platelet-rich plasma (PRP) is the autologous platelet concentration in a small volume of plasma, obtained by centrifugation of whole blood, considered an important source of growth factors. Its basic constitution is given by three components: plasma, leukocytes and platelets. The platelet-rich fibrin (PRF) is a platelet concentrate, obtained from fibrin membrane, with high potential for tissue regeneration. Thus, as in PRP, platelet concentrates contained in the PRF release growth factors (GFs) that enhance the regeneration process. Additionally, the fibrin matrix promotes angiogenesis, facilitates the access to the injured site, with an important role in tissue healing.9
Described for the first time in France in 2000,9 platelet-rich fibrin (PRF), a new concept and still little described in the treatment using fibrin gel, is a platelet concentrate over a fibrin membrane with a high potential for injury repair. The membrane is obtained from autologous blood without the addition of external factors.10
It is known that platelets act in the process of hemostasis, injury healing and reepithelialization, release several growth factors and that at least seven different GF were identified in the initial phase of injury healing. Therefore, the release of these GF by platelet α-granules plays an important role in the control and proliferation of mesenchymal cells, including fibroblasts. PRP is activated by adding calcium ions, with the release of GF and the exocytosis of α-granules and transforms fibrinogen into fibrin. Through this process, we also obtain autologous fibrin glue, also called platelet gel or PRP gel. The PRP gel presentation facilitates its use and handling in several surgical areas and promotes the integration of flaps and grafts, such as bone, skin, cartilage or fat cells. The use results in more rapid and efficient healing, due to adhesion effect of the gel, which is proportional to the present fibrinogen.11, 12, 13
Obtaining PRP and PRF is relatively simple and has a low cost. These platelet concentrates provide autologous treatments with the potential to stimulate the natural biological process of healing and assist in the regeneration of different tissues. The basic difference between obtaining PRP and PRF is that, to obtain platelet-rich plasma, a tube with anticoagulant is used (sodium citrate or EDTA 3.2%), while the blood should be collected in a dry tube to obtain platelet-rich fibrin.
There are several available PRP preparation systems using a benchtop centrifuge, but in preclinical and clinical studies, the attained results seem contradictory. There is a lack of more systematic and consistent studies on the subject, which makes PRP preparation remain an experimental procedure, despite its promising application in tissue regeneration.
Calixto,14 when studying the human blood, verified that the best method of obtaining PRP is the one in which a single centrifugation is made, of 200 × g for 10 min. Pereira,15 using seven protocols to obtain PRP in horses, verified that the higher the g force and the longer the centrifugation time, the higher was the total platelet concentration.
As the animals most often used in research laboratories are rats and due to the lack of studies in this animal model, we decided to perform this study to evaluate the best method to obtain the best platelet concentration, in different protocols, to quantify the concentration of blood platelets in SHR rats, using different centrifugation protocols and evaluate what the most effective method is to obtain platelet concentrate.
Materials and methods
The work was performed in the Laboratory of Microsurgery of the Hand and Upper Limb Surgery Discipline of the Department of Orthopedics and Traumatology and at the Laboratory of Hematology of the Department of Clinical and Toxicological Analyses of our institution. The study was approved by the Research Ethics Committee (REC n. 0312/12).
A total of 40 male rats of the isogenic SHR lineage were used in the study, weighing 280–300 g, provided by Centro de Desenvolvimento de Modelos Experimentais para Medicina e Biologia. The animals were kept in collective cages in the vivarium, with 5 rats in each, in a controlled light-dark cycle environment (12/12 h), temperature of 21 ± 2 °C, free access to water and food throughout the entire study period.
The animals were divided into three groups:
(1) Control Group (CTG) – whole blood without centrifugation (n = 5).
(2) Single Centrifugation Group (SCG) – whole blood subjected to a single centrifugation. This group was divided into two subgroups:
-
(a)
SCG-I: 200 × g centrifugation for 10 min (n = 5)
-
(b)
SCG-II: 400 × g centrifugation for 10 min (n = 5)
(3) Double Centrifugation Group (DCG) – whole blood subjected to centrifugation, followed by whole plasma collection and subjected to a second centrifugation at different rotations. This group was divided into five subgroups:
-
(a)
DCG-I: centrifugation at 200 × g for 10 min, followed by a second 200 × g centrifugation for 10 min (n = 5)
-
(b)
DCG-II: 200 × g centrifugation for 10 min, followed by a second centrifugation at 400 × g for 10 min (n = 5)
-
(c)
DCG-III 200 × g centrifugation for 10 min, followed by a second centrifugation for 10 min at 800 × g (n = 5)
-
(d)
DCG-IV 400 × g centrifugation for 10 min, followed by a second centrifugation for 10 min at 400 × g (n = 5)
-
(e)
DCG-V: 400 × g centrifugation for 10 min, followed by a second centrifugation for 10 min at 800 × g (n = 5)
Blood and plasma sample collection
The animals were anesthetized with an intraperitoneal injection with anesthetic solution consisting of xylazine 1 U/100 g and ketamine 1 U/100 g.
After being anesthetized, 3 ml of blood was withdrawn from each animal by cardiac puncture. The collected blood was placed in a vacutainer tube with sodium citrate at 3.2%.
The blood of the animals from the control group was not submitted to centrifugation and was analyzed after shaking the tube for 2 min at 4 °C for homogenization.
Samples of whole animal blood were centrifuged according to the protocol described above for each group in a bench centrifuge (Eppendorf 5810 R) at 4 °C.
After centrifugation, the animals’ blood was subjected to a single centrifugation and the whole plasma was collected into a 1.5 mL Eppendorf tube and subjected to platelet counting in the lower third of the sample.
For the animals’ blood subjected to two centrifugations, after the first centrifugation the whole plasma was collected in a 1.5 mL Eppendorf tube and subjected to another centrifugation. The platelet count was performed in the lower third of the sample (Fig. 1).
Fig. 1.

Plasma collection in the 1.5 mL Eppendorf tube.
Platelet count
The obtained samples were subjected to platelet count in a hematology analyzer (Animal Blood Counter – Vet ABC) calibrated for blood parameters of rats (Fig. 2).
Fig. 2.
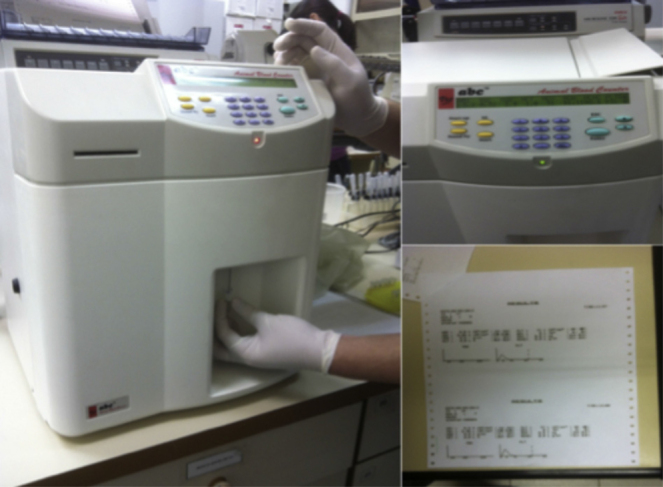
Platelet count in the hematology analyzer.
Statistical methods
The resulting hematological parameters, according to the subgroups using summary measures (mean, standard deviation, median, minimum and maximum) were compared to the subgroups using Kruskal–Wallis tests followed by Dunn's multiple non-parametric comparisons, when necessary to compare the subgroups two by two.
Results
The results were depicted using tables and bar charts that represent the median values of each parameter according to the subgroups; the tests were performed with a significance level of 5%.
Table 1 shows that all assessed parameters showed statistically significant difference between the groups (p < 0.05).
Table 1.
Description of resulting hematological parameters.
| Variable | Group | Mean | SD | Median | Minimum | Maximum | N | p |
|---|---|---|---|---|---|---|---|---|
| Leukocytes | CTRL | 3060 | 219.1 | 3200 | 2700 | 3200 | 5 | 0.016 |
| 200 × g-10 min | 420 | 465.8 | 200 | 100 | 1200 | 5 | ||
| 400 × g-10 min | 420 | 549.5 | 200 | 100 | 1400 | 5 | ||
| 200 × g-10 min + 200 × g-10 min | 1160 | 2260.1 | 100 | 100 | 5200 | 5 | ||
| 200 × g-10 min + 400 × g-10 min | 1860 | 1105.9 | 1400 | 500 | 3100 | 5 | ||
| 200 × g-10 min + 800 × g-10 min | 2.700 | 3755.7 | 700 | 300 | 9200 | 5 | ||
| 400 × g-10 min + 400 × g-10 min | 3.020 | 2983.6 | 1500 | 400 | 7800 | 5 | ||
| 400 × g-10 min + 800 × g-10 min | 3160 | 3943.7 | 500 | 200 | 8700 | 5 | ||
| Erythrocytes | CTRL | 7,120,000 | 358,956.8 | 7,020,000 | 6.640.000 | 7,530,000 | 5 | <0.001 |
| 200 × g-10 min | 22,000 | 16,431.7 | 20,000 | 10,000 | 50,000 | 5 | ||
| 400 × g-10 min | 14,000 | 11,401.8 | 10,000 | 0 | 30,000 | 5 | ||
| 200 × g-10 min + 200 × g-10 min | 80,000 | 134,721.9 | 20,000 | 10,000 | 320,000 | 5 | ||
| 200 × g-10 min + 400 × g-10 min | 262,000 | 895,545 | 240,000 | 150,000 | 380,000 | 5 | ||
| 200 × g-10 min + 800 × g-10 min | 170,000 | 101,242.3 | 150,000 | 60,000 | 330,000 | 5 | ||
| 400 × g-10 min + 400 × g-10 min | 120,000 | 86,313.4 | 150,000 | 20,000 | 220,000 | 5 | ||
| 400 × g-10 min + 800 × g-10 min | 188,000 | 199,549.5 | 70,000 | 10,000 | 420,000 | 5 | ||
| Platelets | CTRL | 648,800 | 30,094.9 | 648,000 | 614,000 | 695,000 | 5 | 0.013 |
| 200 × g-10 min | 1,632,400 | 580,962.4 | 1650.000 | 682,000 | 2,122,000 | 5 | ||
| 400 × g-10 min | 939,600 | 687,417.1 | 863,000 | 110,000 | 1,764,000 | 5 | ||
| 200 × g-10 min + 200 × g-10 min | 3,826,000 | 4920.808.4 | 456,000 | 29,000 | 970.0000 | 5 | ||
| 200 × g-10 min + 400 × g-10 min | 4,760,000 | 2254.550.953 | 530.0000 | 130.0000 | 720.0000 | 5 | ||
| 200 × g-10 min + 800 × g-10 min | 4,080,000 | 1685.823,241 | 310.0000 | 270.0000 | 6500.000 | 5 | ||
| 400 × g-10 min + 400 × g-10 min | 7,320,000 | 2819.929,077 | 7,300,000 | 2,800,000 | 9,700,000 | 5 | ||
| 400 × g-10 min + 800 × g-10 min | 5,500,000 | 1813.835,715 | 5200.000 | 3400.000 | 7600.000 | 5 | ||
| Plasma volume (mL) | CTRL | 0 | 0 | 0 | 0 | 0 | 5 | <0.001 |
| 200 × g-10 min | 0.72 | 0.11 | 0.8 | 0.6 | 0.8 | 5 | ||
| 400 × g-10 min | 1.10 | 0.10 | 1.1 | 1 | 1.2 | 5 | ||
| 200 × g-10 min + 200 × g-10 min | 1.46 | 0.11 | 1.5 | 1.3 | 1.6 | 5 | ||
| 200 × g-10 min + 400 × g-10 min | 1.60 | 0.10 | 1.6 | 1.5 | 1.7 | 5 | ||
| 200 × g-10 min + 800 × g-10 min | 1.62 | 0.04 | 1.6 | 1.6 | 1.7 | 5 | ||
| 400 × g-10 min + 400 × g-10 min | 1.62 | 0.08 | 1.6 | 1.5 | 1.7 | 5 | ||
| 400 × g-10 min + 800 × g-10 min | 1.72 | 0.08 | 1.7 | 1.6 | 1.8 | 5 |
Kruskal–Wallis test result.
Fig. 3, Fig. 4 suggest higher amounts of leukocytes and erythrocytes in the control group.
Fig. 3.

Median leukocyte values according to subgroups.
Fig. 4.

Median erythrocyte values according to subgroups.
Fig. 5 shows that the highest platelet enrichment occurred in the subgroup of two 400 × g + 400 × g centrifugations.
Fig. 5.

Median platelet values according to subgroups.
The plasma volume values shown in Fig. 6 are higher with two centrifugations (400 × g for 10 min + 800 × g for 10 min).
Fig. 6.

Median plasma volume values.
Table 2 shows that the resulting amount of leukocytes was statistically higher in the control group when compared to the subgroups with a single centrifugation (p = 0.004 and p = 0.004) and in relation to the subgroup with two 200 × g centrifugations and 10 min each (p = 0.007). On the other hand, the subgroup with two 400 × g centrifugations and 10 min each showed statistically more leukocytes than the subgroups with a single centrifugation (p < 0.05) and the subgroup with two 200 × g centrifugations and 10 min each (p = 0.031).
Table 2.
Results of multiple leukocyte comparisons.
| Leukocytes | |||
|---|---|---|---|
| Comparison | Z value | p | |
| CTRL VS | 200 × g-10 min | 2.84 | 0.004 |
| CTRL VS | 400 × g-10 min | 2.84 | 0.004 |
| CTRL VS | 200 × g-10 min + 200 × g-10 min | 2.70 | 0.007 |
| CTRL VS | 200 × g-10 min + 400 × g-10 min | 0.90 | 0.367 |
| CTRL VS | 200 × g-10 min + 800 × g-10 min | 1.04 | 0.298 |
| CTRL VS | 400 × g-10 min + 400 × g-10 min | 0.54 | 0.589 |
| CTRL VS | 400 × g-10 min + 800 × g-10 min | 1.11 | 0.267 |
| 200 × g-10 min VS | 400 × g-10 min | 0.00 | >0.999 |
| 200 × g-10 min VS | 200 × g-10 min + 200 × g-10 min | −0.14 | 0.890 |
| 200 × g-10 min VS | 200 × g-10 min + 400 × g-10 min | −1.94 | 0.052 |
| 200 × g-10 min VS | 200 × g-10 min + 800 × g-10 min | −1.80 | 0.071 |
| 200 × g-10 min VS | 400 × g-10 min + 400 × g-10 min | −2.30 | 0.021 |
| 200 × g-10 min VS | 400 × g-10 min + 800 × g-10 min | −1.73 | 0.083 |
| 400 × g-10 min VS | 200 × g-10 min + 200 × g-10 min | −0.14 | 0.890 |
| 400 × g-10 min VS | 200 × g-10 min + 400 × g-10 min | −1.94 | 0.052 |
| 400 × g-10 min VS | 200 × g-10 min + 800 × g-10 min | −1.80 | 0.071 |
| 400 × g-10 min VS | 400 × g-10 min + 400 × g-10 min | −2.30 | 0.021 |
| 400 × g-10 min VS | 400 × g-10 min + 800 × g-10 min | −1.73 | 0.083 |
| 200 × g-10 min + 200 × g-10 min VS | 200 × g-10 min + 400 × g-10 min | −1.80 | 0.071 |
| 200 × g-10 min + 200 × g-10 min VS | 200 × g-10 min + 800 × g-10 min | −1.66 | 0.096 |
| 200 × g-10 min + 200 × g-10 min VS | 400 × g-10 min + 400 × g-10 min | −2.16 | 0.031 |
| 200 × g-10 min + 200 × g-10 min VS | 400 × g-10 min + 800 × g-10 min | −1.59 | 0.111 |
| 200 × g-10 min + 400 × g-10 min VS | 200 × g-10 min + 800 × g-10 min | 0.14 | 0.890 |
| 200 × g-10 min + 400 × g-10 min VS | 400 × g-10 min + 400 × g-10 min | −0.36 | 0.718 |
| 200 × g-10 min + 400 × g-10 min VS | 400 × g-10 min + 800 × g-10 min | 0.21 | 0.835 |
| 200 × g-10 min + 800 × g-10 min VS | 400 × g-10 min + 400 × g-10 min | −0.50 | 0.618 |
| 200 × g-10 min + 800 × g-10 min VS | 400 × g-10 min + 800 × g-10 min | 0.07 | 0.945 |
| 400 × g-10 min + 400 × g-10 min VS | 400 × g-10 min + 800 × g-10 min | 0.57 | 0.570 |
Dunn's multiple comparison test results.
Table 3 shows that the amount of red blood cells was statistically higher in the control than in the other subgroups (p < 0.05), with the exception of the subgroups with two centrifugations of 200 × g-10 min + 400 × g-10 min and 200 × g-10 min + 800 × g-10 min (p = 0.192 and p = 0.056). These two subgroups showed statistically more red blood cells than the subgroups of a single centrifugation and subgroups of two 200 × g centrifugations and 10 min each (p < 0.05).
Table 3.
Results of multiple erythrocyte comparisons.
| Erythrocytes | |||
|---|---|---|---|
| Comparison | Z value | p | |
| CTRL VS | 200 × g-10 min | 3.90 | <0.001 |
| CTRL VS | 400 × g-10 min | 4.27 | <0.001 |
| CTRL VS | 200 × g-10 min + 200 × g-10 min | 3.41 | 0.001 |
| CTRL VS | 200 × g-10 min + 400 × g-10 min | 1.30 | 0.192 |
| CTRL VS | 200 × g-10 min + 800 × g-10 min | 1.91 | 0.056 |
| CTRL VS | 400 × g-10 min + 400 × g-10 min | 2.44 | 0.015 |
| CTRL VS | 400 × g-10 min + 800 × g-10 min | 2.18 | 0.029 |
| 200 × g-10 min VS | 400 × g-10 min | 0.37 | 0.708 |
| 200 × g-10 min VS | 200 × g-10 min + 200 × g-10 min | −0.49 | 0.627 |
| 200 × g-10 min VS | 200 × g-10 min + 400 × g-10 min | −2.59 | 0.010 |
| 200 × g-10 min VS | 200 × g-10 min + 800 × g-10 min | −1.98 | 0.047 |
| 200 × g-10 min VS | 400 × g-10 min + 400 × g-10 min | −1.46 | 0.145 |
| 200 × g-10 min VS | 400 × g-10 min + 800 × g-10 min | −1.72 | 0.086 |
| 400 × g-10 min VS | 200 × g-10 min + 200 × g-10 min | −0.86 | 0.390 |
| 400 × g-10 min VS | 200 × g-10 min + 400 × g-10 min | −2.97 | 0.003 |
| 400 × g-10 min VS | 200 × g-10 min + 800 × g-10 min | −2.36 | 0.018 |
| 400 × g-10 min VS | 400 × g-10 min + 400 × g-10 min | −1.83 | 0.067 |
| 400 × g-10 min VS | 400 × g-10 min + 800 × g-10 min | −2.09 | 0.036 |
| 200 × g-10 min + 200 × g-10 min VS | 200 × g-10 min + 400 × g-10 min | −2.11 | 0.035 |
| 200 × g-10 min + 200 × g-10 min VS | 200 × g-10 min + 800 × g-10 min | −1.50 | 0.134 |
| 200 × g-10 min + 200 × g-10 min VS | 400 × g-10 min + 400 × g-10 min | −0.97 | 0.332 |
| 200 × g-10 min + 200 × g-10 min VS | 400 × g-10 min + 800 × g-10 min | −1.23 | 0.217 |
| 200 × g-10 min + 400 × g-10 min VS | 200 × g-10 min + 800 × g-10 min | 0.61 | 0.542 |
| 200 × g-10 min + 400 × g-10 min VS | 400 × g-10 min + 400 × g-10 min | 1.14 | 0.255 |
| 200 × g-10 min + 400 × g-10 min VS | 400 × g-10 min + 800 × g-10 min | 0.87 | 0.382 |
| 200 × g-10 min + 800 × g-10 min VS | 400 × g-10 min + 400 × g-10 min | 0.53 | 0.598 |
| 200 × g-10 min + 800 × g-10 min VS | 400 × g-10 min + 800 × g-10 min | 0.26 | 0.792 |
| 400 × g-10 min + 400 × g-10 min VS | 400 × g-10 min + 800 × g-10 min | −0.26 | 0.792 |
Dunn's multiple comparison test results.
Table 4 shows that the amount of platelets with two centrifugations was statistically higher than the control, with a single centrifugation, and the subgroup with two centrifugations, with 200 × g and 10 min each (p < 0.05).
Table 4.
Results of multiple platelet comparisons.
| Platelets | |||
|---|---|---|---|
| Comparison | Z value | p | |
| CTRL VS | 200 × g-10 min | −1.03 | 0.305 |
| CTRL VS | 400 × g-10 min | −0.25 | 0.803 |
| CTRL VS | 200 × g-10 min + 200 × g-10 min | −1.19 | 0.233 |
| CTRL VS | 200 × g-10 min + 400 × g-10 min | −2.50 | 0.013 |
| CTRL VS | 200 × g-10 min + 800 × g-10 min | −2.29 | 0.022 |
| CTRL VS | 400 × g-10 min + 400 × g-10 min | −3.48 | 0.001 |
| CTRL VS | 400 × g-10 min + 800 × g-10 min | −2.91 | 0.004 |
| 200 × g-10 min VS | 400 × g-10 min | 0.78 | 0.437 |
| 200 × g-10 min VS | 200 × g-10 min + 200 × g-10 min | −0.17 | 0.868 |
| 200 × g-10 min VS | 200 × g-10 min + 400 × g-10 min | −1.47 | 0.142 |
| 200 × g-10 min VS | 200 × g-10 min + 800 × g-10 min | −1.26 | 0.207 |
| 200 × g-10 min VS | 400 × g-10 min + 400 × g-10 min | −2.45 | 0.014 |
| 200 × g-10 min VS | 400 × g-10 min + 800 × g-10 min | −1.89 | 0.059 |
| 400 × g-10 min VS | 200 × g-10 min + 200 × g-10 min | −0.94 | 0.346 |
| 400 × g-10 min VS | 200 × g-10 min + 400 × g-10 min | −2.25 | 0.025 |
| 400 × g-10 min VS | 200 × g-10 min + 800 × g-10 min | −2.04 | 0.041 |
| 400 × g-10 min VS | 400 × g-10 min + 400 × g-10 min | −3.23 | 0.001 |
| 400 × g-10 min VS | 400 × g-10 min + 800 × g-10 min | −2.66 | 0.008 |
| 200 × g-10 min + 200 × g-10 min VS | 200 × g-10 min + 400 × g-10 min | −1.30 | 0.192 |
| 200 × g-10 min + 200 × g-10 min VS | 200 × g-10 min + 800 × g-10 min | −1.10 | 0.273 |
| 200 × g-10 min + 200 × g-10 min VS | 400 × g-10 min + 400 × g-10 min | −2.29 | 0.022 |
| 200 × g-10 min + 200 × g-10 min VS | 400 × g-10 min + 800 × g-10 min | −1.72 | 0.086 |
| 200 × g-10 min + 400 × g-10 min VS | 200 × g-10 min + 800 × g-10 min | 0.21 | 0.835 |
| 200 × g-10 min + 400 × g-10 min VS | 400 × g-10 min + 400 × g-10 min | −0.98 | 0.325 |
| 200 × g-10 min + 400 × g-10 min VS | 400 × g-10 min + 800 × g-10 min | −0.42 | 0.677 |
| 200 × g-10 min + 800 × g-10 min VS | 400 × g-10 min + 400 × g-10 min | −1.19 | 0.233 |
| 200 × g-10 min + 800 × g-10 min VS | 400 × g-10 min + 800 × g-10 min | −0.62 | 0.533 |
| 400 × g-10 min + 400 × g-10 min VS | 400 × g-10 min + 800 × g-10 min | 0.57 | 0.570 |
Dunn's multiple comparison test results.
Table 5 shows that the obtained plasma volume was statistically similar to the behavior of platelets. Subgroups with two centrifugations have higher volume than the other subgroups, except for the subgroup with two centrifugations, with 200 × g and 10 min each.
Table 5.
Results of plasma volume comparisons.
| Plasma volume | |||
|---|---|---|---|
| Comparison | Z value | p | |
| CTRL VS | 200 × g-10 min | −0.69 | 0.488 |
| CTRL VS | 400 × g-10 min | −1.39 | 0.166 |
| CTRL VS | 200 × g-10 min + 200 × g-10 min | −2.36 | 0.018 |
| CTRL VS | 200 × g-10 min + 400 × g-10 min | −3.38 | 0.001 |
| CTRL VS | 200 × g-10 min + 800 × g-10 min | −3.55 | <0.001 |
| CTRL VS | 400 × g-10 min + 400 × g-10 min | −3.58 | <0.001 |
| CTRL VS | 400 × g-10 min + 800 × g-10 min | −4.47 | <0.001 |
| 200 × g-10 min VS | 400 × g-10 min | −0.69 | 0.488 |
| 200 × g-10 min VS | 200 × g-10 min + 200 × g-10 min | −1.66 | 0.096 |
| 200 × g-10 min VS | 200 × g-10 min + 400 × g-10 min | −2.69 | 0.007 |
| 200 × g-10 min VS | 200 × g-10 min + 800 × g-10 min | −2.86 | 0.004 |
| 200 × g-10 min VS | 400 × g-10 min + 400 × g-10 min | −2.88 | 0.004 |
| 200 × g-10 min VS | 400 × g-10 min + 800 × g-10 min | −3.77 | <0.001 |
| 400 × g-10 min VS | 200 × g-10 min + 200 × g-10 min | −0.97 | 0.332 |
| 400 × g-10 min VS | 200 × g-10 min + 400 × g-10 min | −2.00 | 0.046 |
| 400 × g-10 min VS | 200 × g-10 min + 800 × g-10 min | −2.16 | 0.031 |
| 400 × g-10 min VS | 400 × g-10 min + 400 × g-10 min | −2.19 | 0.028 |
| 400 × g-10 min VS | 400 × g-10 min + 800 × g-10 min | −3.08 | 0.002 |
| 200 × g-10 min + 200 × g-10 min VS | 200 × g-10 min + 400 × g-10 min | −1.03 | 0.305 |
| 200 × g-10 min + 200 × g-10 min VS | 200 × g-10 min + 800 × g-10 min | −1.19 | 0.233 |
| 200 × g-10 min + 200 × g-10 min VS | 400 × g-10 min + 400 × g-10 min | −1.22 | 0.222 |
| 200 × g-10 min + 200 × g-10 min VS | 400 × g-10 min + 800 × g-10 min | −2.11 | 0.035 |
| 200 × g-10 min + 400 × g-10 min VS | 200 × g-10 min + 800 × g-10 min | −0.17 | 0.868 |
| 200 × g-10 min + 400 × g-10 min VS | 400 × g-10 min + 400 × g-10 min | −0.19 | 0.846 |
| 200 × g-10 min + 400 × g-10 min VS | 400 × g-10 min + 800 × g-10 min | −1.08 | 0.279 |
| 200 × g-10 min + 800 × g-10 min VS | 400 × g-10 min + 400 × g-10 min | −0.03 | 0.978 |
| 200 × g-10 min + 800 × g-10 min VS | 400 × g-10 min + 800 × g-10 min | −0.92 | 0.360 |
| 400 × g-10 min + 400 × g-10 min VS | 400 × g-10 min + 800 × g-10 min | −0.89 | 0.375 |
Dunn's multiple comparison test results.
The tables and figures show that the amount of platelets with two centrifugations (400 × g + 400 × g subgroup) was statistically higher than the control with only a single centrifugation, whereas the subgroup with two centrifugations, with 200 × g and 10 min each (p < 0.05) showed a mean concentration of platelets (400 × g + 400 × g) that was 11.30-fold higher compared to the control group.
Discussion
The literature shows techniques to obtain platelet-rich plasma, as the first one used, only applicable in a hospital structure with plasmapheresis machine that requires a technician to manipulate it.16 The procedure had higher morbidity and required sophisticated technology.
The search for techniques to obtain PRP with lower costs has led to the use of some simple methods with test tubes and a common centrifuge, which allow the preparation of platelet-rich plasma at a much lower cost and in an outpatient setting. However, these methods are laborious and require learning from those who will perform the procedure.
The existing methods in the literature do not reach the same platelet concentrations. Some are insufficient to improve tissue regeneration. These factors may explain much of the criticism about the effectiveness and applicability of platelet-rich plasma.
Another key factor is associated with the anticoagulant. Usually, sodium citrate 3.2% is used. The sodium citrate captures calcium ions from blood and neutralized them, forming a compound named chelate that prevents clot formation. Additionally, the sodium citrate does not alter the platelet membrane receptors and, consequently, the chelation process can be reversed by the addition of calcium chloride to form platelet gel.17
The recent technology allows the use of PRP with small blood volumes, thus minimizing the need for red blood cell reinfusion and associated risks. However, there is little information about the optimal amount of platelets for better tissue repair.
The literature shows several protocols for obtaining PRP. The number of centrifugations (one or two) will depend on the method to be used. Some authors suggest only one centrifugation, while other references indicate a double centrifugation protocol.
Any protocol to obtain the PRP should concentrate platelets at its maximum to correspond to the clinical results reported in the literature. But in addition to a high platelet concentration with a large release of growth factors, it is very important that the integrity of platelets is maintained. The growth factors must be released from viable platelets, as during the act of granular exocytosis, the platelet completes the tertiary structure of the growth factor proteins. Fragmented platelets can degranulate large amounts of growth factors, but with decreased effectiveness.18
In this study, we compared the number of platelets obtained from peripheral blood and subjected to one and two centrifugations; the higher enrichment occurred in the group with two centrifugations. The results are similar, when compared to the results of some published studies, such as the one by Calixto.14
In the study by Calixto,14 carried out in humans, test tubes with the anticoagulant sodium citrate at 3.2% and EDTA were used, which showed a difference in platelet concentration, higher when citrate was used. Based on this fact, we chose the citrate as the only anticoagulant in the collection tubes.
Vendramin et al.19obtained platelet-rich plasma of better quality using two centrifugations at 400 × g for 10 min + 800 × g for 10 min. In our study, we obtained a high platelet concentration with 400 × g + 800 × g; however, the highest amount of platelets was obtained with 400 × g for 10 min + 400 × g for 10 min. This result shows that the lysis of platelets can occur above this force, which influences its final concentration.
Several studies were performed in humans, rabbits and horses; however, we did not find centrifugation protocols in rats. With the establishment of a protocol to obtain PRP in rats, which reached a high platelet concentration, we encourage future studies to evaluate the clinical effectiveness of platelet-rich plasma. Further studies may emerge from our protocol and expand its use in the regeneration of nerves, tissue, bone and ligament grafts.
Conclusion
It was possible to obtain a high platelet concentration, using a simple and feasible technique, through whole blood centrifugation and using common materials such as collection tubes, syringes and needles. The most effective method to obtain a platelet concentrate was achieved in the samples subjected to two centrifugations (400 × g for 10 min + 400 × g for 10 min), which yielded a mean platelet concentration that was 11.30-fold higher than that in the control group.
Conflicts of interest
The authors declare no conflicts of interest.
Acknowledgements
To Dr. Primavera Borelli Garcia and technician Edson from the Hematology Laboratory of the Department of Clinical and Toxicological Analysis, Faculdade de Ciências Farmacêuticas da USP, for their help and technical support for the research.
Footnotes
Study carried out at the Laboratory of Microsurgery of the Discipline of Hand and Upper Limb Surgery, Department of Orthopedics and Traumatology, Universidade Federal de São Paulo (Unifesp), São Paulo, SP, Brazil.
References
- 1.Italiano J.E., Hartwig J.H. Megakaryocyte development and platelet formation. In: Michelson A.D., editor. Platelets. Academic Press; California: 2002. pp. 21–36. [Google Scholar]
- 2.Schulze H., Shivdasani R.A. Mechanisms of thrombopoiesis. J Thromb Haemost. 2005;3(8):1717–1724. doi: 10.1111/j.1538-7836.2005.01426.x. [DOI] [PubMed] [Google Scholar]
- 3.Andrews R.K., Berndt M.C. Platelet physiology and thrombosis. Thromb Res. 2004;114(5-6):447–453. doi: 10.1016/j.thromres.2004.07.020. [DOI] [PubMed] [Google Scholar]
- 4.Gawaz M., Neumann F.J., Schomig A. Evaluation of platelet membrane glycoproteins in coronary artery disease: consequences for diagnosis and therapy. Circulation. 1999;99(1):E1–E11. doi: 10.1161/01.cir.99.1.e1. [DOI] [PubMed] [Google Scholar]
- 5.Gregg D., Goldschmidt-Clermont P.J. Cardiology patient page. Platelets and cardiovascular disease. Circulation. 2003;108(13):e88–e90. doi: 10.1161/01.CIR.0000086897.15588.4B. [DOI] [PubMed] [Google Scholar]
- 6.Bates E.R., Lau W.C. Controversies in antiplatelet therapy for patients with cardiovascular disease. Circulation. 2005;111(17):e267–e271. doi: 10.1161/01.CIR.0000157158.63751.B2. [DOI] [PubMed] [Google Scholar]
- 7.Erhardtsen E. To general haemostasis: the evidence-based route. Pathophysiol Haemost Thromb. 2002;32(Suppl. 1):47–52. doi: 10.1159/000057302. [DOI] [PubMed] [Google Scholar]
- 8.Stassen J.M., Arnout J., Deckmyn H. The hemostatic system. Curr Med Chem. 2004;11(17):2245–2260. doi: 10.2174/0929867043364603. [DOI] [PubMed] [Google Scholar]
- 9.Choukroun J., Diss A., Simonpieri A. Platelet-rich fibrin (PRF): a second-generation platelet concentrate. Part IV: clinical effects on tissue healing. Oral Surg Oral Med Oral Pathol Oral Radiol Endod. 2006;101(3):e56–e60. doi: 10.1016/j.tripleo.2005.07.011. [DOI] [PubMed] [Google Scholar]
- 10.Sunitha Raja V., Munirathnam Naidu E. Platelet-rich fibrin: evolution of a second-generation platelet concentrate. Indian J Dent Res. 2008;19(1):42–46. doi: 10.4103/0970-9290.38931. [DOI] [PubMed] [Google Scholar]
- 11.Eppley B.L., Woodell J.E., Higgins J. Platelet quantification and growth factor analysis from platelet-rich plasma: implications for wound healing. Plast Reconstr Surg. 2004;114(6):1502–1508. doi: 10.1097/01.prs.0000138251.07040.51. [DOI] [PubMed] [Google Scholar]
- 12.Green D.M., Klink B. Platelet gel as an intraoperatively procured platelet-based alternative to fibrin glue. Plast Reconstr Surg. 1998;101(4):1161–1162. doi: 10.1097/00006534-199804040-00067. [DOI] [PubMed] [Google Scholar]
- 13.Kevy S.V., Jacobson M.S. Comparison of methods for point of care preparation of autologous platelet gel. J Extra Corpor Technol. 2004;36(1):28–35. [PubMed] [Google Scholar]
- 14.Calixto C.A. Universidade Federal de São Paulo; São Paulo: 2011. Plasma rico em plaquetas (PRP) por meio de centrífuga de bancada [dissertação] [Google Scholar]
- 15.Pereira R.C.F. Universidade Federal de Santa Maria, RS; Santa Maria: 2012. Avaliação de sete protocolos de obtenção de plasma rico em plaquetas (PRP) [dissertação] [Google Scholar]
- 16.Marx R.E., Carlson E.R., Eichstaedt R.M., Schimmele S.R., Strauss J.E., Georgeff K.R. Platelet-rich plasma: growth factor enhancement for bone grafts. Oral Surg Oral Med Oral Pathol Oral Radiol Endod. 1998;85(6):638–646. doi: 10.1016/s1079-2104(98)90029-4. [DOI] [PubMed] [Google Scholar]
- 17.Anitua E. Plasma rich in growth factors: preliminary results of use in the preparation of future sites for implants. Int J Oral Maxillofac Implants. 1999;14(4):529–535. [PubMed] [Google Scholar]
- 18.Marx R.E. Platelet-rich plasma (PRP): what is PRP and what is not PRP? Implant Dent. 2001;10(4):225–228. doi: 10.1097/00008505-200110000-00002. [DOI] [PubMed] [Google Scholar]
- 19.Vendramin F.S., Franco D., Franco T.R. Método de obtenção do gel de plasma rico em plaquetas autólogo. Rev Bras Cir Plást. 2009;24(2):212–218. [Google Scholar]