

Abstract
Cytochrome P450 1b1 (Cyp1b1) is expressed in endothelia, stellate cells and pre-adipocytes, but not hepatocytes. Deletion alters liver fatty acid metabolism and prevents obesity and hepatic steatosis. This suggests a novel extra-hepatocyte regulation directed from cells that express Cyp1b1. To characterize these mechanisms, microarray gene expression was analyzed in livers of normal and congenic Cyp1b1-ko C57BL/6J mice fed either low or high fat diets. Cyp1b1-ko gene responses indicate suppression of endogenous PPARα activity, a switch from triglyceride storage to mitochondrial fatty acid oxidation and decreased oxidative stress. Many gene responses in Cyp1b1-ko are sexually dimorphic and correspond to increased activity of growth hormone mediated by HNF4α. Male responses stimulated by GH pulses are enhanced, whereas responses that decline exhibit further suppression, including Cyp regulation by PPARα, CAR and PXR. These effects of Cyp1b1 deletion overlap with effects caused by deletion of the small heterodimeric partner, a suppressor of these nuclear factors. Redirection of gene expression associated with liver fat homeostasis in Cyp1b1-ko mice that directs hypothalamic control of GH and leptin. Cyp1b1-ko suppresses neonatal Scd1 and delays adult maturation of dimorphic GH/HNF4α signaling. Alternatively, deletion may diminish hypothalamic metabolism of estradiol, which establishes adult GH regulation.
Keywords: Cyp1b1, obesity, liver, HNF4α, PPARα, growth hormone
Introduction
Experiments with Cytochrome P450 1b1 (Cyp1b1) null (Cyp1b1-ko) transgenic mice demonstrate the role of Cyp1b1 in toxicity and carcinogenesis caused by polycyclic aromatic hydrocarbons [1]. Cyp1b1 is essentially absent in mouse hepatocytes, but is expressed in non-parenchymal sinusoidal cells, including endothelia and stellate cells that are each adjacent to hepatocytes [2-4]. Cyp1b1 deletion in endothelia decreases vasculogenesis in vivo and capillary morphogenesis in vitro [3]. Cyp1b1 loss of function mutations in humans cause congenital glaucoma and provide a risk factor for liver adenomas [5,6].
During the differentiation of mesenchymal progenitor cells to adipocytes, Cyp1b1 expression increases in concert with peroxisome proliferator activated receptor γ (PPARγ), a key regulator of triglyceride synthesis [7]. To further characterize these mechanisms, gene expression was analyzed in livers of C57BL/6J (WT) and congenic Cyp1b1-ko mice fed either low or high fat diets (LFD or HFD, respectively). This HFD eventually causes diet-induced obesity (DIO), severe steatotic liver toxicity and glucose intolerance, which are each prevented by Cyp1b1 deletion [8,9]. The near absence of Cyp1b1 expression in mouse hepatocytes indicates that this signaling does not arise from substrates within these cells. Possibilities include the liver non-parenchymal cells, neuronal control from the hypothalamus or developmental re-direction.
Liver Cyp expression patterns are particularly susceptible to diet changes [10]. We show, here, that Cyp1b1 deletion has a striking impact on the expression of the 60 forms of Cyps in the liver. Although obesity changes are retained in both sexes, these Cyp changes occur almost exclusively in males. Many of these Cyps respond to the endogenous activity of nuclear receptors, such as the peroxisome proliferator activated receptor α (PPARα), the constitutive androstane receptor (CAR), the pregnane X receptor (PXR) and hepatocyte nuclear factor 4 α (HNF4α). Each is selectively activated by fatty acid or cholesterol derivatives [11-13]. HNF4α also plays a major role in liver development [13]. A liver–specific deletion of HNF4α in mice enhances hepatic steatosis [14] and substantially affects Cyp expression [15].
Endocrine control of hepatocytes is principally determined by insulin, glucagon, growth hormone (GH), epinephrine and corticosteroids to maintain euglycemia. Adiponectin, leptin and other cytokines from adipose tissue modulate these signals, particularly to engage fat metabolism. Leptin activity increases fatty acid oxidation and is directed through activation of sympathetic neurons in the hypothalalamus [16]. Local signaling to hepatocytes from the sinusoids derives from fenestrated endothelia, Kupfer macrophage and stellate cells. Cyp1b1 deletion substantially affects the morphology and oxidant signaling in endothelia and pericytes, which are present in the liver as stellate cells [3,17]. Cyp1b1 metabolism can impact hepatocytes through endogenous substrates, notably estradiol that imprints effects on fat homeostasis [18].
Cyp1b1 deletion principally affects pathways that control fatty acid metabolism and the associated oxidative stress processes [9]. We address the hypothesis that extra-hepatocyte Cyp1b1 metabolism controls diet-dependent signaling. The typical expression of Cyp1b1 in mesenchymal progenitors, vascular cells and astroglia indicates that this control may include effects on hepatocyte development. We have adopted the strategy that such diverse system influences may be better captured by a mechanism neutral approach: we resolve gene deletion effects according to the selectivity of two diverse, but relevant treatments (LFD versus HFD) and compare male and female liver gene responses.
The onset of adiposity occurs with different timing in males and females. We show that extension of the HFD for an additional 15 weeks in females produces a similar adiposity, liver physiology and HFD gene expression response as detailed for males. The NASH/obesity effects are similarly suppressed in male and female Cyp1b1-ko mice, much like the pro-obesity effects from the deletions of either ERa or aromatase [19,20]. Key gene changes should, therefore, appear in both sexes. Here, we show that Cyp1b1 extensively affects many gene responses directed by the lipid-responsive receptors HNF4α, PPARα, CAR and PXR and their control through pulsatile GH signaling and the small heterodimeric partner (Shp), a nuclear factor that represses this regulation [13,21,22]. Other responses that occur in both sexes correspond to suppression of leptin-controlled genes involved in fatty acid synthesis and suppression of inflammatory gene markers. These regulatory processes are sexually dimorphic and highly sensitive to post-weaning hepatocyte maturation. We show that many of the effects of Cyp1b1 deletion on liver gene expression result from altering this developmental program.
Materials and Methods
Ethics Statement
Mice were maintained in the AAALAC-accredited University of Wisconsin School of Medicine and Public Health Animal Care Facility. Experimental protocols were approved by the University of Wisconsin School of Medicine and Public Health Animal Care and Use Committee (ACUC; protocol number: M00682), in strict accordance to the EU Directive 2010/63/EU.
Mouse breeding and maintenance
Mice were provided food and water ad libitum and were maintained on a 12-hour light/dark cycle. The mice were fed a 10 percent fat/70 percent carbohydrate (LFD, D12450B) or 60 percent fat/20 percent carbohydrate (HFD, D12492) diet from Research Diets Inc. for 11 or 36 weeks post-weaning, as indicated.
Microsomal isolation and western blotting
Individual animal liver microsomes were isolated using differential centrifugation. Liver microsomes (25 μg) were separated by SDS-PAGE on a 10% gel (4% stacking) under reducing conditions and transferred to nitrocellulose membranes. Proteins were quantified repeatedly with a BCA assay (Pierce). Membranes were blocked with 5% nonfat dry milk in Tris buffered saline with 0.1% Tween-20 (TBST) for 1 hour at room temperature. Membranes were then incubated with Cypla2 (1:5000), Cyp2b (1:500), Cyp2c (1:1500), Cyp3a (1:2000), Cyp4a (1:1000), Mgst (1:5000), Ephxl (1:5000) and Scdl (1:400) overnight at 4°C in TBST with 0.02% sodium azide. Membranes were incubated with IgG horseradish peroxidase labeled secondary antibodies (1:10,000) for 1 hour at room temperature in 5% nonfat dry milk TBST. Membranes were exposed to ECL for 1 minute and developed on autoradiography film using an AGFA Curix 60 CP film processor. Band intensity was measured using Image J software and expressed as a percent of total peak area.
RNA isolation
RNA was isolated from liver samples using Qiagen shredder columns, followed by Qiagen RNeasy purification, according to the manufacturers specifications. RNA quality was assessed spectrophotometrically using a Thermo Scientific Nanodrop, followed by agarose gel electrophoresis.
Microarray analyses
Microarray experiments from male WT and Cyp1b1-ko mice, fed either the LFD or HFD for 11 weeks post weaning, were performed with three replicate liver mRNA samples, isolated from individual mice. Methods used for microarray preparation, cy3 or cy5 labeling of the cDNA probe, sample hybridization, washing, and scanning of arrays were carried out as previously described using the Agilent Technologies 4x44k platform [23]. Samples were prepared according to the manufacturer's instructions for dual-color or one-color labeling. Dual color labeling was used such that competitive binding of each of the treatment samples (Cy3-labeled) is co-hybridized with a pooled control sample of three LFD WT controls (Cy5-labeled). The one-color Cy3-labeling method was employed using a modified Agilent Technologies 4x44k platform for subsequent female liver mRNA expression analyses at weeks 11 and 36 weeks post weaning (WT, Cyp1b1-ko mice, HFD and LFD) and for male liver mRNA at 5 weeks post weaning (WT, HFD and LFD). In this study liver mRNA was examined from two individual mice in each group that were typical of the group phenotype. Microarray results were analyzed by EDGE3 software using Limma analysis, which assesses significance based on ANOVA statistics [23,24]. For n=2 multi-group analyses, only genes with EDGE p<0.01 were considered. In order to make comparisons between the male group microarray analyses and later the female group analyses, the Agilent Technologies platform was redesigned to lower background and extend the response range (Cy3 100-800,000). Cy3 outputs from the two Agilent platforms were compared based on application of equivalent samples to both platforms. Both common liver genes and reference ribosomal protein RNA genes showed a constant conversion factor for Cy3 values between 100-20,000 and a calibrated decline for Cy3 values between 20,000-100,000. The data discussed in this publication have been deposited in NCBI's Gene Expression Omnibus and are accessible through GEO Series accession number GSE53910 (http://www.ncbi.nlm.nih.gov/geo/query/acc.cgi?acc=GSE53910).
Gene response classification
Responsive genes were identified by a fold change of +/- 2 and a p-value<0.05. A cut-off of Cy5>200 to measure binding efficiency was used to minimize false responses. Genes were sorted into 5 clusters according to the effects of diet and Cyp1b1 deletion: Type A: Cyp1b1-ko effects independent of diet; Types B and C: Cyp1b1-ko effects selective to HFD or LFD, respectively; Type HF: effects of HFD, independent of Cyp1b1-ko; Type D: HFD effect reversal in Cyp1b1-ko.
Results
Effects of diet change and Cyp1b1 deletion on adiposity
In order to test whether Cyp1b1 metabolism of endogenous substrates has a role in fatty acid homeostasis, WT and Cyp1b1-ko mice were administered defined diets that were either high in carbohydrate (LFD) or fat (HFD), while maintaining similar caloric content (Fig. 1A) [9]. The HFD mediated increased body weight, which derived from the accumulation of epididymal and inguinal adipose mass in males and females, respectively (Fig. 1B). This DIO was significantly suppressed in Cyp1b1-ko mice compared to WT mice (males p<0.0001; females p=0.03). The decreased gonadal fat correlated with the attenuated body weight gain (R2= 0.85). There was no significant effect of Cyp1b1 deletion on caloric intake or on general growth [9].
Fig. 1. Cyp1b1 deletion prevents diet-induced obesity responses.
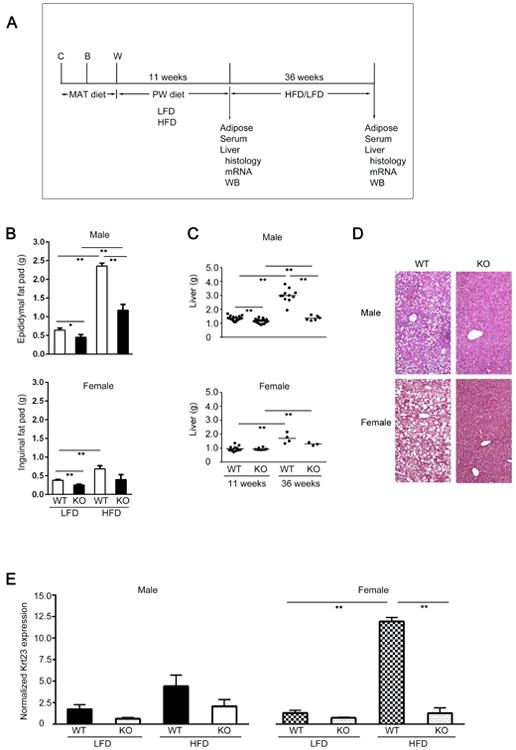
(A) Experimental design depicted male or female mice fed for 11 or 36 weeks (dw11 and dw36, respectively) post-weaning on either a low fat/high carbohydrate (LFD) or a high fat/low carbohydrate (HFD), (C, conception; B, birth; W, weaning/pnd21). For gene expression analyses, mice characterized as close to the mean body weight were used (males n=3, females n=2). (B) Weights of epididymal fat (males) or inguinal fat (females) for WT and Cyp1b1-ko (KO) mice. (C) Increase in liver weight induced by HFD at dw11 and dw36 that is prevented in Cyp1b1-ko mice. (D) H&E stained liver sections for dw11 male WT and Cyp1b1-ko mice and dw36 females, each on the HFD. (E) Normalized suppression of keratin 23 (Krt23). Males are shown at 11 weeks, females at 36 weeks. For panels B, C and E *p<0.05, **p<0.01.
Liver enlargement, derived from lipid droplet accumulation, is associated with steatosis, which typically appears between diet weeks 11 (dw11) and 36 (dw36) on the HFD [25]. This increase in liver mass was prevented in Cyp1b1-ko mice (Fig. 1C). In WT mouse livers, increased lipid droplet accumulation, visualized by lipid ghosts in H&E stained images (Fig. 1D), paralleled the reported increased liver triglyceride measurements [9]. Collectively, the increases in body weight, liver mass and lipid droplets in males after dw11 on the HFD were only slightly less than in females after dw36. This difference arises because DIO in females is delayed by several weeks compared to males [9]. Serum triglyceride levels were scarcely affected by either change, but Cyp1b1 deletion prevented the typical increases in serum cholesterol, glucose, insulin and leptin produced by HFD [9]. Keratin 23 (Krt23), the most sensitive marker of the hepatitis phase of NASH [26], increased gene expression 9-fold in the livers of WT female mice on the HFD, but not in the Cyp1b1-ko animals (Fig. 1E).
Many genes in the male liver respond to both the diet change and to Cyp1b1 deletion
Liver gene expression was examined by microarray at dw11 in male mice in the four treatment groups (WT: LFD and HFD; Cyp1b1-ko: LFD and HFD). We focused on Cyp1b1-ko mice that were representative of those with more highly suppressed adiposity. Individual gene expression is represented as one of four ratios, based on the mean expression values per treatment (Fig. 2A). The WT mice on the LFD (WT/LFD) undergo two comparisons, as the control for Cyp1b1-ko mice on the LFD (expression ratio designated KO/LFD) and for WT mice on the HFD (expression ratio designated WT/HFD). To determine the effect of Cyp1b1-ko on the HFD, they were compared to the WT mice on the HFD (expression ratio designated as KO/HFD).
Fig 2. Effects of Cyp1b1 deletion on liver gene expression in relation to diet.
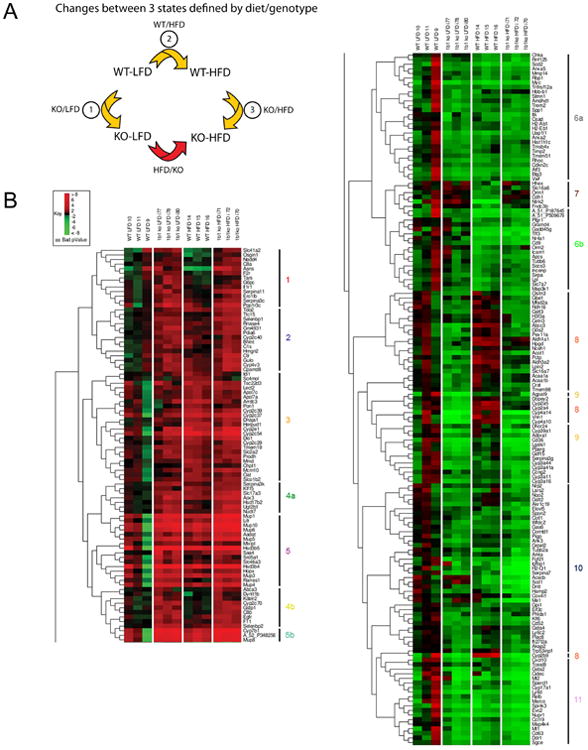
(A) Presentation of gene responses as three distinct ratios representing the interactions of Cyp1b1-ko (KO versus WT) and diet effects (HFD versus LFD). (B) Hierarchical clustering of gene responses (Cy5>2000, FC>2.0) with respect to presence or absence of Cyp1b1 on either the HFD or LFD. Vertical lines designate 11 clusters (Clusters 4, 5, 6, 8, and 9 were subdivided. Genes in each cluster are listed in Table S1).
In Fig. 2B, we present a hierarchical clustering of 240 gene changes that occur for the 12-individual male mice in these four treatment groups (Cy5>2000, FC>2.0, p<0.01). The clustering follows similar patterns when genes with lower expression are examined (Cy5>200). The hierarchical pattern has been divided into 5 stimulation clusters (1-5) and 6 suppression clusters (6-11) (see Supplementary Table 1). The association of Cyps within the same sub-families is apparent. In cluster 3, four Cyp2c forms and Cyp2e are each highly stimulated by the switch from LFD to HFD. In cluster 4, Cyp7b1, two hydroxysteroid dehydrogenase (Hsd3b) forms and seven major urinary proteins (Mups) share strong stimulatory responses to Cyp1b1 deletion. In cluster 9, ten Cyp forms (two 2a forms, Cyp2b9, two 4a forms, four 3a forms and Cyp39) show suppressed expression in Cyp1b1-ko mice on each diet. Cluster 9 also includes PPARγ and several genes that are stimulated by PPARα (Cd36, Lgals and Vnn1). Cluster 11 includes metallothioneins (Mt1 and Mt2) and several other markers of oxidant stress (Gsta2, Cidec/Fsp27 and Ly6d). Their general suppression suggests that oxidative stress is low in Cyp1b1-ko mice compared to the WT mice.
Liver Cyps are highly responsive to diet and Cyp1b1 deletion in males
In male mice, the effect of Cyp1b1 deletion on the liver is most clearly demonstrated by the many changes in Cyp expression. Thus, more Cyps are responsive to Cyp1b1 deletion (18) than to the diet change in the WT mice (5) (Table 1). Cyp4a forms are selectively induced by PPARα-specific ligands, the Cyp2a and Cyp2b forms are stimulated by CAR-specific ligands, while several of the Cyp3a forms are stimulated by PXR-specific ligands [27]. The basal attenuation of these Cyps suggests a shared suppression of the endogenous activation of these receptors in Cyp1b1-ko mice that is independent of dietary fat. By contrast, 15 highly expressed Cyp forms do not respond to either diet or Cyp1b1-ko changes (including six 2d forms, two 2a forms and two 4f forms) (data not shown, see complete array file from GEO Series accession number GSE53910).
Table 1. Responses of liver P450 Cytochrome genes to Cyp1b1 deletion and diet changes.
| LFD-KOa | HFDa | HFD-KOb | |
|---|---|---|---|
| Gene | (KO/WT) | (HFD/LFD) | (KO/WT) |
| Cyp1a2 | 2.5* | 2.1 | 2.2 |
| Cyp2a4 | -5.0** | 2.2* | -2.7** |
| Cyp2a5 | -4.5** | 2.3** | -3.0** |
| Cyp2b13 | -6.6* | 3.5 | -30.3** |
| Cyp2b10 | -1.5 | 4.2 | -12.4* |
| Cyp2b9 | -7.4* | 4.1 | -41.1** |
| Cyp2c29 | 1.6 | 2.2* | n.c. |
| Cyp2c37 | 2.0 | 4.4* | n.c. |
| Cyp2c39 | n.c. | 3.0* | n.c. |
| Cyp2c40 | 2.1* | 1.5 | n.c. |
| Cyp2c54 | 3.5 | 7.4** | n.c. |
| Cyp2c55 | -2.1* | -1.5 | -1.6 |
| Cyp2c70 | 3.0** | n.c. | 2.8** |
| Cyp2e1 | 2.6 | 3.9* | n.c. |
| Cyp3a11 | -2.2* | n.c. | -2.1 |
| Cyp3a16 | -4.0** | -1.8 | -2.6* |
| Cyp3a41a | -4.0** | -1.7 | -2.4* |
| Cyp3a44 | -3.4** | -1.8 | -2.1 |
| Cyp4a10 | -11.7** | 1.7 | -11.2** |
| Cyp4a12 | 2.5 | n.c. | 1.7 |
| Cyp4a14 | -43.4** | n.c. | -66.3** |
| Cyp4a31 | -5.1** | 2.0 | -6.4** |
| Cyp4v3 | 2.2* | 1.7 | 2.0* |
| Cyp7a1 | -2.6 | 2.3 | -1.8 |
| Cyp7b1 | 11.4** | 3.4 | -4.6* |
| Cyp8b1 | 1.5 | 2.1 | n.c. |
| Cyp17a1 | -3.5** | -1.9 | -2.5* |
| Cyp39a1 | -5.7** | n.c. | -9.3** |
Data represents fold change.
Male (n=3) mice were fed the diets for 11 weeks post-weaning.
Expression levels are calculated relative to WT LFD.
Expression levels are calculated relative to WT HFD.
n.c. represents no change (FC<±1.5).
p<0.05,
p<0.01
Division of liver gene responses for Cyp1b1 male mice according to selectivity of diet
Gene expression changes were processed using the Limma algorithm on the Agilent EDGE microarray analysis website to determine fold-change and significance between treatment groups. Limma analysis utilizes a linear model and empirical bayes method for determining significant gene changes in large data sets (microarrays). The Limma algorithm allows for a large number of comparisons and produces reliable expression changes when the number of arrays is small by borrowing information across genes [28]. Criteria were set for fold-change, p-value and Cy5 array binding (FC> 2.0, p<0.05, Cy5>200). Most of these triplicate comparisons met a more stringent criterion (p<0.01). The responses were resolved into five groups based on diet selectivity and Cyp1b1-ko responses after dw11, designated as Groups A, B, C, D and HF. These groups represent changes characterized by Cyp1b1-ko diet independence (A), Cyp1b1-ko HFD selectivity (B), Cyp1b1-ko LFD selectivity (C) and response in WT mice to the diet change but not to Cyp1b1-deletion (HF), respectively. A fifth group represents a reversal of gene expression between WT and Cyp1b1-ko mice on the HFD that is referred to as Group D (Fig. 3A). Therefore, there is a total of 5 Groups designated as Group: A, B, C, D and HF based on diet selectivity and Cyp1b1-ko responses. The inter-relationship of these male groups is diagramed in Fig. 3B. These differences were compared to expression differences seen for the same genes in females at dw36.
Fig. 3. Liver Gene expression changes for selected genes across four treatment combinations.

(A) Scheme depicting Cyp1b1-ko diet sensitive and insensitive designations for Groups A, B, C, D and HF. (B) Division of genes between 5 groups based on diet and Cyp1b1 selectivity. HF genes do not respond to Cyp1b1 deletion. Overlap between HF and groups A and C correspond to genes within these groups that show significant HFD/LFD changes in addition to the Cyp1b1 response.
Cyp genes are distributed across these groups according to their constitutive regulation by lipid-controlled receptors. Group A genes (127 significant genes) exhibit similar Cyp1b1-ko responses on both diets and include many Cyp genes that are regulated by PPARα and PXR. By contrast, Group B genes (99 significant genes) only respond to Cyp1b1 deletion on the HFD and do not contain any Cyp genes. The Group C genes (329 significant genes) only respond to Cyp1b1 deletion on the LFD and only include a few Cyps. Group D genes (20 significant genes) include CAR-regulated Cyp2a and Cyp2b genes and all show significant responses to the diet change in WT mice that are reversed in Cyp1b1-ko mice. Group HF genes (166 significant genes) respond significantly to the HFD in WT mice, but not to Cyp1b1 deletion and include a cluster of Cyp2c and Cyp2e1 genes.
In Fig. 4A, we show typical expression changes for genes that are assigned to Groups A, B, C, D and HF, respectively. Selected genes are presented in Table 2, while the full set of responses for each group is shown in Supplementary Table 2. The acyl CoA transferase, Acot1, typifies Group A genes by showing similarly large decreases on each diet for Cyp1b1-ko mice compared to WT mice. There is no effect of the diet as the magnitude and direction of gene expression is similar between the LFD and HFD in Group A. The Igf1 binding protein, Igfbp1, typifies Group B genes by showing a much larger suppression on the HFD than on the LFD. The transcription factor Klf6 is representative of Type C genes with a substantially lower expression on the LFD in Cyp1b1-ko mice that is not further enhanced by the HFD. Typically for genes in this group, the WT/HFD expression moves in the same direction as Cyp1b1-ko/LFD, suggesting a functional connection. A typical HF gene, such as the transcription factor Nr4a1, shows a pattern that differs from that of Klf6 by showing no suppression in the Cyp1b1-ko mice on the LFD. A typical Group D gene, like the phospholipid hydrolase Cdh1, exhibits a reversal of the WT/HFD response in Cyp1b1-ko mice on the HFD. There are an appreciable number of genes that adopt intermediate expression patterns; we have focused on the statistically significant differences.
Fig 4. Genes representative of Cyp1b1 response Groups: Expression correlations for pairs of gene in individual mice.
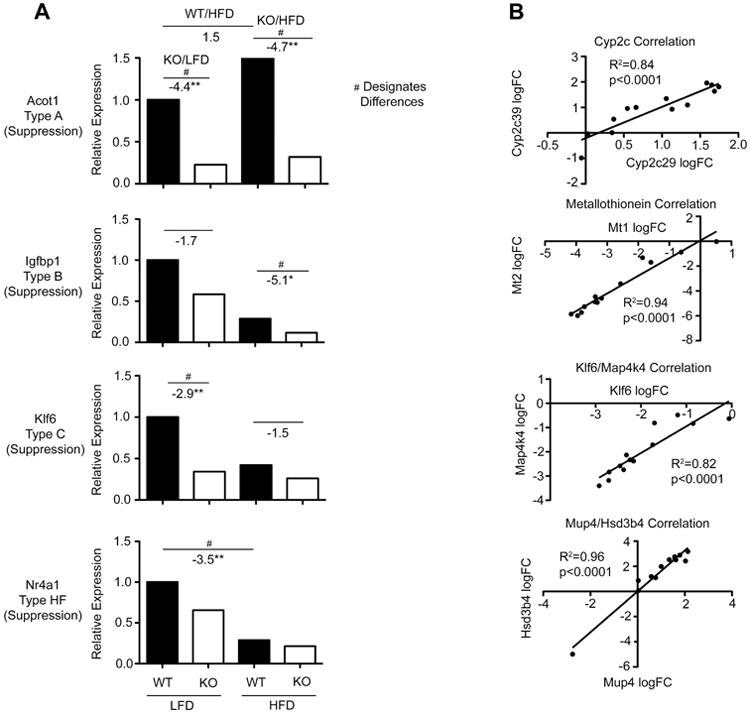
(A) Relative expression levels for each of four treatments combinations for genes typical of Group A (Acot1), B (Igfbp1), C (Klf6) and HF (Nr4a1). (B) Expression of pairs of related genes in same family and different families correlated for the 12 individual mice across the 4 treatment combinations: Cyp2c29/Cyp2c39; Mt1/Mt2; Klf6/Mapk4k4; Hsd3b4/Mup4.
Table 2. Expression of liver genes involved in metabolism divided according to responses to Cyp1b1-ko and diet responses.
| LFD-KOa | HFDa | HFD-KOb | |
|---|---|---|---|
| (KO/WT) | (HFD/LFD) | (KO/WT) | |
| Group A | |||
| Acot1 | -4.4** | 1.5 | -4.7** |
| Acot4 | -2.7** | 1.5 | -3.7** |
| Akr1c19 | -3.0** | n.c. | -2.7** |
| Cd36 | -7.6** | -1.7 | -2.5** |
| Cidec | -4.7 | -1.9 | -4.8 |
| Cyp4a10 | -11.7** | 1.7 | -11.2** |
| Cyp7b1 | 13.0** | 4.0 | 5.0* |
| Egfr | 2.4** | n.c. | 2.6* |
| Enho/Adropin | 2.2 | 2.0 | 3.9 |
| Fgf21 | -3.1* | -2.9* | -2.9* |
| G0s2 | -2.5* | n.c. | -2.6* |
| Gsta2 | -5.6** | -1.8 | -2.8* |
| Gstp1 | 2.1** | n.c. | 3.1** |
| Hamp2 | -2.2* | -1.5 | -5.5** |
| Lgals1 | -4.8** | n.c. | -5.0** |
| Lifr | 4.2** | 2.3* | 3.5** |
| Lpin2 | -1.7 | n.c. | -2.4** |
| Nudt7 | 2.1** | n.c. | 3.1** |
| Mgst3 | -4.7** | n.c. | -4.6** |
| Nqo2 | -2.0* | n.c. | -1.8* |
| Pex11a | -2.4** | n.c. | -2.1* |
| Plin4 | -3.5* | n.c. | -5.5* |
| Pparg | -4.5** | n.c. | -4.6** |
| Ppp1r3c | 3.8* | 1.6 | 2.4 |
| Ppp1r3g | -4.6* | -2.4 | -5.9** |
| Selenbp1 | 2.4** | n.c. | 2.5** |
| Vldlr | -9.1** | n.c. | -2.5* |
| Vnn1 | -10.0** | 2.3 | -6.8** |
| Group B | |||
| Elovl5 | n.c. | -1.7 | -2.2* |
| Igfbp1 | -1.7 | -3.5 | -5.1* |
| Me1 | n.c. | -1.7 | -7.5** |
| Osgin1 | 1.5 | -1.5 | 2.7* |
| Pdk4 | -2.0 | -3.1* | -3.7** |
| Scd1 | n.c. | -3.9* | -6.0** |
| Socs2 | 1.5 | -2.7 | 5.0* |
| Group C | |||
| Ccl2 | -3.5* | -3.1* | -1.8 |
| Cd34 | -2.5* | -2.7* | -1.5 |
| Gas6 | -2.2** | -2.2** | -1.6** |
| Hes6 | 1.9** | n.c. | 2.1 |
| Hsd3b5 | 15.3* | 6.6 | 2.3 |
| Klf6 | -2.9** | -2.4** | -1.5 |
| Map4k4 | -3.2** | -2.8** | -1.8 |
| Mup3 | 4.7* | 3.4 | 1.5 |
| Nupr1 | -5.1** | -5.5** | n.c. |
| Slco1a1 | 5.2* | 4.2 | 1.7 |
| Spp1 | -2.6* | -2.0 | n.c. |
| Group D | |||
| Abcc3 | -3.2** | 2.4 | -5.5** |
| Aldh1a1 | -1.8* | 3.1* | -1.7 |
| Aldh3a2 | -2.6** | 2.4* | -2.4** |
| Asns | 1.8 | -3.1* | 11.2** |
| Cdh1 | n.c. | -2.5** | 2.8** |
| Cyp2a4 | -5.0** | 2.2* | -2.7** |
| Cyp2b13 | -6.6* | 3.5 | -30.3** |
| Cyp2b9 | -7.4* | 4.0 | -41.1** |
| Hpgd | n.c. | 2.5** | -2.5** |
| Ntrk2 | 1.6 | -14.6** | 13.5** |
| Rgs16 | 5.0 | 15.0* | -16.0* |
| Group HF | |||
| Acacb | n.c. | -3.2* | -1.9 |
| Cyp2c29 | 1.6 | 2.2* | n.c. |
| Cyp2c37 | n.c. | 4.1* | n.c. |
| Cyp2c39 | n.c. | 2.9* | n.c. |
| Cyp2c54 | 3.48 | 7.41** | n.c. |
| Gadd45g | n.c. | -3.9** | -1.5 |
| Icam1 | n.c. | -3.6* | 1.8 |
| Lpl | -1.5 | -3.3* | 1.5 |
| Nr0b2/Shp | n.c. | 2.4** | n.c. |
| Nr4a1/Nurr77 | n.c. | -3.5** | n.c. |
| Nr1i3/CAR | n.c. | 3.0* | -1.5 |
| Rbp1 | n.c. | -2.3* | n.c. |
| Relb | -1.8 | -3.0** | n.c. |
| Scd2 | -2.3 | -4.5* | n.c. |
| Slco1b2 | 1.5 | 2.5* | n.c. |
| Sult1b1 | n.c. | 3.0** | n.c. |
| Tubb2a | n.c. | -2.8* | n.c. |
Data represents fold change.
Male (n=3) mice were fed the diets for 11 weeks post-weaning.
Expression levels are calculated relative to WT LFD.
Expression levels are calculated relative to WT HFD.
n.c. represents no change (FC<±1.5).
p<0.05,
p<0.01
Genes within the same sub-families exhibit highly correlated expression changes for the individual mice across the four treatments (Fig. 4B). This is particularly evident for several Cyp sub-families (Cyp2a4/Cyp2a5 R2=0.94; Cyp4a10/Cyp4a14 R2=0.82; Cyp2b9/Cyp2b13 R2=0.95; Cyp2c29/Cyp2c39 R2=0.84), the five Mup forms and six 3β-hydroxysteroid dehydrogenases (Hsd3b) (Mup3/Mup4 R2=0.97; Hsd3b4/Hsd3b5 R2=0.97).
A DAVID Gene Ontology analysis provided insight into functional linkages within each group. We focused on the pathways with the highest enrichment (Supplementary Table 3) [29, 30]. The most prominent effects featured Cyps found in three of the groups, as noted above. We have, however, identified appreciable additional mechanistic coherence within these various groups that validates the assignments. Select gene functions are summarized in Supplementary Table 4. The distinctive functional features of genes within each group are discussed below. The above sorting is based on male gene expression. Each gene group has a different pattern of conservation in female mice, which will be addressed.
Cyp1b1-sensitive genes in Groups A and B control energy homeostasis in different ways
In males, many genes that respond to Cyp1b1 deletion similarly on each diet (Group A) are regulated by PPARα. Several of these genes may contribute to the loss of liver lipid droplets [31]. These include suppressions of CD36, Perilipin/Plin 4, G0S2, Cidec and Vldl receptors. Thus, CD36 and Vldlr mediate uptake of fatty acids and lipoproteins, respectively, while Plin4 and Cidec coat lipid droplets and G0S2 inhibits triglyceride lipases [32-35]. PPARγ promotes triglyceride synthesis [36] and is also extensively suppressed in Group A. Over 30 responses to the PPARα stimulant, WY-14643, in male mice corresponds to reverse constitutive changes in Cyp1b1-ko mice [9]. These 30 genes include three that contribute to peroxisome function (Acot1, Nudt7 and Pex11a) and three Cyp4a forms [9]. Thus, Cyp1b1-ko in some way prevents a normal constitutive PPARα activation in these ad libitum fed mice. Additionally, two highly expressed hepatocyte plasma membrane receptors for EGF and LIF along with adropin, a novel-circulating regulator of fat metabolism [37], exhibit diet-independent stimulation. Cyp7b1 and the bile acid transporter, Slco1a1, which contribute to bile acid regulation, are also stimulated in Cyp1b1-ko mice (Tables 1 and 2, respectively). Elevation of the phosphatase stimulant, Ppp1r3c, and the decline in the corresponding inhibitor, Ppp1r3g [38], in male Cyp1b1-ko livers are compatible with the observed increased glycogen synthesis that we have reported previously [9].
Several genes that respond to the HFD further decline in the male Cyp1b1-ko mice on the HFD (Group B) and divert fatty acid metabolism away from triglyceride storage and into mitochondrial oxidation. These include stearoyl-CoA desaturase 1 (Scd1), pyruvate decarboxylase kinase regulatory subunit 4 (Pdk4) and malate enzyme (Me1) [39]. The suppression of these genes are further reduced in Cyp1b1-ko mice compared to WT mice on the HFD.
The array and qPCR measurements were closely correlated between individual mice across the four treatments for three genes (PPARγ: R2=0.61, Cd36: R2=0.86, Scd1: R2=0.40). The decreased expression of these key genes in Cyp1b1-ko livers was maintained in qPCR determinations of all available mice in the four treatment groups [9].
Group C responses in Cyp1b1-ko mice link to inflammation or male sexual dimorphism
Group C genes that respond selectively to Cyp1b1 deletion on the LFD exhibit two notable subgroups. About 30 percent of the Group C genes exhibit parallel Cyp1b1-ko/LFD and WT/HFD responses (Fig. 3B, Table 3). Selection of genes from group C based on this dual response, predominantly identified suppression of gene expression associated with either oxidative stress or an inflammatory response, including markers of contributing hematopoietic cells. Decreases in stress and inflammation signaling in Cyp1b1-ko mice on the LFD are indicated by two transcription factors (Nupr1/p8 and Klf6), a set of chemokines (Ccl2, Spp1 and Gas6), the stem cell marker Cd34, the monocyte marker Cd14 and the lymphocyte marker Ly6d.
Table 3. Group C/HF genes.
| Gene | WT HFD/ LFD | (KO/WT) LFD |
|---|---|---|
| Anxa5 | -2.3* | -2.4* |
| Aox3 | 2.4** | 3.1** |
| Atf3 | -3.1* | -2.9* |
| Bhmt | 1.9* | 2.1** |
| Btg2 | -3.0* | -2.7* |
| Btg3 | -3.0* | -3.5* |
| Ccl2 | -3.1* | -3.5* |
| Cd14 | -3.2* | -3.0* |
| Cd34 | -2.7* | -2.5* |
| Cd52 | -1.9** | -2.7** |
| Cd63 | -2.6* | -3.1* |
| Cgref1 | -2.7* | -3.0** |
| Cx3cl1 | -2.7* | -2.6* |
| Cxadr | -2.5* | -3.0** |
| Ddr1 | -2.9* | -3.6* |
| Dio1 | 2.6** | 2.1** |
| Gas6 | -2.2** | -2.1** |
| H2-Ab1 | -1.5 | -2.0** |
| Hist1h1c | -1.9 | -2.5* |
| Il17rb | -2.0* | -2.8** |
| Itk | -2.2 | -2.8* |
| Klf6 | -2.4** | -2.9** |
| Ly6d | -4.3** | -6.1** |
| Map4k4 | -2.8** | -3.2** |
| Mgp | -2.2* | -3.5** |
| Mmd2 | -4.6** | -3.9** |
| Myc | -5.6* | -4.4* |
| Nupr1 | -5.5** | -5.1** |
| Prodh | 1.9* | 2.2* |
| Pvr | -2.3* | -2.5* |
| Renbp | -2.4** | -2.3** |
| Rhoc | -2.5** | -2.8** |
| Sgce | -2.1** | -2.6** |
| Sirpa | -2.1* | -2.0* |
| Slc17a3 | 2.1** | 2.7** |
| Spp1 | -2.0 | -2.6* |
| Stmn1 | -2.0 | -2.6* |
| Uap1l1 | -3.5** | -3.5* |
| Vwf | -2.0 | -2.5* |
| Fgf21 | -2.9* | -3.1* |
Data represents fold change.
Male (n=3) mice were fed the diets for 11 weeks post-weaning.
Expression levels are calculated relative to WT LFD.
n.c. represents no change (FC<±1.5).
p<0.05,
p<0.01
Group C also captures increased expression of six Hsd3b genes and nine Mups in Cyp1b1-ko mice. Each also shows increased expression in the HFD compared to the LFD in both WT and Cyp1b1-ko mice. These genes exhibit closely correlated expression in the individual mice across the treatment groups, which is also highlighted by the hierarchical clustering in Fig. 2B. Thus, Hsd3b4 expression correlates closely with other genes in cluster 5, including Mup4 (R2=0.96, Fig. 4B), Cyp7b1 (R2=0.77) and Slco1a1 (R2=0.83). These genes each exhibit strong male selectivity in their expression.
HF Genes respond to the HFD in WT mice and Cyp1b1-ko mice
The Group HF genes for WT males (dw11) show significant differences in expression between LFD and HFD, but are distinguished by their insensitivity to Cyp1b1 deletion. This group is comprised of 166 genes (Supplemental Table 4). The HFD decreases expression of nuclear factors Nur77/Nr4a1 [40], and Gadd45g [41], but increases Nr0b2/Shp, a direct suppressor of Hnf4α [42], and the CAR receptor (NR1i3) (Table 2). This HF Group also includes stimulation of a set of Cyp2c genes: 2c29, 2c37, 2c39 and 2c54 (Table 2). These HF responses were also dependent on the age of the mice, as they are largely absent in male livers at dw5, prior to the onset of the HFD-induced obesity.
The HF change represents a difference between a high carbohydrate diet and a high fat diet. The ad libitum feeding and morning sacrifice of the mice suggests that the LFD/high carbohydrate diet may deliver a post-prandial glucose stimulus, which has been reported to cause liver inflammation and oxidative stress [43]. Thus, the HFD/LFD gene differences relating to inflammation and oxidative stress most likely correspond to an increased glucose inflammatory response on the LFD. Similarly, the parallel expression change seen for the combination of Cyp1b1-ko mice with this diet corresponds to an anti-inflammatory reversal of this post-prandial response.
Gene responses to HFD and Cyp1b1-ko in dw36 females
Due to the delayed onset of obesity in females, lipid droplet accumulation after dw36 on the HFD resembles that of males at dw11. The dw36 Cyp1b1-ko females also exhibit suppression of DIO relative to their WT counterparts (Fig. 1B and 1C). A modest proportion of responses of dw11 Cyp1b1-ko males are retained in females at dw36, corresponding to each of the diet-based groups (Table 4). In addition to inflammatory markers, there are notable conserved responses relating to lipid homeostasis. These Group A genes include increases in Cyp7b1, the adipose suppressor, adropin/Enho, EGFR and LIFR, with shared decreases in steatosis stimulants Cd36, Lgals1, Aim1l, Plin 4 and G0S2. The Group B suppressions of Scd1 and Elovl5 and serum regulator Igfbp1 are notable conserved changes. However, the extensive suppressions among Cyps linked to PPARα, CAR and PXR in male Cyp1b1-ko mice are essentially absent in the females (Supplementary Tables 2 and 6).
Table 4. Female dw36 conserved genes.
| LFD-KOa | WTa | HFD-KOb | |
|---|---|---|---|
| (KO/WT) | (HFD/LFD) | (KO/WT) | |
| Group A | |||
| Cyp7b1 | 3.2 | 1.7 | 2.8 |
| Enho | 6.8 | 2.7 | 4.0 |
| Egfr | 3.3 | -2.0 | 4.4 |
| Lifr | 2.4 | n.c. | 3.8 |
| F11 | 2.9 | 1.4 | 2.2 |
| Serpina3k | 2.5 | n.c. | 1.9 |
| Cd36 | -4.1 | 1.4 | -4.9 |
| Lgals1 | -2.8 | 2.1 | -3.9 |
| Aim1l | -5.9 | n.c. | -3.1 |
| Cxcl10 | -3.2 | n.c. | -2.3 |
| Cxcl9 | -2.2 | n.c. | -2.9 |
| Plin4 | -2.8 | 3.4 | -2.3 |
| G0s2 | -2.3 | n.c. | -1.8 |
| Tiam2 | -6.5 | -1.5 | -3.3 |
| Serpina7 | -2.8 | -3.1 | -2.4 |
| Group B | |||
| Scd1 | -1.4 | -4.7 | -2.3 |
| Elovl5 | n.c. | -1.4 | -1.7 |
| Igfbp1 | 1.3 | -4.3 | -2.9 |
| Me1 | -1.6 | -6.2 | -1.8 |
| Group C | |||
| Saa4 | 3.4 | n.c. | 1.6 |
| Hsd3b5 | -2.7 | n.c. | n.c. |
| H2-Ab1 | 5.2 | n.c. | n.c. |
| Ly6d | -5.2 | -1.8 | -2.4 |
| Nupr1 | -2.8 | -3.7 | n.c. |
| Cd34 | -2.2 | -3.3 | 2.3 |
Data represents fold change.
Female (n=2) mice were fed the diets for 36 weeks post-weaning.
Expression levels are calculated relative to WT LFD.
Expression levels are calculated relative to WT HFD.
n.c. represents no change (FC<±1.5).
Interestingly, the HF responses that are independent of Cyp1b1-ko, as well as the Group C responses that are matched by HFD/LFD changes, are each substantially conserved in the females (Table 5). About 60 percent of the responses to the HFD are conserved in females at dw36, including: Aldh1a1, Gpi1, Cd9, Cyp2c54, Gadd45g and Nr1i3. For the Group C/HF parallel responses, 18 exhibited similar responses, most notably inflammatory markers Ly6d, Cd34, Nupr1, and Btg3 (Table 5). The match in HF genes between males at dw11 and females at dw36 validates the DIO timing discrepancy used for the older females. As in males, these responses are age dependent.
Table 5. Male dw11 HF genes-conservation in female dw 36 mice.
| Stimulation | ||
|---|---|---|
| HFD/LFD | ||
| Gene | WT Male dw 11 | WT Female dw 36 |
| Aldh1a1 | 2.0 | 2.9 |
| Apol7a | 2.1 | n.c. |
| Arrdc3 | 3.5 | 2.1 |
| Car8 | 2.5 | n.c. |
| Chpt1 | 2.1 | 1.6 |
| Cyp2c54 | 7.4 | 2.3 |
| Cyp2e1 | 3.9 | 1.7 |
| Cyp51 | 2.1 | -1.6 |
| Dars | 2.0 | n.c. |
| Dbp | 3.7 | 87.0 |
| Dnaja1 | 2.3 | -1.7 |
| Herpud1 | 3.4 | 1.7 |
| Hmgcs1 | 2.2 | -2.0 |
| Hpgd | 2.0 | 1.5 |
| Nrli3 | 3.0 | 1.5 |
| Oat | 2.2 | 2.2 |
| Suppression | ||
| HFD/LFD | ||
| Gene | WT Male dw 11 | WT Female dw 36 |
| Acacb | -3.2 | -1.9 |
| Apcs | -2.4 | -2.1 |
| Arhgef16 | -3.1 | -2.3 |
| Btg3 | -3.0 | -3.1 |
| Capg | -2.0 | n.c. |
| Car2 | -2.2 | -2.5 |
| Cd34 | -2.7 | -3.3 |
| Cdt1 | -2.2 | 1.5 |
| Cd9 | -4.3 | -6.6 |
| Cdkn3c | -2.0 | n.c. |
| Cdt1 | -2.2 | +1.5 |
| Chka | -2.5 | -10.7 |
| Cotl1 | -2.0 | -1.8 |
| Fndc3b | -2.5 | -2.5 |
| Gadd45g | -4.8 | -3.4 |
| Gpi1 | -2.0 | -3.7 |
| Gram24 | -2.4 | -2.1 |
| Icam1 | -3.1 | n.c. |
| Igh-Vj | -6.1 | -3.2 |
| Lpl | -3.3 | -1.8 |
| Ly6d | -4.3 | -1.8 |
| Nr4a1 | -3.5 | n.c. |
| Nupr1 | -5.5 | -3.7 |
| Rbp1 | -2.5 | -1.9 |
| Scd2 | -4.5 | -7.9 |
| Socs3 | -2.1 | -1.4 |
| Tff3 | -6.4 | -3.6 |
| Tmem51 | -2.4 | -2.0 |
| Slc6a8 | -3.0 | -2.8 |
| Slc7a7 | -2.4 | -2.7 |
Data represents fold change.
Male (n=3) mice were fed the diets for 11 weeks post-weaning.
Female (n=2) mice were fed the diets for 36 weeks post-weaning.
Expression levels are calculated relative to WT LFD males and females, respectively.
n.c. represents no change (FC<±1.5).
The female livers at dw36 exhibit multiple changes due to the switch from LFD to HFD that are paralleled in Cyp1b1-ko mice on the LFD (Table 6). These HFD-induce gene changes are not seen in females at dw11, thus confirming the need to adjust to the later response period in females. A reversal of gene expression corresponding to the Group D designation in males is much more common in comparing WT and Cyp1b1-ko dw36 females. The most striking HFD response of this type is the steatohepatitis marker, Krt 23 (Fig. 1E) [26]. Six other contributors to hepatitis-associated inflammation include soluble epoxide hydrolase (Ephx1), serum amyloid1 (Saa1), inhibin E (Inhbe), glypican 1 (Gpc1), Slc25a47/Hdmcp and Gsta1 (Table 7).
Table 6. Group C/HF genes compared between dw11 males and dw36 females.
| Gene | Male HFD/ LFD | Male (KO/WT) LFD | Female HFD/ LFD | Female (KO/WT) LFD |
|---|---|---|---|---|
| Anxa5 | -2.3* | -2.4* | ||
| Aox3 | 2.4** | 3.1** | 3.0 | 1.8 |
| Atf3 | -3.1* | -2.9* | -1.6 | -1.7 |
| Bhmt | 1.9* | 2.1** | ||
| Btg2 | -3.0* | -2.7* | -1.4 | -1.6 |
| Btg3 | -3.0* | -3.5* | -3.1 | -2.3 |
| Ccl2 | -3.1* | -3.5* | ||
| Cd14 | -3.2* | -3.0* | ||
| Cd34 | -2.7* | -2.5* | -3.3 | -2.2 |
| Cd52 | -1.9** | -2.7** | -1.3 | -2.8 |
| Cd63 | -2.6* | -3.1* | -1.3 | -1.4 |
| Cgref1 | -2.7* | -3.0** | ||
| Cx3cl1 | -2.7* | -2.6* | ||
| Cxadr | -2.5* | -3.0** | -2.0 | -1.4 |
| Ddr1 | -2.9* | -3.6* | -2.0 | -1.4 |
| Dio1 | 2.6** | 2.1** | 1.6 | 1.4 |
| Gas6 | -2.2** | -2.1** | -1.4 | -1.6 |
| H2-Ab1 | -1.5 | -2.0** | -1.2 | -2.7 |
| H2-Dmb1 | -1.4* | -2.2** | -1.2 | -1.8 |
| Hist1h1c | -1.9 | -2.5* | ||
| Hsd3b3 | 2.0** | 2.3** | ||
| Il17rb | -2.0* | -2.8** | ||
| Il33 | -1.9 | -2.7* | ||
| Itk | -2.2 | -2.8* | ||
| Klf6 | -2.4** | -2.9** | ||
| Ly6d | -4.3** | -6.1** | -1.8 | -5.3 |
| Map4k4 | -2.8** | -3.2** | -2.0 | -1.3 |
| Mgp | -2.2* | -3.5** | -1.3 | -1.5 |
| Mmd2 | -4.6** | -3.9** | n.c. | -2.1 |
| Mup1 | 3.8 | 7.5** | ||
| Myc | -5.6* | -4.4* | ||
| Npr2 | 2.3* | 2.2* | ||
| Nupr1 | -5.5** | -5.1** | -3.7 | -2.8 |
| Prodh | 1.9* | 2.2* | ||
| Pvr | -2.3* | -2.5* | ||
| Renbp | -2.4** | -2.3** | ||
| Rhoc | -2.5** | -2.8** | ||
| Sgce | -2.1** | -2.6** | -2.6 | -1.4 |
| Sirpa | -2.1* | -2.0* | n.c. | -1.6 |
| Slc17a3 | 2.1** | 2.7** | ||
| Slc2a2 | 2.0* | 2.1* | ||
| Spp1 | -2.0 | -2.6* | ||
| Stmn1 | -2.0 | -2.6* | ||
| Tmem19 | 1.8* | 2.4** | ||
| Uap1l1 | -3.5** | -3.5* | ||
| Vwf | -2.0 | -2.5* | ||
| Fgf21 | -2.9* | -3.1* | ||
| Lifr | 2.2* | 4.7** | ||
| S100a4 | -2.1** | -2.1** |
Data represents fold change.
Male (n=3) mice were fed the diets for 11 weeks post-weaning,
p<0.05,
p<0.01.
Female (n=2) mice were fed the diets for 36 weeks post-weaning.
Expression levels are calculated relative to WT LFD males and females, respectively.
n.c. represents no change (FC<±1.5).
Table 7. Female dw36 responses to HFD typically reversed by Cyp1b1-ko.
| LFD-KOa | WTa | HFD-KOb | |
|---|---|---|---|
| (KO/WT) | (HFD/LFD) | (KO/WT) | |
| OxS/ Inflammation | |||
| Krt 23 | n.c. | 9.1 | -5.0 |
| Gsta1 | -1.7 | 3.2 | -4.0 |
| Gpc1 | n.c. | 4.4 | -2.5 |
| Slc25a47 | 2.3 | 4.2 | -2.4 |
| Inhbe | 1.7 | 3.8 | -1.7 |
| Ephx1 | 1.3 | 3.1 | -2.3 |
| Saa1 | -2.4 | 2.6 | -2.2 |
| PPARα | |||
| Ppara | 2.2 | 3.2 | n.c. |
| Vnn1 | -1.4 | 2.9 | -2.8 |
| Angptl4 | 6.6 | 9.5 | -1.7 |
| Cyp4a10 | 1.9 | 5.4 | -1.5 |
| Acot1 | 3.6 | 5.1 | -1.7 |
| Aox1 | 1.6 | 2.7 | -1.8 |
| Cpt1a | 2.1 | 3.7 | -1.4 |
| FA-Oxidation | |||
| Fitm1 | n.c. | 7.9 | -4.2 |
| Hmgcs2 | 1.4 | 2.6 | -2.0 |
| Ech1 | n.c. | 2.6 | -1.6 |
| Lipid Synthesis | |||
| Pparγ | n.c. | 2.2 | -2.4 |
| Hes6 | -1.9 | -4.2 | 2.8 |
| Cholesterol | |||
| Aacs | -1.6 | -6.4 | 2.3 |
| Fdps | n.c. | -4.5 | 2.1 |
| Sqle | n.c. | 4.2 | 2.6 |
| Mvd | n.c. | -3.5 | 1.9 |
| Hmgcr | n.c. | -3.5 | 1.9 |
| Fatty Acid Synthesis | |||
| Elovl6 | -2.5 | -14.9 | n.c. |
| Acacb | n.c. | -4.6 | 1.7 |
| Fasn | -2.3 | -11.1 | n.c. |
| Scd1 | -1.4 | -4.1 | -2.3 |
| Pdk4 | -1.9 | -3.3 | -1.5 |
| Me1 | -2.3 | -6.2 | -1.6 |
| Fabp4 | -3.5 | -2.8 | 1.7 |
Data represents fold change.
Female (n=2) mice were fed the diets for 36 weeks post-weaning.
Expression levels are calculated relative to WT LFD.
Expression levels are calculated relative to WT HFD.
n.c. represents no change (FC<±1.5).
The five cholesterol synthesis genes are each suppressed by the HFD in WT females, but the changes are reversed in Cyp1b1-ko mice. These are representative of responses seen for each of the fourteen genes in this pathway that share regulation by Srebp2. Cholesterol biosynthesis genes are not affected in males at dw11. Table 7 also shows three genes associated with fatty acid synthesis (Scd1, Pdk4 and Me1) that have much lower expression on the HFD, but are not further suppressed when Cyp1b1-deletion is combined with this diet. However, in dw11 HFD fed males, Cyp1b1 deficiency enhances the suppression of these genes (Table 2). In females, the HFD suppression is greater and the Cyp1b1-ko affects less.
Another notable difference in the dw36 females is that PPARα is stimulated in WT mice by the change to HFD, which is not seen in dw11 WT males. Cyp1b1-ko dw36 females on the LFD, but not the HFD, share this PPARα target gene stimulation. Several PPARα target genes associated with fatty acid oxidation (Acot1, Aox1, Aox3, Cpt1a, Cyp4a10 and Cyp4a14) also show this stimulatory response pattern. PPARα-regulated genes Fitm1 (controls lipid droplet morphology) and Angptl4 (inflammatory marker) also follow this pattern of stimulation. The dw11 males exhibit suppression of PPARα target gene expression, without any change in PPARα expression.
Linkage of Cyp1b1 deletion to enhanced Hnf4α activation and dimorphic GH signaling
Many of the genes that respond to Cyp1b1 deletion in Group A also exhibit sexual dimorphism in their liver gene expression. This dimorphism derives from male/female differences in the temporal profile of serum GH and the associated signaling to HNF4α [13,44] (Figure 5A). Responses in male Cyp1b1-ko mice frequently reverse the effects seen in liver-specific Hnf4α knockout (Hnfα-ko) mice [15] (Table 8). Comparison of Cyp1b1-ko microarray expression with the previous liver Hnfα-ko expression data indicates an inverse relationship, depicted in Fig. 5B. Hnf4α deletion lowers Cyp7b1, Egfr, Hsd3b forms, and Mup1 and Mup2 genes, which are each stimulated in Cyp1b1-ko mice. The male selective expression of these genes derives from their greater stimulation by Hnf4α in males [13]. Genes that are induced by the PPARα agonist, WY-14,643, and decreased in Cyp1b1-ko mice include: Acot3, Cd36, Vnn1, Serpina7 and Marco [9]. Each of those PPARα target genes is increased in the liver of Hnfα-ko mice (Table 8).
Figure 5. Growth hormone and HNF4α modulate gene expression accounts for most Group A Cyp1b1 responses.
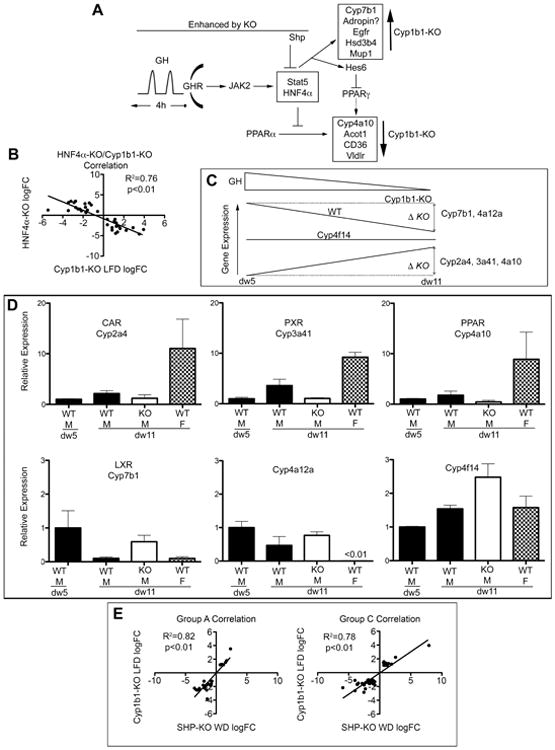
(A) Growth hormone (GH) signaling integrated regulation of Nr0b2/Shp, HNF4α and PPARα-responsive genes showed a Cyp1b1-ko effect. (B) HNF4α-ko liver gene expression derived from ref 15 inversely correlates with Cyp1b1-ko responses from Group A genes (average from three mice per gene, represented as log base 2 FC). (C) As GH decreased with maturity, WT (solid line) gene expression decreased (Cyp7b1 and Cyp4a12a) or increased (Cyp2a4, 3a41, 4a10) between diet week (dw) 5 and dw11. Cyp1b1-ko (KO) prevents this change to produce observed Cyp1b1-ko differential expression relative to WT (ΔKO). (D) CAR, PXR, and PPAR-responsive Cyps display increased expression from dw5 to dw11 that was prevented in Cyp1b1-KO. Cyp7b1 and Cyp4a12a exhibit a decrease from dw5 to dw11, which is prevented by Cyp1b1-ko. Female expression is higher for the first three, male expression for the remaining pair. Cyp4f14 is unaffected by Cyp1b1 or diet at either dw5 or dw11. (E) Reported expression changes produced in Shp-ko mice [ref 42] correlate with multiple Cyp1b1-ko changes in both Group A and Group C.
Table 8. Responses to HNF4α deletion compared to effects of Cyp1b1 deletion.
| Gene Symbol | KO LFDa | HNF4α-KO[15]b |
|---|---|---|
| Acot3 | -10.7** | 8.9** |
| C8b | 2.9** | -6.5** |
| C9 | 2.3** | -21.6** |
| Cd36 | -6.7** | 10.9** |
| Cidec | -4.7 | -1.3** |
| Cyp17a1 | -3.4** | 3.9** |
| Cyp2a4 | -5.0** | 2.8** |
| Cyp2a5 | -4.5** | 2.1** |
| Cyp2b10 | -1.5 | 1.9** |
| Cyp2b13 | -6.6* | 3.7** |
| Cyp2b9 | -7.4* | 8.5** |
| Cyp2c40 | 1.3 | -2.0** |
| Cyp39a1 | -5.7** | 2.9** |
| Cyp4a14 | -43.4** | 2.4** |
| Cyp7a1 | -2.6 | -1.2* |
| Cyp7b1 | 11.4** | -23.7** |
| Cyp8b1 | 1.5 | 11.3** |
| Egfr | 3.1 | -9.3** |
| Gdf15 | -3.3** | 1.6** |
| GhR | 1.3 | -5.0** |
| Hamp2 | -2.3* | 5.7** |
| Hsd17b2 | 2.1** | -2.7** |
| Hsd3b2 | 1.8* | -12.4** |
| Hsd3b5 | 15.4* | -11.1** |
| Marco | -3.0 | 2.4** |
| Mug2 | 1.8* | -8.1** |
| Mup1 | 7.5** | -8.1** |
| Mup3 | 1.8 | 37.6** |
| Mup4 | 4.7* | -12.7** |
| Nudt7 | 2.4** | -6.5** |
| Prodh | 2.2* | -2.0** |
| Rarres1 | 2.6** | -17.1** |
| Selenbp1 | 2.4** | -3.7** |
| Serpina7 | -3.5** | 7.1** |
| Spp1 | -2.6* | 8.0** |
| Vldlr | -9.1** | 10.7** |
| Vnn1 | -10.9** | 2.2** |
These previously reported studies of the GH/Hnf4a dimorphic signaling were completed at dw5 (13,43). The reported expression differences between male- and female-selective genes seen on the LFD at dw5 are substantially attenuated 6 weeks later. Female-selective genes that are suppressed at dw5 exhibit large increases in expression at dw11 compared to reference genes. Male selective genes that are elevated at dw5 exhibit decreases at dw11 compared to reference genes. Five Cyps follow this response and are sexually dimorphic at dw5: male selective Cyp7b1 and Cyp4a12 and female selective Cyp2a4, Cyp3a41 and Cyp4a10 (Fig. 5C). This pattern of change extends to other Cyp4a, Cyp3a and Cyp2a forms. Cyp4f14 is representative of a Cyp that is highly expressed, but insensitive to these changes. In Cyp1b1-ko mice, these maturation changes in liver Cyp expression are largely prevented. Thus, the Cyp1b1-ko mice at dw11 retain expression at the dw5 levels (Fig. 5D). For example, male selective Hnf4α-promoted Cyp7b1 expression declines in WT mice but not in Cyp1b1-ko mice. This developmental intervention explains why so many Cyp1b1-ko expression differences at dw11, relative to WT, are inversely proportional to the effect of Hnf4α deletion at dw5 (Fig. 5B) The gene changes in Cyp1b1-ko mice that we have linked to loss of constitutive PPARα regulation [9] are similarly caused by this attenuation of GH/HNF4α activity in the liver between dw5 and dw11. This expression transition for GH/Hnf4α-regulated genes between dw5 and dw11 in male mice also diminishes their apparent sexual dimorphism at dw11, while it is maintained in Cyp1b1-ko mice.
Cyp1b1 deletion linkage to Small Heterodimeric Partner (Shp)
Many of the gene changes in Cyp1b1-ko mice also overlap with responses to deletion of Nr0b2/Shp, which also suppresses obesity [42]. This nuclear factor heterodimerizes with HNF4α and suppresses the activity. A recent report shows that Shp deletion in male mice produces over 1000 changes in liver gene expression [42]. Based on the relationship between Shp and Hnf4α, we compared the microarrays of these gene expression changes with those produced in dw11 male Cyp1b1-ko mice. We found that 80 gene changes in Shp-ko mice matched changes in the same genes produced by Cyp1b1-ko (27 Group A, 5 Group B and 52 Group C genes (Table 9). The magnitude of the Cyp1b1-ko- and Shp-ko- [42] induced changes from these separate studies are highly correlated (R2=0.78 p<0.001, Fig. 5E). The Shp-ko matches to Group A genes, in most cases, relate inversely to the effects of Hnf4α deletion. The overlap with Group C genes includes 17 markers indicative of inflammation and oxidative stress (Table 9).
Table 9. Responses to SHP deletion compared to effects of Cyp1b1 deletion.
| SHP-KO | Cyp1b1-KO Malea | Cyp1b1-KO Femaleb | |||
|---|---|---|---|---|---|
| Gene Symbol | WD FC[42]e | LFD FCc | HFD FCd | LFD FCc | HFD FCd |
| Type A | |||||
| Ccl4 | -9.5** | -5.5** | -2.4* | -2.2 | 1.0 |
| Ubd | -8.5* | -5.8** | -5.0** | -2 | -1.1 |
| Gsta2 | -6.7** | -5.6** | -2.8* | -1.2 | -3.1 |
| Serpina7 | -4.4** | -3.5** | -9.4** | -1.9 | -1.6 |
| Mgst3 | -3.7** | -4.7** | -3.1** | -1.5 | -1.5 |
| Cxcl10 | -3.5** | -3.8* | -3.6* | -2.4 | -1.5 |
| Pparg | -3.1** | -4.5** | -4.6** | -1.3 | -2.2 |
| Lgals1 | -2.9** | -5.8** | -5.2** | -2.8 | -3.9 |
| Gdf15 | -2.9** | -3.3** | -2.9* | -4 | -1.8 |
| Fgf21 | -2.4** | -3.1* | -2.9* | -1.3 | -1.8 |
| Adora1 | -1.7* | -2.4** | -2.5** | 1.1 | -3.1 |
| Cyp1a2 | 1.5* | 2.5* | 2.2 | -1.4 | 1.5 |
| Serpina11 | 1.8 | 2.3** | 2.8** | 1.9 | 2.2 |
| Nudt7 | 2.0 | 2.4** | 2.4** | -1.1 | 1.9 |
| F11 | 2.3** | 2.2** | 2.0** | 2.9 | 2.2 |
| C8b | 2.9** | 2.9** | 2.7** | 1.4 | 1.9 |
| Cyp7b1 | 5.1** | 11.4** | 4.6* | 3.2 | 2.8 |
| Cidec | -11.6** | -4.7 | -4.8 | -1.7 | -1.3 |
| Ms4a7 | -6.7** | -4.9** | -2.4* | -1.6 | -1.4 |
| Cd83 | -3.9* | -2.3* | -2.3* | 1.0 | -1.4 |
| Cyp17a1 | -3.0* | -3.4** | -2.5* | -1.1 | 1.1 |
| Osbpl3 | -2.6** | -14.1** | -7.9** | 1.1 | -1.3 |
| Unc5b | -1.9 | -3.6** | -2.4** | 1.2 | 1.0 |
| Akr1c19 | -1.7 | -3.1** | -2.7** | -1.0 | 1.2 |
| Plxna2 | -1.6 | -2.3** | -2.5** | 1.4 | -1.2 |
| Aadat | 1.6 | 2.2** | 2.1* | 1.3 | 1.0 |
| Selenbp2 | 3.3* | 3.4** | 2.2** | -1.0 | 1.4 |
| Type B | |||||
| Tnfrsf19 | -2.3* | -1.5 | -2.5** | 1.3 | -1.5 |
| Il1b | -1.7* | -1.5 | -1.7* | 1.0 | -1.2 |
| Hmgn2 | 2.3** | 1.4 | 2.2** | 1.9 | 1.7 |
| C8a | 1.5* | 1.8** | 2.2** | 1.6 | 1.4 |
| Hapln4 | 1.9** | 1.4 | 2.6** | -1.1 | 1.1 |
| Type C | |||||
| Ly6d | -15.7** | -6.1** | -1.6 | -5.2 | -2.4 |
| Trem2 | -12.4 | -3.3* | -1.2 | -1.9 | -1.3 |
| Gal3st1 | -12.1** | -3.3* | -2.1 | 1.5 | -1.1 |
| Atf3 | -10.9** | -2.9* | -1.1 | -1.8 | 1.0 |
| Anxa2 | -7.1* | -2.9* | -1.1 | -1.5 | -1.0 |
| Nrg1 | -5.8** | -7.2** | -1.4 | 1.7 | -1.1 |
| Serinc2 | -5.2** | -2.2* | -1.2 | 1.3 | -2.2 |
| Nupr1 | -5.0** | -5.1** | -1.3 | -2.8 | 1.1 |
| Cd52 | -4.8** | -2.7** | -1.4 | -2.8 | -1.0 |
| H2-Eb1 | -3.8 | -2.2** | -1.7* | -2.1 | -1.1 |
| Sprr1a | -3.4** | -2.9** | -1.3 | 1.7 | -1.1 |
| 5430435G22Rik | -3.2 | -2.3** | -1.4 | -1.9 | 1.2 |
| Cd14 | -3.2** | -3.0* | -1.3 | -1.8 | -1.4 |
| Slamf9 | -3.1* | -2.5** | -1.0 | -1.6 | -1.3 |
| Gpx7 | -2.7 | -2.4** | -1.3 | 1.7 | 1.2 |
| Gas6 | -2.5** | -2.1** | -1.7** | -1.9 | -1.1 |
| Tmsb4x | -2.2** | -2.3** | -1.2 | -1.9 | 1.2 |
| Spp1 | -2.2** | -2.6* | -1.2 | -1.2 | -1.7 |
| Als2cr4/ Tmem237 | -2.1** | -2.1** | -1.4 | 1.6 | -1.2 |
| Trib3 | -1.9* | -2.7* | -1.7 | 1.8 | -1.1 |
| Csnk1e | -1.7* | -2.5** | -1.7 | 1.5 | 1.3 |
| Fgf1 | 1.7** | 2.3** | 1.2 | 1.5 | 1.1 |
| Slc17a3 | 1.8** | 2.7** | 1.8** | 1.1 | 1.4 |
| Hes6 | 2.0 | 2.6** | 1.7 | -1.9 | 2.8 |
| Slc30a10 | 2.0 | 2.2* | 1.4 | -1.5 | -1.3 |
| Scnn1a | 2.3** | 2.1** | 1.2 | 1.4 | 1.5 |
| Serpina3k | 2.7** | 2.5** | 1.5** | 2.5 | 1.9 |
| Avpr1a | 3.8** | 2.3* | 1.5 | -1.2 | 1.7 |
| Hsd3b5 | 243.3** | 15.4* | 2.3 | 5.2 | 1.3 |
| Sdcbp2 | -61.5** | -4.5* | -1.2 | 1.7 | 1.0 |
| Cd63 | -5.7** | -3.1* | -1.4 | -1.4 | 1.1 |
| Uap1l1 | -5.7** | -3.5* | 1.2 | -1.1 | 1.0 |
| Spats2l | -3.7** | -2.1* | -1.4 | 1.1 | -1.0 |
| Slc41a3 | -3.5** | -2.1* | -1.0 | 1.2 | 1.1 |
| Anxa5 | -3.2** | -2.4* | -1.3 | -1.3 | -1.3 |
| Tmsb10 | -3.2 | -2.9* | -1.2 | -1.2 | 1.2 |
| Cpxm1 | -3.1* | -3.0** | -2.0 | -1.1 | 1.2 |
| Iqgap1 | -2.8** | -2.2* | -1.0 | -1.3 | -1.2 |
| Rhoc | -2.3 | -2.8** | -1.1 | 1.2 | 1.2 |
| Serpina3g | -2.2 | -2.1* | -1.4 | -1.2 | -1.4 |
| Ddit3 | -2.1** | -2.6* | -1.7 | -1.1 | -1.2 |
| Cxadr | -2.1** | -3.0** | -1.6 | -1.4 | -1.2 |
| Cdc42ep5 | -2.1** | -2.9** | -1.3 | 1.4 | -1.1 |
| Renbp | -2.0** | -3.2** | 1.2 | 1.3 | 1.1 |
| Ank3 | -1.7 | -3.5** | -1.9** | 1.2 | -1.2 |
| AI317395 | 1.5** | 2.7** | 1.6 | -1.0 | -1.0 |
| Gulo | 1.6** | 2.1* | 1.6 | 1.3 | 1.3 |
| Bach2 | 1.6** | 3.0** | 2.0* | 1.2 | -1.0 |
| Hsd3b2 | 1.6 | 2.2** | 1.2 | 1.2 | -1.0 |
| Rnase4 | 1.8 | 2.1** | 1.4* | 1.0 | 1.2 |
| Npr2 | 2.1** | 2.2* | 1.5 | 1.1 | -1.2 |
| Mup4 | 5.9 | 4.7* | 2.0 | -1.0 | 1.3 |
Data represents fold change.
Male (n=3) mice were fed the diets for 11 weeks post-weaning and compared to HNF4α-ko [15], *p<0.05, **p<0.01.
Female (n=2) mice were fed the diets for 36 weeks post-weaning and compared to HNF4α-ko [15].
Expression levels are calculated relative to WT LFD
Expression levels are calculated relative to WT LFD
Expression levels are calculated male liver-specific HNF4α-ko relative to male WT [15],
p<0.05,
p<0.01.
Cyp1b1 effects on gene expression at weaning
The pulsatile release of GH from the pituitary in the adult is established by hypothalamic imprinting at the time of birth (43). We, therefore, tested whether Cyp1b1-deletion intervened at this time in the hepatocyte gene development profile by measuring liver gene expression at weaning. We found evidence for major selective gene changes, but without an effect on overall liver development: the extensive post-natal decreases in alpha-fetoprotein (Afp) and the peptide hormone, Igf2, are delayed, leading to large increases at post-natal day (pnd) 21 (Fig. 6A). Genes involved in fatty acid synthesis increase dramatically from nearly absent levels between birth and weaning. The increases in fatty acid synthase (Fasn) and Scd1 are greatly suppressed in Cyp1b1-ko mice at pnd 21 (Fig. 6B). The HNF4α-ko-responsive genes that correlate with Cyp1b1-ko dw11 LFD genes in Fig. 5B are comparable in Cyp1b1-ko and WT mice at weaning. Thus, the effects of Cyp1b1 deletion are realized only several weeks post-weaning (Supplemental Table 5), when responses to GH/HNF4a signaling becomes evident [13,44].
Figure 6. Cyp1b1-ko prevents developmental change in gene expression at weaning.
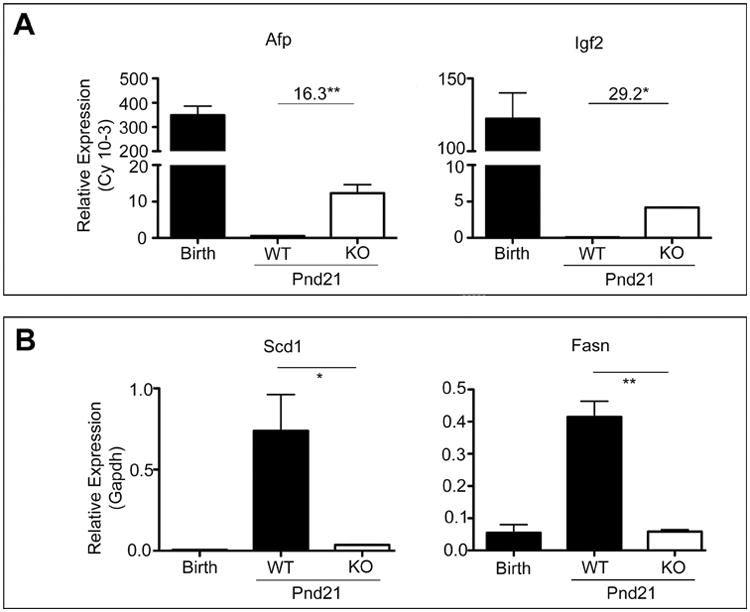
(A) Liver gene expression (Cy values) of Afp and Igf2 declines from birth to weaning (Pnd21) in WT mice. Cyp1b1-ko (KO) prevents this suppression. (B) Scd1 and Fasn gene expression as determined by qPCR displayed a large developmental stimulation from birth to weaning, which was attenuated by Cyp1b1-ko. *p-value<0.05, **p-value<0.01.
Gene expression changes correlate poorly with protein changes
Liver oxidative stress has been linked to increased protein turnover through autophagy [45]. P450 cytochromes exhibit appreciable changes in turnover, mediated by both autophagy and lysosomal degradation [46]. LFD exhibits markers of inflammation, suggesting that altered protein turnover may cause such differences between mRNA expression and protein levels. An initial examination showed major discrepancies when compared to mRNA expression suggesting that Cyp1b1-associated signaling also targets protein turnover (Supplementary Fig. 1) [47]. Scd1 protein is highly suppressed in Cyp1b1-ko mice on the LFD, even though mRNA is unaffected. The suppression of Scd1 provides a stimulatory signal for autophagy [48]. Microsomal epoxide hydrolase (Ephx1) and microsomal glutathione transferase (Mgst1) are each associated with protection from oxidative stress. Although their mRNA expression was unaffected, each protein was suppressed in Cyp1b1-ko livers on both diets. CYP1A2 protein exhibited increased mRNA expression, but nevertheless showed decreased expression in Cyp1b1-ko mice. These affects appear to be gene selective, since changes in the protein levels of CYP2B, CYP2C and CYP4A match the mRNA expression changes. In each case, the antibodies recognize several forms. However, we show that genes within the same family share similar diet and Cyp1b1 deletion effects.
Discussion
Although Cyp1b1 is not expressed in mouse hepatocytes, systemic deletion suppresses the typical obesity and liver steatosis caused by administration of a HFD to male mice for 11 weeks post-weaning (dw11, Fig. 1) [9]. This response is delayed by approximately 4 weeks in female mice, which, however, still exhibit suppression of obesity and steatosis with Cyp1b1 deletion. Loss of Cyp1b1 metabolism of endogenous substrates produces greater changes in liver gene expression than the diet change. Restoration of human Cyp1b1 to Cyp1b1-ko mice restores the DIO [49]. The liver gene expression profiles in males Cyp1b1-ko livers show decreased activities for the lipogenic gene, Scd1, and the lipid-activated nuclear receptors, PPARα, CAR and PXR. Cyp1b1-ko mice show a decrease in lipid accumulation in favor of glycogen storage and fatty acid oxidation, as well as a suppression of the hepatitis marker, Krt23, after an extended exposure to the HFD [9,27].
Gene expression changes in males have been effectively resolved into functionally different groups based on diet sensitivity and Cyp1b1-ko responses. Diet-independent effects of Cyp1b1 deletion (Group A) largely include changes linked to suppression of GH-stimulated HNF4α activity. Cyp1b1-ko HFD-selective responses (Group B), including Scd1 suppression, may be associated with leptin signaling from the hypothalamus [9]. Depletion of Scd1 alone causes a loss of DIO that depends on leptin [50]. Cyp1b1-ko LFD-selective responses (Group C) include a large set of markers of diminished inflammatory and oxidative stress response processes. A fourth group of genes respond in WT mice to the switch from LFD to HFD, but are insensitive to Cyp1b1 deletion (HF genes).
The Group C inflammatory/oxidative stress marker genes typically show a parallel decline in WT mice for the switch from the LFD to the HFD. The ad libitum feeding used here, with an early morning sacrifice, delivers a postprandial glucose increase that increases liver inflammation. Thus, the group C/HF combination selects inflammatory marker genes (Cd14, Ly6D, Ccl2) that respond to a surge of blood glucose, which is suppressed in Cyp1b1-ko mice, via lower basal blood glucose levels and possibly distinct anti-inflammatory effects.
The pattern of responses is very different between males and females, even though the overall liver and adipose changes are similar. We compared females fed the diet for 36 weeks to males fed the diets for 11 weeks (dw36 versus dw11). WT females responded much later to DIO and, at dw36, showed many comparable characteristics to the younger WT males (Fig. 1) that are substantiated by conservation of 60 percent of the HF gene responses (Table 5). A proportion of Cyp1b1-dependent responses are retained (Table 4) and includes several Group A changes that are linked to lipid homeostasis.
There is, however, a large shift in females towards diet-induced responses that are suppressed in Cyp1b1-ko mice. This is most evident for a set of increases that may derive from the onset of NASH and an effective reversal in Cyp1b1-ko mice (Krt23, Ephx1) (Table 7). This pattern is also seen for a broad suppression of cholesterol biosynthetic genes, suggesting inhibition of the central regulator, SREBP2, by an increase in dietary fat that is reversed in Cyp1b1-ko mice. Suppression of Scd1 and several other important Group B responses in Cyp1b1-ko mice on the HFD are retained in both sexes. These decreases have been associated with increased leptin activity through the hypothalamus, which may be enhanced in these females due to prolonged HFD feeding, but are still further suppressed in Cyp1b1-ko mice. There is also retention of suppression by many LFD-associated inflammatory markers designated to Group C (Table 6).
There is a major shift in PPARα activity in Cyp1b1-ko mice on the LFD. The strong suppression of activity in males switches to stimulations in females that parallel the increase in receptor activity (Table 7). There are also major increases in PPARα stimulation of recognized target genes in females on the HFD that are not seen in the males.
The majority of HFD-selective suppression responses in Cyp1b1-ko mice, including Scd1, Elovl5, Pdk4 and Me1, indicate a shift to increased fatty acid oxidation. The decreases in PPARα activity correspond to expression changes that decrease lipid droplet formation (G0S2, Perilipin/Plin 4 and Cidec/Fsp27) or peroxisome activity (Acot1 and Pex11a). The decreased PPARγ gene expression is also associated with decrease lipid droplet formation. Opposing changes in glycogen synthase modulators, Ppp1r3c and Ppp1r3g, favor glycogen synthesis. These gene responses account for the switch from lipid droplets to glycogen accumulation for Cyp1b1-ko mice on a HFD [9].
The Group A gene responses include many of the Cyps that exhibit sexually dimorphic liver expression. Their expression depends on HNF4α and on GH signaling, which is differentially delivered in males and females. GH in males is delivered in short pulses every 4 hours that activates Hnf4α via a synchronized Stat4a phosphorylation/dephosphorylation cycle [51]. Females exhibit a more constant GH blood level [51]. The male-selective expression at dw5 decreases after liver specific deletion of Hnf4α. At dw11, the stimulatory effects of the pulsatile GH stimulus in male mice on Cyp7b1, Hsd3b4, Mup 4, Enho, Egfr, and Lifr are substantially elevated in Cyp1b1-ko mice. Other GH-regulated genes that exhibit low expression at dw5 in male mice showed increased expression after Hnf4α deletion. This group includes many genes regulated by PPARα, PXR and CAR and most of the responsive Cyps (Table 1). At dw11, these receptor-mediated genes, including these Cyps, showed decreased expression in male Cyp1b1-ko mice. Overall the effects of Cyp1b1 deletion correlate inversely with the effects of Hnf4α deletion (Fig 5B).
Acot1 is representative of genes that are stimulated by PPARα, but suppressed by Hnf4α deletion and in Cyp1b1-ko mice at dw11. Analysis of the Acot1 promoter identifies a DR1 PPARα site that also binds HNF4α and may, therefore, compete for the site with the heterodimeric RXR partner [52]. Deletion of the Hnf4a suppressor, Shp/Nr0b2, also correlates with many of these Group A responses: in this case with a direct proportionality (Fig 5E).
We initially had difficulty envisaging how Cyp1b1-ko could so substantially increase or decrease the responses to the GH pulses. However, we noticed that that the differences in GH-linked and sexual dimorphism gene expression were much less at dw11. In males, the GH/Hnf4α stimulation declined while the female-selective suppressions exhibited large increases (Fig. 5C). The remarkable 60-fold Cyp1b1-ko suppression of Cyp4a14 corresponded to a similarly extreme stimulation between dw5 and dw11, which also removed much of the female selectivity at dw11. This pattern appears for a majority of the Group A genes that we have examined. Typically, the Cyp1b1-ko expression at dw11 matches the WT expression at dw5, as if the decline in GH/Hnf4α signaling is absent in these mice (Fig. 5D). In support of this proposed mechanism, serum GH pulses in male mice indeed decline as the mice mature during this period [53,54]. Clearly validation of these changes is necessary, including measurement of male Cyp1b1 expression levels at dw5 and litter paired analyses of both GH maturation changes and key gene expression changes at dw5 and dw11.
Cyp1b1 deletion only minimally affects genes controlled by this GH network at weaning. However, Cyp1b1 deletion substantially impacts other genes in this fetal/neonatal period. Scd1 and Fasn increase dramatically after birth, but are suppressed post-weaning by Cyp1b1-deletion and in the adult (Fig. 6, Table 7). The normal neonatal disappearance of the gene combination of Igf2 and H19 caused by DNA methylation is substantially delayed in Cyp1b1-ko mice (Fig. 6). This change has been linked to polyunsaturated fatty acid levels in humans [55]. The loss of Afp between birth and weaning is also appreciably delayed leading to extensive perinatal expression. Afp sequesters estradiol and potentially diminishes perinatal effects of estradiol on development [56].
Cyp1b1 can exert a physiological impact through metabolism of estradiol, as has been described for the impact of Cyp1b1 on blood pressure [57]. Estradiol suppresses obesity, as evidenced by the increased obesity in ERα-ko and aromatase-ko mice [19,20]. The similar responsiveness in males indicates that the functional estradiol is generated locally by aromatase near the site of ERα regulatory activity. Cyp1b1 is highly expressed in the hypothalamus and deletion has the capacity to increase local estradiol levels. Activating ERα has previously been shown to suppress obesity in male mice [58,19]. Obesity is suppressed both by the direct tissue effects of GH and by leptin effects in hypothalamus. Leptin acts via the VMH, which is also impacted by neonatal estradiol [59,60]. The suppression of Scd1 and several other genes in Group B may arise from increased hypothalamic leptin activity in Cyp1b-ko mice [9]. Estradiol also regulates the development of cells in the hypothalamus that generate GHRH, which subsequently control adult the male pulsatile GH signaling [51,58,60].
The attenuation of GH/HNF4α signaling to the liver between pw5 and pw11 coincides with the onset of weight differences between LFD and HFD. In this period, the pulsatile release of GH in males appreciably declines in association with changes in GHRH in the hypothalamus (53,54). GH suppresses adiposity and, therefore, this attenuation of GH effects between dw5 and dw11 is likely to be a major contributor to the onset of DIO in males exactly at this time. The retention of dw5 liver responses to GH pulses in Cyp1b1-ko mice suggests that this is a major contributor to the suppression of DIO in these mice. Future experiments will focus on testing the hypothesis that this maturation change is connected to obesity. This effect of Cyp1b1 deletion may have origins in the neonatal gene expression changes brought about by Cyp1b1 metabolism.
Supplementary Material
Fig. S1. Changes in microsomal protein expression across four treatment groups. Immunoblots of hepatic microsomal fractions corresponding to each treatment group. Relative protein densities for each treatment normalized to WT/LFD except for Cyp2c. For expression changes see Table 1, Table 2 and Supplementary Table S2.
Supplemental Table 2. Comprehensive list of liver gene responses divided by selectivity groups.
Data represents log2 fold change for each designated group.
Male (n=3) mice were fed the diets for 11 weeks post-weaning.
Supplemental Table 4. Function of select genes shown in Table 2.
NE represents no effect.
Supplemental Table 6. Complete list of Limma analyzed gene responses from dw36 female mice.
Highlights.
Cyp1b1-ko suppresses steatosis and obesity in both male and female mice.
Cyp1b1-ko affects liver transcripts without expression in hepatocytes.
Cyp1b1-ko dramatically impacts liver cytochrome P450 gene family members.
Cyp1b1-ko effects hepatic signaling due to a decline in GH/Hnf4α signaling.
LFD fed Cyp1b1-ko's suppress hepatic inflammation and oxidative stress.
Acknowledgments
The authors would like to thank Alhaji N'jai, Brian Johnson, Bradley Stewart and Chris Bradfield with their assistance in running and software analysis of the microarray.
This research was supported by NIH grants: R01 DK072749 (CRJ), R01 EY018179 (CRJ), T32HD041921 (JRB), T32ES007015 (JRB) and Department of Defense grant PC050578 (CRJ).
Abbreviations
- Cyp1b1
Cytochrome P450 isoform 1b1
- PPARg
peroxisome proliferator activated receptor gamma
- WT
wild-type
- LFD
low fat diet
- HFD
high fat diet
- DIO
diet induced obesity
- Cyp
cytochrome P450
- PPARa
peroxisome proliferator activated receptor alpha
- CAR (Nr1i3)
constitutive androstane receptor
- PXR
pregnane X receptor
- HNF4a
hepatic nuclear factor isoform 4 alpha
- GH
growth hormone
- ERa-ko
estrogen receptor alpha knockout
- Shp
small heterodimeric partner
- Krt23
keratin isoform 23
- NASH
nonalcoholic steatohepatitis
- Acot1
acyl-CoA thioesterase isoform 1
- Igfbp1
insulin-like growth factor binding protein isoform 1
- Klf6
Kruppel-like factor isoform 6
- Mup
major urinary protein
- Plin4
perilipin isoform 4
- G0S2
G0/G1 switch gene 2
- Cidec
cell death-inducing DFFA-like effector c
- Vldlr
very low density lipoprotein receptor
- EGF
epidermal growth factor
- LIF
leukemia inhibitory factor
- LIFR
leukemia inhibitory factor receptor
- Ppp1r3c
protein phosphatase 1, regulatory subunit 3C
- Ppp1r3g
protein phosphatase 1, regulatory (inhibitor) subunit 3G
- Scd1
stearoyl-Coenzyme A desaturase isoform 1
- Pdk4
pyruvate dehydrogenase kinase, isozyme 4
- Me1
malic enzyme 1, NADP(+)-dependent, cytosolic
- FA
fatty acid, Hsd3b, hydroxy-delta-5-steroid dehydrogenase, 3 beta- and steroid delta-isomerase cluster
- Nr4a1
nuclear receptor subfamily 4, group A, member 1
- Gadd45g
growth arrest and DNA-damage-inducible, gamma
- Serpina7
serine (or cysteine) peptidase inhibitor, clade A (alpha-1 antiproteinase, antitrypsin), member 7
- Marco
macrophage receptor with collagenous structure
- EGFR
epidermal growth factor receptor
- Elvol5
ELOVL fatty acid elongase isoform 5
- DR1
direct repeat 1
- RXR
retinoid X receptor
- VMH
ventromedial hypothalamus
- Cd36
CD36 antigen
- Lgals
lectin, galactose binding, soluble 1
- Vnn1
vanin 1
- Gsta2
glutathione S-transferase, alpha 2
- Ly6d
lymphocyte antigen 6 complex, locus D
- Cdh1
cadherin 1
- Nudt7
nudix (nucleoside diphosphate linked moiety X)-type motif 7
- Pex11a
peroxisomal biogenesis factor 11 alpha
- Slco1a1
solute carrier organic anion transporter family, member 1a1
- Nupr1
nuclear protein transcription regulator 1
- Ccl2
chemokine (C-C motif) ligand 2
- Spp1
secreted phosphoprotein 1
- Gas6
growth arrest specific 6
- Cd34
CD34 antigen
- Cd14
CD14 antigen
- Cd9
CD9 antigen
- Aim1l
absent in melanoma 1-like
- Aldh1a1
aldehyde dehydrogenase family 1, subfamily A1
- Gpi1
glucose phosphate isomerase 1
- Btg3
B cell translocation gene 3
- Ephx1
epoxide hydrolase 1, microsomal
- Saa1
serum amyloid A 1
- Srebp2
sterol regulatory element binding protein 2
- Slc25a47
solute carrier family 25, member 47
- Aox1
aldehyde oxidase 1
- Cpt1a
carnitine palmitoyltransferase 1a, liver
- Fitm1
fat storage-inducing transmembrane protein 1
- Angptl4
angiopoietin-like 4
- Afp
alpha fetoprotein
- Igf2
insulin-like growth factor 2
- Fasn
fatty acid synthase
- Mgst1
microsomal glutathione S-transferase 1
- Stat4a
signal transducer and activator of transcription 4a
- Enho
energy homeostasis associated
- H19
H19 imprinted maternally expressed transcript
- GHRH
growth hormone releasing hormone
Footnotes
Publisher's Disclaimer: This is a PDF file of an unedited manuscript that has been accepted for publication. As a service to our customers we are providing this early version of the manuscript. The manuscript will undergo copyediting, typesetting, and review of the resulting proof before it is published in its final citable form. Please note that during the production process errors may be discovered which could affect the content, and all legal disclaimers that apply to the journal pertain.
References
- 1.Buters JT, Sakai S, Richter T, Pineau T, Alexander DL, Savas U, Doehmer J, Ward JM, Jefcoate CR, Gonzalez FJ. Cytochrome P450 CYP1B1 determines susceptibility to 7,12-dimethylbenz[a]anthracene-induced lymphomas. PNAS. 1999;96:1977–1982. doi: 10.1073/pnas.96.5.1977. [DOI] [PMC free article] [PubMed] [Google Scholar]
- 2.Galván N, Jaskula-Sztul R, MacWilliams PS, Czuprynski CJ, Jefcoate CR. Bone marrow cytotoxicity of benzo[a]pyrene is dependent on CYP1B1 but is diminished by Ah receptor-mediated induction of CYP1A1 in liver. Toxicol Appl Pharmacol. 2003;193:84–96. doi: 10.1016/s0041-008x(03)00338-7. [DOI] [PubMed] [Google Scholar]
- 3.Tang Y, Scheef EA, Gurel Z, Sorenson CM, Jefcoate CR, Sheibani N. CYP1B1 and endothelial nitric oxide synthase combine to sustain proangiogenic functions of endothelial cells under hyperoxic stress. Am J Physiol. 2009;298:665–678. doi: 10.1152/ajpcell.00153.2009. [DOI] [PMC free article] [PubMed] [Google Scholar]
- 4.D'Ambrosio DN, Walewski JL, Clugston RD, Berk PD, Rippe RA, Blaner WS. Distinct populations of hepatic stellate cells in the mouse liver have different capacities for retinoid and lipid storage. PLoS One. 2011;6:e24993. doi: 10.1371/journal.pone.0024993. [DOI] [PMC free article] [PubMed] [Google Scholar]
- 5.Stoilov I, Rezaie T, Jansson I, Schenkman JB, Sarfarazi M. Expression of cytochrome P4501b1 (Cyp1b1) during early murine development. Mol Vis. 2004;10:629–36. [PubMed] [Google Scholar]
- 6.Rebouissou S, Bioulac-Sage P, Zucman-Rossi J. Molecular pathogenesis of focal nodular hyperplasia and hepatocellular adenoma. J Hepatology. 2008;48:163–70. doi: 10.1016/j.jhep.2007.10.003. [DOI] [PubMed] [Google Scholar]
- 7.Cho YC, Zheng W, Yamamoto M, Liu X, Hanlon PR, Jefcoate CR. Differentiation of pluripotent C3H10T1/2 cells rapidly elevates CYP1B1 through a novel process that overcomes a loss of Ah Receptor. Arch Biochem Biophys. 2005;439:139–153. doi: 10.1016/j.abb.2005.04.025. [DOI] [PubMed] [Google Scholar]
- 8.de Meijer VE, Le HD, Meisel JA, Akhavan Sharif MR, Pan A, Nosé V, Puder M. Dietary fat intake promotes the development of hepatic steatosis independently from excess caloric consumption in a murine model. Metabolism. 2010;59:1092–1105. doi: 10.1016/j.metabol.2009.11.006. [DOI] [PMC free article] [PubMed] [Google Scholar]
- 9.Larsen MC, Bushkofsky JR, Gorman T, Adhami V, Muktar H, Wang S, Reeder S, Sheibani N, Jefcoate CR. Cytochrome P450 1B1: An unexpected modulator of liver fatty acid homeostasis. Arch Biochem Biophys. 2015;571:21–39. doi: 10.1016/j.abb.2015.02.010. [DOI] [PMC free article] [PubMed] [Google Scholar]
- 10.Ghose R, Omoluabi O, Gandhi A, Shah P, Strohacker K, Carpenter KC, McFarlin B, Guo T. Role of high-fat diet in regulation of gene expression of drug metabolizing enzymes and transporters. Life Sci. 2011;89:57–64. doi: 10.1016/j.lfs.2011.05.005. [DOI] [PMC free article] [PubMed] [Google Scholar]
- 11.Ruby MA, Goldenson B, Orasanu G, Johnston TP, Plutzky J, Krauss RM. VLDL hydrolysis by LPL activates PPAR-alpha through generation of unbound fatty acids. J Lipid Res. 2010;51:2275–81. doi: 10.1194/jlr.M005561. [DOI] [PMC free article] [PubMed] [Google Scholar]
- 12.Finn RD, Henderson CJ, Scott CL, Wolf CR. Unsaturated fatty acid regulation of cytochrome P450 expression via a CAR-dependent pathway. Biochem J. 2009;417:43–54. doi: 10.1042/BJ20080740. [DOI] [PMC free article] [PubMed] [Google Scholar]
- 13.Conforto TL, Waxman DJ. Sex-specific mouse liver gene expression: genome-wide analysis of developmental changes from pre-pubertal period to young adulthood. Biol Sex Differ. 2012;3:1–16. doi: 10.1186/2042-6410-3-9. [DOI] [PMC free article] [PubMed] [Google Scholar]
- 14.Hayhurst GP, Lee YH, Lambert G, Ward JM, Gonzalez FJ. Hepatocyte nuclear factor 4alpha (nuclear receptor 2A1) is essential for maintenance of hepatic gene expression and lipid homeostasis. Mol Cell Biol. 2001;21:1393–403. doi: 10.1128/MCB.21.4.1393-1403.2001. [DOI] [PMC free article] [PubMed] [Google Scholar]
- 15.Holloway MG, Miles GD, Dombkowski AA, Waxman DJ. Liver-specific hepatocyte nuclear factor-4α deficiency: Greater impact on gene expression in male and female mouse liver. Mol Endocrinol. 2008;22(5):1274–1286. doi: 10.1210/me.2007-0564. [DOI] [PMC free article] [PubMed] [Google Scholar]
- 16.Miyamoto L, Ebihara K, Kusakabe T, Aotani D, Yamamoto-Kataoka S, Sakai T, Aizawa-Abe M, Yamamoto Y, Fujikura J, Hayashi T, Hosoda K, Nakao K. Leptin activates hepatic 5′-AMP-activated protein kinase through sympathetic nervous system and α1-adrenergic receptor: a potential mechanism for improvement of fatty liver in lipodystrophy by leptin. J Biol Chem. 2012;287:40441–7. doi: 10.1074/jbc.M112.384545. [DOI] [PMC free article] [PubMed] [Google Scholar]
- 17.Palenski TL, Sorenson CM, Jefcoate CR, Sheibani N. Lack of Cyp1b1 promotes the proliferative and migratory phenotype of perivascular supporting cells. Lab Invest. 2013;93:646–62. doi: 10.1038/labinvest.2013.55. [DOI] [PMC free article] [PubMed] [Google Scholar]
- 18.Hayes CL, Spink DC, Spink BC, Cao JQ, Walker NJ, Sutter TR. 17 beta-estradiol hydroxylation catalyzed by human cytochrome P450 1B1. Proc Natl Acad Sci U S A. 1996;93:9776–9781. doi: 10.1073/pnas.93.18.9776. [DOI] [PMC free article] [PubMed] [Google Scholar]
- 19.Ohlsson C, Hellberg N, Parini P, Vidal O, Bohlooly-Y M, Rudling M, Lindberg MK, Warner M, Angelin B, Gustafsson JA. Obesity and disturbed lipoprotein profile in estrogen receptor-alpha-deficient male mice. Biochem Biophys Res Commun. 2000;278:640–645. doi: 10.1006/bbrc.2000.3827. [DOI] [PubMed] [Google Scholar]
- 20.Jones ME, Thorburn AW, Britt KL, Hewitt KN, Misso ML, Wreford NG, Proietto J, Oz OK, Leury BJ, Robertson KM, Yao S, Simpson ER. Aromatase-deficient (ArKO) mice accumulate excess adipose tissue. J Steroid Biochem Mol Biol. 2001;79:3–9. doi: 10.1016/s0960-0760(01)00136-4. [DOI] [PubMed] [Google Scholar]
- 21.Wang L, Liu J, Saha P, Huang J, Chan L, Spiegelman B, Moore DD. The orphan nuclear receptor SHP regulates PGC-1alpha expression and energy production in brown adipocytes. Cell Metab. 2005;2:227–238. doi: 10.1016/j.cmet.2005.08.010. [DOI] [PubMed] [Google Scholar]
- 22.Shimamoto Y, Ishida J, Yamagata K, Saito T, Kato H, Matsuoka T, Hirota K, Daitoku H, Nangaku M, Yamagata K, Fujii H, Takeda J, Fukamizu A. Inhibitory effect of the small heterodimer partner on hepatocyte nuclear factor-4 mediates bile acid-induced repression of the human angiotensinogen gene. J Biol Chem. 2004;279:7770–7776. doi: 10.1074/jbc.M310577200. [DOI] [PubMed] [Google Scholar]
- 23.Hayes KR, Vollrath AL, Zastrow GM, McMillan BJ, Craven M, Jovanovich S, Rank DR, Penn S, Walisser JA, Reddy JK, Thomas RS, Bradfield CA. EDGE: A Centralized Resource for the Comparison, Analysis, and Distribution of Toxicogenomic Information. Mol Pharmacol. 2005;67:1360–1368. doi: 10.1124/mol.104.009175. [DOI] [PubMed] [Google Scholar]
- 24.Vollrath AL, Smith AA, Craven M, Bradfield CA. EDGE(3): a web-based solution for management and analysis of Agilent two color microarray experiments. BMC Bioinformatics. 2009;10:280–290. doi: 10.1186/1471-2105-10-280. [DOI] [PMC free article] [PubMed] [Google Scholar]
- 25.Inoue M, Ohtake T, Motomura W, Takahashi N, Hosoki Y, Miyoshi S, Suzuki Y, Saito H, Kohgo Y, Okumura T. Increased expression of PPARgamma in high fat diet-induced liver steatosis in mice. Biochem Biophys Res Commun. 2005;336(1):215–222. doi: 10.1016/j.bbrc.2005.08.070. [DOI] [PubMed] [Google Scholar]
- 26.Starmann J, Fälth M, Spindelböck W, Lanz KL, Lackner C, Zatloukal K, Trauner M, Sültmann H. Gene expression profiling unravels cancer-related hepatic molecular signatures in steatohepatitis but not in steatosis. PLoS One. 2012;7:e46584. doi: 10.1371/journal.pone.0046584. [DOI] [PMC free article] [PubMed] [Google Scholar]
- 27.Anderson SP, Dunn C, Laughter A, Yoon L, Swanson C, Stulnig TM, Steffensen KR, Chandraratna RA, Gustafsson JA, Corton JC. Overlapping transcriptional programs regulated by the nuclear receptors peroxisome proliferator-activated receptor alpha, retinoid X receptor, and liver X receptor in mouse liver. Mol Pharmacol. 2004;66:1440–1452. doi: 10.1124/mol.104.005496. [DOI] [PubMed] [Google Scholar]
- 28.Ritchie ME, Phipson B, Wu D, Hu Y, Law CW, Shi W, Smyth GK. Limma powers differential expression analyses for RNA-sequencing and microarray studies. Nucleic Acids Research. 2015;43(7):e47. doi: 10.1093/nar/gkv007. [DOI] [PMC free article] [PubMed] [Google Scholar]
- 29.Huang DW, Sherman BT, Lempicki RA. Systematic and integrative analysis of large gene lists using DAVID Bioinformatics Resources. Nature Protoc. 2009;4(1):44–57. doi: 10.1038/nprot.2008.211. [DOI] [PubMed] [Google Scholar]
- 30.Huang DW, Sherman BT, Lempicki RA. Bioinformatics enrichment tools: paths toward the comprehensive functional analysis of large gene lists. Nucleic Acids Red. 2009;37:1–13. doi: 10.1093/nar/gkn923. [DOI] [PMC free article] [PubMed] [Google Scholar]
- 31.Rakhshandehroo M, Knoch B, Müller M, Kersten S. Peroxisome proliferator-activated receptor alpha target genes. PPAR Res. 2010:1–20. doi: 10.1155/2010/612089. [DOI] [PMC free article] [PubMed] [Google Scholar]
- 32.Baillie AG, Coburn CT, Abumrad NA. Reversible binding of long-chain fatty acids to purified FAT, the adipose CD36 homolog. J Membr Biol. 1996;153:75–81. doi: 10.1007/s002329900111. [DOI] [PubMed] [Google Scholar]
- 33.Jo H, Choe SS, Shin KC, Jang H, Lee JH, Seong JK, Back SH, Kim JB. Endoplasmic reticulum stress induces hepatic steatosis via increased expression of the hepatic very low-density lipoprotein receptor. Hepatology. 2013;57:1366–77. doi: 10.1002/hep.26126. [DOI] [PubMed] [Google Scholar]
- 34.Greenberg AS, Egan JJ, Wek SA, Garty NB, Blanchette-Mackie EJ, Londos C. Perilipin, a major hormonally regulated adipocyte-specific phosphoprotein associated with the periphery of lipid storage droplets. J Biol Chem. 1991;266:11341–11346. [PubMed] [Google Scholar]
- 35.Grahn TH, Zhang Y, Lee MJ, Sommer AG, Mostoslavsky G, Fried SK, Greenberg AS, Puri V. FSP27 and PLIN1 interaction promotes the formation of large lipid droplets in human adipocytes. Biochem Biophys Res Commun. 2012;432:296–301. doi: 10.1016/j.bbrc.2013.01.113. [DOI] [PMC free article] [PubMed] [Google Scholar]
- 36.Yu S, Matsusue K, Kashireddy P, Cao WQ, Yeldandi V, Yeldandi AV, Rao MS, Gonzalez FJ, Reddy JK. Adipocyte-specific gene expression and adipogenic steatosis in the mouse liver due to peroxisome proliferator-activated receptor gamma1 (PPARgamma1) overexpression. J Biol Chem. 2003;278:498–505. doi: 10.1074/jbc.M210062200. [DOI] [PubMed] [Google Scholar]
- 37.Kumar KG, Trevaskis JL, Lam DD, Sutton GM, Koza RA, Chouljenko VN, Kousoulas KG, Rogers PM, Kesterson RA, Thearle M, Ferrante AW, Jr, Mynatt RL, Burris TP, Dong JZ, Halem HA, Culler MD, Heisler LK, Stephens JM, Butler AA. Identification of adropin as a secreted factor linking dietary macronutrient intake with energy homeostasis and lipid metabolism. Cell Metab. 2008;8:468–481. doi: 10.1016/j.cmet.2008.10.011. [DOI] [PMC free article] [PubMed] [Google Scholar]
- 38.Luo X, Zhang Y, Ruan X, Jiang X, Zhu L, Wang X, Ding Q, Liu W, Pan Y, Wang Z, Chen Y. Fasting-induced protein phosphatase 1 regulatory subunit contributes to postprandial blood glucose homeostasis via regulation of hepatic glycogenesis. Diabetes. 2011;60:1435–1445. doi: 10.2337/db10-1663. [DOI] [PMC free article] [PubMed] [Google Scholar]
- 39.Flowers MT, Ntambi JM. Stearoyl-CoA desaturase and its relation to high-carbohydrate diets and obesity. Biochim Biophys Acta. 2009;1791:85–91. doi: 10.1016/j.bbalip.2008.12.011. [DOI] [PMC free article] [PubMed] [Google Scholar]
- 40.Zhan YY, Chen Y, Zhang Q, Zhuang JJ, Tian M, Chen HZ, Zhang LR, Zhang HK, He JP, Wang WJ, Wu R, Wang Y, Shi C, Yang K, Li AZ, Xin YZ, Li TY, Yang JY, Zheng ZH, Yu CD, Lin SC, Chang C, Huang PQ, Lin T, Wu Q. The orphan nuclear receptor Nur77 regulates LKB1 localization and activates AMPK. Nat Chem Biol. 2012;8:897–904. doi: 10.1038/nchembio.1069. [DOI] [PubMed] [Google Scholar]
- 41.Niehrs C, Schafer A. Active DNA demethylation by Gadd45 and DNA repair. Trends in Cell Biology. 2012;22(4):220–227. doi: 10.1016/j.tcb.2012.01.002. [DOI] [PubMed] [Google Scholar]
- 42.Kim SC, Kim CK, Axe D, Cook A, Lee M, Li T, Smallwood N, Chiang JY, Hardwick JP, Moore DD, Lee YK. All-trans-retinoic acid ameliorates hepatic steatosis in mice by a novel transcriptional cascade. Hepatology. 2014;59:1750–1760. doi: 10.1002/hep.26699. [DOI] [PMC free article] [PubMed] [Google Scholar]
- 43.Yin X, Zheng F, Pan Q, Zhang S, Yu D, Xu Z, Li H. Glucose fluctuation increased hepatocyte apoptosis under lipotoxicity and the involvement of mitochondrial permeability transition opening. J Mol Endocrinol. 2015;55(3):169–81. doi: 10.1530/JME-15-0101. [DOI] [PubMed] [Google Scholar]
- 44.Waxman DJ, Holloway MG. Sex differences in the expression of hepatic drug metabolizing enzymes. Mol Pharmacol. 2009;76:215–228. doi: 10.1124/mol.109.056705. [DOI] [PMC free article] [PubMed] [Google Scholar]
- 45.Li X, Wang Y, Wang H, Huang C, Huang Y, Li J. Endoplasmic reticulum stress is the crossroads of autophagy, inflammation, and apoptosis signaling pathways and participates in liver fibrosis. Inflamm Res. 2015;64(1):1–7. doi: 10.1007/s00011-014-0772-y. [DOI] [PubMed] [Google Scholar]
- 46.Correia MA. Hepatic cytochrome P450 degradation: mechanistic diversity of the cellular sanitation brigade. Drug Metab Rev. 2003;35(2-3):107–43. doi: 10.1081/dmr-120023683. [DOI] [PubMed] [Google Scholar]
- 47.Kirpich IA, Gobejishvili LN, Bon Homme M, Waigel S, Cave M, Arteel G, Barve SS, McClain CJ, Deaciuc IV. Integrated hepatic transcriptome and proteome analysis of mice with high-fat diet-induced nonalcoholic fatty liver disease. J Nutr Biochem. 2011;22:38–45. doi: 10.1016/j.jnutbio.2009.11.009. [DOI] [PMC free article] [PubMed] [Google Scholar]
- 48.Ogasawara Y, Itakura E, Kono N, Mizushima N, Arai H, Nara A, Mizukami T, Yamamoto A. Stearoyl-CoA desaturase 1 activity is required for autophagosome formation. J Biol Chem. 2014;289(34):23938–50. doi: 10.1074/jbc.M114.591065. [DOI] [PMC free article] [PubMed] [Google Scholar]
- 49.Li F, Jiang C, Larsen MC, Bushkofsky JR, Krausz KW, Wang T, Jefcoate CR, Gonzalez FJ. Lipidomics reveals a link between CYP1B1 and SCD1 in promoting obesity. J Proteome Res. 2014;13:2679–2687. doi: 10.1021/pr500145n. [DOI] [PMC free article] [PubMed] [Google Scholar]
- 50.Ntambi JM, Miyazaki M, Stoehr JP, Lan H, Kendziorski CM, Yandell BS, Song Y, Cohen P, Friedman JM, Attie AD. Loss of stearoyl-CoA desaturase-1 function protects mice against adiposity. Proc Natl Acad Sci U S A. 2002;99:11482–11486. doi: 10.1073/pnas.132384699. [DOI] [PMC free article] [PubMed] [Google Scholar]
- 51.Waxman DJ, Pampori NA, Ram PA, Agrawal AK, Shapiro BH. Interpulse interval in circulating growth hormone patterns regulates sexually dimorphic expression of hepatic cytochrome P450. Proc Natl Acad Sci U S A. 1991;88:6868–6872. doi: 10.1073/pnas.88.15.6868. [DOI] [PMC free article] [PubMed] [Google Scholar]
- 52.Dongol B, Shah Y, Kim I, Gonzalez FJ, Hunt MC. The acyl-CoA thioesterase I is regulated by PPARalpha and HNF4alpha via a distal response element in the promoter. J Lipid Res. 2007;48:1781–1791. doi: 10.1194/jlr.M700119-JLR200. [DOI] [PubMed] [Google Scholar]
- 53.Tan HY, Huang L, Simmons D, Veldhuis JD, Steyn FJ, Chen C. Hypothalamic distribution of somatostatin mRNA expressing neurones relative to pubertal and adult changes in pulsatile growth hormone secretion in mice. J Neuroendocrinol. 2013;25(10):910–9. doi: 10.1111/jne.12078. [DOI] [PubMed] [Google Scholar]
- 54.Huang L, Steyn FJ, Tan HY, Xie TY, Veldhuis JD, Ngo ST, Chen C. The decline in pulsatile GH secretion throughout early adulthood in mice is exacerbated by dietary-induced weight gain. Endocrinology. 2012;153(9):4380–8. doi: 10.1210/en.2012-1178. [DOI] [PubMed] [Google Scholar]
- 55.Lee HS, Barraza-Villarreal A, Biessy C, Duarte-Salles T, Sly PD, Ramakrishnan U, Rivera J, Herceg Z, Romieu I. Dietary supplementation with polyunsaturated fatty acid during pregnancy modulates DNA methylation at IGF2/H19 imprinted genes and growth of infants. Physiol Genomics. 2014;46(23):851–7. doi: 10.1152/physiolgenomics.00061.2014. [DOI] [PMC free article] [PubMed] [Google Scholar]
- 56.Brock O, Keller M, Douhard Q, Bakker J. Female mice deficient in alpha-fetoprotein show female-typical neural responses to conspecific-derived pheromones. PLoS One. 2012;7(6):e39204. doi: 10.1371/journal.pone.0039204. [DOI] [PMC free article] [PubMed] [Google Scholar]
- 57.Jennings BL, George LW, Pingili AK, Khan NS, Estes AM, Fang XR, Gonzalez FJ, Malik KU. Estrogen metabolism by cytochrome P450 1B1 modulates the hypertensive effect of angiotensin II in female mice. Hypertension. 2014;64:134–140. doi: 10.1161/HYPERTENSIONAHA.114.03275. [DOI] [PMC free article] [PubMed] [Google Scholar]
- 58.Frank A, Brown LM, Clegg DJ. The role of hypothalamic estrogen receptors in metabolic regulation. Front Neuroendocrinol. 2014;35:550–557. doi: 10.1016/j.yfrne.2014.05.002. [DOI] [PMC free article] [PubMed] [Google Scholar]
- 59.Tanida M, Yamamoto N, Morgan DA, Kurata Y, Shibamoto T, Rahmouni K. Leptin Receptor Signaling in the Hypothalamus Regulates Hepatic Autonomic Nerve Activity via Phosphatidylinositol 3-Kinase and AMP-Activated Protein Kinase. J Neurosci. 2015;35:474–484. doi: 10.1523/JNEUROSCI.1828-14.2015. [DOI] [PMC free article] [PubMed] [Google Scholar]
- 60.Ramirez MC, Bourguignon NS, Bonaventura MM, Lux-Lantos V, Libertun C, Becu-Villalobos D. Neonatal xenoestrogen exposure alters growth hormone-dependent liver proteins and genes in adult female rats. Toxicol Lett. 2012;213:325–331. doi: 10.1016/j.toxlet.2012.07.015. [DOI] [PubMed] [Google Scholar]
Associated Data
This section collects any data citations, data availability statements, or supplementary materials included in this article.
Supplementary Materials
Fig. S1. Changes in microsomal protein expression across four treatment groups. Immunoblots of hepatic microsomal fractions corresponding to each treatment group. Relative protein densities for each treatment normalized to WT/LFD except for Cyp2c. For expression changes see Table 1, Table 2 and Supplementary Table S2.
Supplemental Table 2. Comprehensive list of liver gene responses divided by selectivity groups.
Data represents log2 fold change for each designated group.
Male (n=3) mice were fed the diets for 11 weeks post-weaning.
Supplemental Table 4. Function of select genes shown in Table 2.
NE represents no effect.
Supplemental Table 6. Complete list of Limma analyzed gene responses from dw36 female mice.