Abstract
Purpose
To assess outer retinal tubulation (ORT) morphology from spectral-domain optical coherence tomography (SD-OCT) volumes and donor eye histology, analyze ORT reflectivity, and estimate the number of cones surviving in ORT.
Methods
In SD-OCT volumes from nine patients with advanced AMD, ORT was analyzed en face and in B-scans. The hyperreflective ORT border in cross-section was delineated and surface area calculated. Reflectivity was compared between ORT types (Closed, Open, Forming, and Branching). A flatmount retina from a donor with neovascular AMD was labeled to visualize the external limiting membrane that delimits ORT and allow measurements of cross-sectional cone area, center-to-center cone spacing, and cone density. The number of cones surviving in ORT was estimated.
Results
By en face SD-OCT, ORT varies in complexity and shape. Outer retinal tubulation networks almost always contain Closed cross-sections. Spectral-domain OCT volumes containing almost exclusively Closed ORTs showed no significant direction-dependent differences in hyperreflective ORT border intensity. The surface areas of partial ORT assessed by SD-OCT volumes ranged from 0.16 to 1.76 mm2. From the flatmount retina, the average cross-sectional area of cone inner segments was 49.1 ± 7.9 μm2. The average cone spacing was 7.5 ± 0.6 μm. Outer retinal tubulation cone density was 20,351 cones/mm2. The estimated number of cones in ORT in a macula ranged from 26,399 to 186,833 cones, which is 6% to 44% of the cones present in a healthy macula.
Conclusions
These first estimates for cone density and number of cones surviving in ORT suggest that ORT formation considerably distorts the photoreceptor mosaic. Results provide additional insight into the reflectivity characteristics and number of ORT cones observable in living patients by SD-OCT, as cones persist and disease progresses.
Keywords: spectral-domain optical coherence tomography, photoreceptors, cones, Müller cells, age-related macular degeneration, outer retinal tubulation, ellipsoid, histology
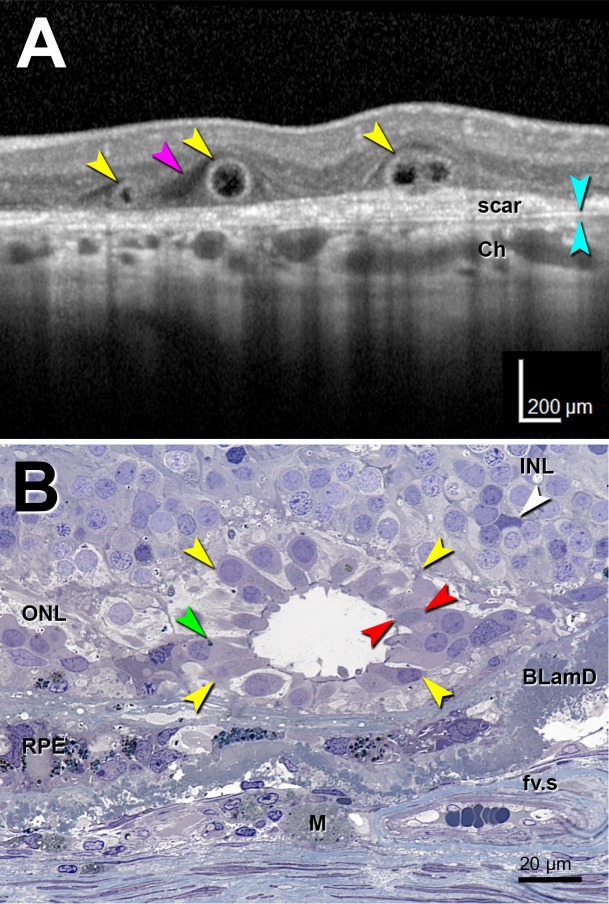
Spectral-domain optical coherence tomography (SD-OCT) allows for in vivo detection of disease progression in high-resolution cross-sectional scans of the retina and choroid.1 One feature detectable by SD-OCT is outer retinal tubulation (ORT), which is commonly found in advanced age-related macular degeneration (AMD)2–6 and some inherited retinal diseases.2,7–9 Outer retinal tubulation contains degenerating photoreceptors, mostly long- and middle-wavelength–sensitive cones,10 and gliotic Müller cells forming the external limiting membrane (ELM) (Fig. 1B). Tubular and sometimes branching structures,6,10 ORT shape has been described2-4 as pseudodendritic over disciform scars in neovascular AMD and perilesional bordering atrophic areas in geographic atrophy.4 Outer retinal tubulation is identified in SD-OCT B-scans as a hyperreflective circular or ovoid profile with a hyporeflective center, located in the outer nuclear layer (ONL) (Fig. 1A).2,6 The hyporeflective center corresponds to the lumen of the ORT network. The hyperreflective ORT border in SD-OCT B-scans corresponds to a combination of the ELM and mitochondria.6,11,12 Mitochondria comprise 75% of the cone inner segment volume13 and are thought to contribute to inner segment optical properties, via light scattering consistent with Mie theory.14–16 We previously have called the characteristic reflective feature of an ORT a border.6,11 It is not in fact a histologic border, but rather, it is attributable to the aggregate reflectivity of translocating inner segment mitochondria and the ELM.11 Therefore, in this report, we used the term “band.”
Figure 1.
Optical coherence tomography imaging and histology of outer retinal tubulation. Outer retinal tubulation cross-sections (yellow arrowheads). (A) Representative SD-OCT B-scan of three ORT cross-sections from TCS1 volume from an 81-year-old woman with neovascular AMD. Two Closed ORTs on the left, and a Branching ORT on the right. Hyporeflective wedge38 (pink arrowhead); Bruch's membrane (cyan arrowheads). (B) High-resolution histology section of degenerate cones in ORT, at 1.5 mm from the fovea from a different 81-year-old woman with neovascular AMD. Cone lipofuscin (green arrowhead); mitochondria in outer fiber39 (red arrowheads); Müller cell body (white arrowhead). BLamD, basal laminar deposit; Ch, choroid; fv.s, fibrovascular scar; INL, inner nuclear layer; M, lipid-containing macrophage; RPE, entombed and melanotic retinal pigment epithelium.40
Eyes with ORT typically have poor visual acuity due to outer retinal damage secondary to geographic atrophy and choroidal neovascularization.17 Treatment with anti-VEGF resolves hemorrhage and fluid, but damage to the outer retina remains and ORT is one of its manifestations. Relatively stable over a period of years,3 ORT undergoes natural involution as cones degenerate in phases.6 In ORT, cones degenerate by losing their outer segments, followed by inner segment shrinkage and retraction, and presumed mitochondrial fission and migration toward the soma. Only the ELM remains at the end-stage, when the cones are gone.6,12 At the ORT end-stage, the ELM consists of cytoskeleton-rich plaques in adherens junctions among Müller cells persisting after the cones die.6,18,19 However, the number of cones participating in ORT and the overall surface area of ORT is difficult to determine from the single-section, single-time-point histology of human donor eyes that we have previously provided.6,11,12
In this study, we used morphometric analysis of SD-OCT volumes and a human donor eye flatmount retina to illustrate and quantify characteristics of ORT, including a description of ORT shape in en face images and B-scans, intensity of the reflective ORT band, estimates for the area, center-to-center spacing, spatial density, and the number of surviving cones in an ORT. Because of our initial impressions of variations in the intensity circumscribing the ORT lumen in cross-section at the level of translocating mitochondria according to histology, we checked the intensity of reflectivities around the ORT band in cross-section. New data on the morphology and reflectivity characteristics of the ORT network may provide insight into ORT development and stability. This analysis may enhance our knowledge about macular cone degeneration and disease progression, not only in AMD, but also in other inherited retinal diseases displaying ORT,8 and inform future considerations about neuroprotective strategies.
Methods
This research adhered to the tenets of the Declaration of Helsinki and was approved by the Institutional Review Board at the University of Alabama at Birmingham and the Western Institutional Review Board.
Spectral-Domain Optical Coherence Tomography Volumes
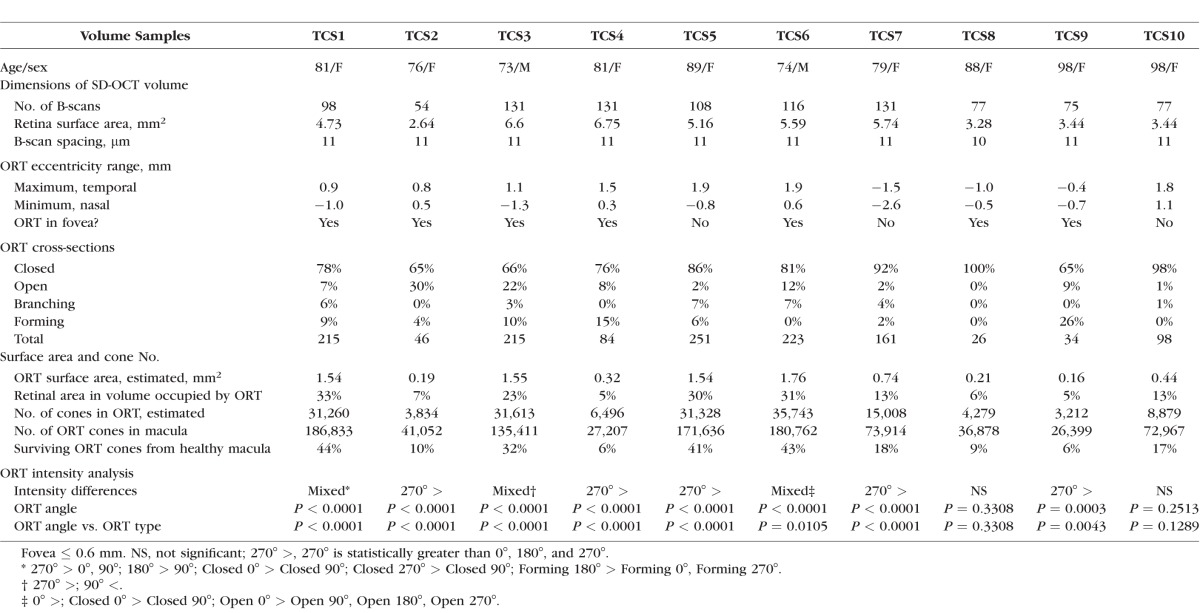
Ten macular SD-OCT volumes (Heidelberg Spectralis; Heidelberg Engineering, Heidelberg, Germany) from 10 eyes of nine patients (82.1 ± 8.2 years, seven women, two men) with ORT associated with neovascular AMD were acquired at Vitreous Retina Macula Consultants of New York (Table). The SD-OCT volumes are identified as tubulation cross-section (TCS) 1 through TCS10 in the Table. The spacing between B-scans in the SD-OCT volumes was 11 μm unless otherwise noted. The width of the B-scans was 15° in all volumes. Outer retinal tubulation rendered by OCT B-scans are referred to as ORT cross-sections. Outer retinal tubulations viewed en face are referred to as ORT networks. En face images for each SD-OCT volume were generated with the 3D View Transverse option in the Heidelberg Spectralis software (version 1.9.10.0), with a representative transverse plane selected to maximize the view of the ORT network in each SD-OCT volume. En face images were overlaid on infrared reflectance images in the Heidelberg Spectralis software.
Table.
Quantitative Analysis of Outer Retinal Tubulation in Spectral-Domain Optical Coherence Tomography Volumes
Spectral-domain OCT volumes were analyzed with custom image reconstruction software using ImageJ (http://imagej.nih.gov/ij/; provided in the public domain by the National Institutes of Health, Bethesda, MD, USA), Java, and FIJI.20 Custom plugins are available from the authors upon request. The inner and outer aspects of each hyperreflective ORT band cross-section were manually delineated with polygons, using a custom ImageJ plugin (Fig. 2). The delineation of the hyperreflective ORT band did not include hyperreflectivity in the lumen (attributable to free-floating cells). To create a three-dimensional ORT model, the inner and outer polygon delineations were converted to a stack by a custom Java program and then a surface model by using FIJI.20 The surface model was smoothed and displayed by using MeshLab (http://meshlab.sourceforge.net; by the 3D-CoForm Project). Numerical measurements (described below) were made by using the raw polygonal data. The image of the smoothed surface model is for illustration only.
Figure 2.
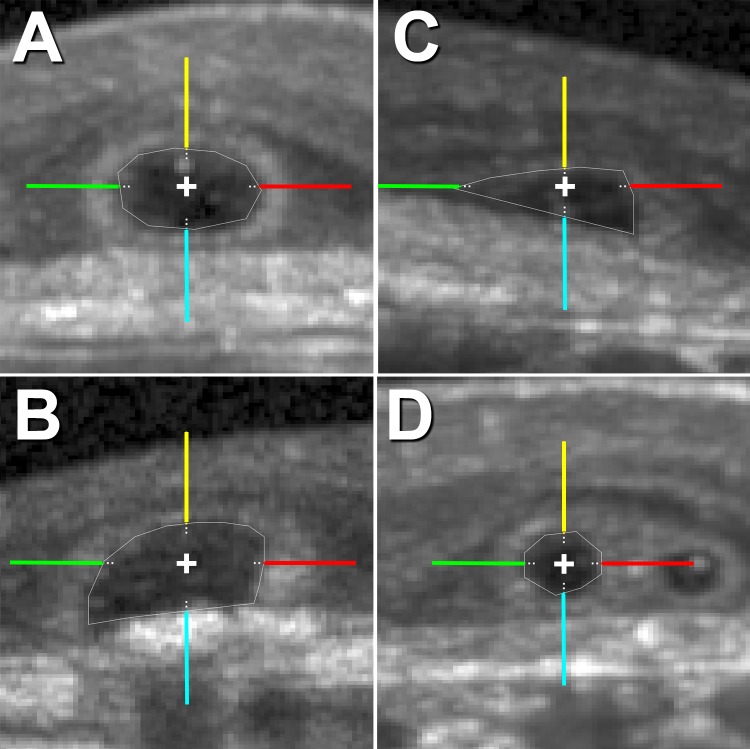
Outer retinal tubulation types in cross-section for intensity analysis. In cross-sections, ORT is identified as Closed (A), Open (B), Forming (C), or Branching (D). For the intensity analysis, hyperreflective ORT bands in cross-sections were sampled at 0° (red), 90° (yellow), 180° (green), and 270° (cyan). Raw (linear) SD-OCT intensity (ranging from 0–1 in a 32-bit image) by ORT type and angle was sampled at 5-μm steps from the inner aspect of ORT band along the colored lines, and the average first maximum intensity value is reported in Figure 5 and Supplementary Figure S2 for each SD-OCT volume. Each line of the cross in the centroid of ORT cross-sections is 20 μm long.
In each B-scan of the 10 SD-OCT volumes, all delineated ORT cross-sections were labeled as Closed, Open, Forming, or Branching, as follows.6 Closed ORT is a hyporeflective space completely surrounded by a hyperreflective band (Fig. 2A).6 Open ORT is a hyporeflective space surrounded by a hyperreflective band that does not connect on the outer aspect (Fig. 2B).6 Forming ORT is a free edge that scrolls into an ORT cross-section in adjacent B-scans (Fig. 2C).6 Branching ORT is multiple hyporeflective lumens with a common hyperreflective band (Fig. 2D). Individual ORT cross-sections seen as separated in adjacent scans were marked as branching when their hyperreflective bands appear to overlap.
Outer Retinal Tubulation Intensity and Statistical Analyses
Because of our initial impressions of variations in the intensity of the hyperreflective ORT band in cross-section surrounding the ORT lumen, we sought a difference in the intensity around circular or ovoid ORT bands in cross-section. The polygonal delineations described above were superimposed onto their respective ORT cross-sections and centered in a 1024 × 1024-pixel window, where each pixel ranged from 5.14 to 5.82 μm depending on the SD-OCT volume. From these images, raw (linear) SD-OCT intensity (0–1 gray values for a 32-bit image) was sampled at 90° angles (180° vitreal, 270° scleral) around all hyperreflective ORT bands at 5-μm steps from their inner aspects for 100 μm (Fig. 2). The first maximum intensity value at each angle was used to represent the hyperreflective ORT band at that angle for subsequent analysis.
One-way analysis of variance (ANOVA) was performed per SD-OCT volume among angles to test whether mean maximum intensity values differed from each other, under the null hypothesis that all ORT angles had the same intensity. Post hoc Tukey's Honestly Significant Difference test was performed to determine which group means differed. For SD-OCT volumes with more than one ORT type, a multiple-way ANOVA was also performed between the interaction of ORT type and angle to test whether at least one mean maximum intensity value differed from each other, under the null hypothesis that all interactions of ORT type and angle had the same intensity. Mean maximum intensity values and 95% confidence intervals are reported for comparisons between groups for each volume. Statistical analysis was performed with Matlab software (MathWorks, Natick, MA, USA). For all tests, P < 0.05 was considered significant.
Histology
As recently described,21 an eye from an 86-year-old Caucasian female donor with neovascular AMD, preserved 4.2 hours after death, was prepared as a 20 × 20-mm square tissue flatmount, including the macula and near periphery. The flatmount, which included retina still attached to the RPE and Bruch's membrane, was labeled with Alexa 647 Phalloidin (Life Technologies, Grand Island, NY, USA) to visualize the filamentous-actin (f-actin) cytoskeleton in the ELM meshwork through which ORT cones point into the lumen.18,19 Tissue was imaged with confocal epifluorescence microscopy (BX51; Olympus, Tokyo, Japan) at λex = 488 nm, as previously described.21,22 This wavelength excitation reveals lipofuscin in RPE, cones, and other retinal neurons.23,24 Images were composited by using the internal software of the microscope (cellSens, version 7; Olympus).21,22
Calculations
In the flatmount retina, for eight locations with ORT, the cross-sectional area of cone inner segments was approximated by the area of hexagonal gaps in the ELM meshwork. Assuming triangular cone packing, center-to-center cone spacing was calculated as  (see Supplementary Fig. S1 for derivation). The spatial density of cones within ORT (cells/mm2) was determined from the inverse of the cross-sectional cone area.
The surface area of the retina covered by the SD-OCT volume was calculated by multiplying the length and width (pattern size from the Heidelberg Spectralis software) of the volume. To estimate the surface area of the partial ORT network in each SD-OCT volume, a surface at the ELM was approximated by constructing an offset polygon 5 μm abluminal from the inner polygon in each B-scan. The ORT surface area was calculated by multiplying the perimeter of each offset polygon by the distance between successive B-scans. The number of cones in each partial ORT network was estimated by using the surface area from each SD-OCT volume and cross-sectional area of cone inner segments determined from the flatmount retina. For comparison to the number of cones in a healthy macula with a diameter of ∼21° (6 mm), the estimated number of cones in each partial ORT network was corrected by the ratio between the area of normal macula and the area covered by the SD-OCT volume. This correction assumes that the entire macula has the same coverage by ORT as in the SD-OCT volume. Outer retinal tubulation eccentricity was calculated as the distance from the center of each ORT cross-section on each B-scan to the designated foveal B-scan. For the ORT cross-sections in each SD-OCT volume, the eccentricity range from nasal to temporal is reported.
Results
In this study, we used 10 SD-OCT volume scans from nine patients with advanced AMD (Table) to assess ORT dimensions and histology of one donor eye to estimate cone density and number of cones surviving in ORT.
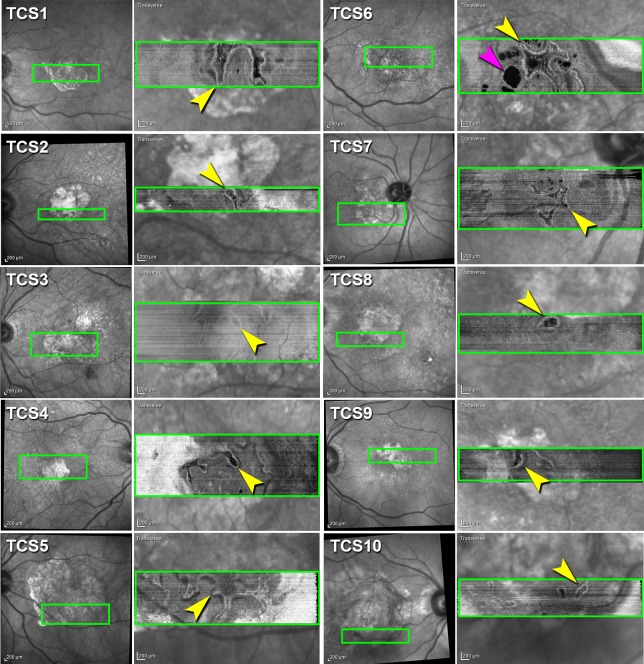
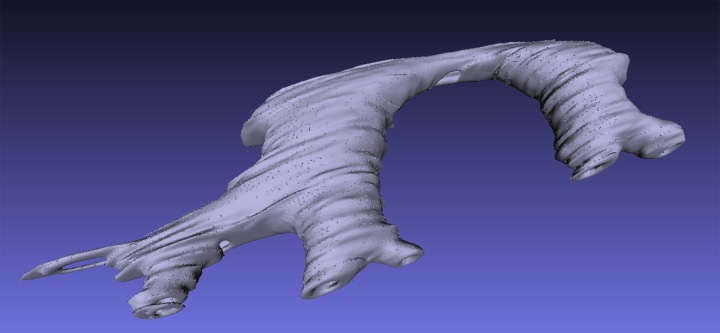
En face SD-OCT imaging of high-density volumes connects hyperreflective ORT bands in cross-sections and hyporeflective ORT lumens into a vast network (Fig. 3). Similar to ORT cross-sections in B-scans, ORT viewed in en face is a hyporeflective lumen surrounded by a hyperreflective band, and distinguishable from a cyst (Fig. 3, TCS6). These en face ORT networks vary from small tubes to complex branching cavitary spaces (Fig. 3). Similar to an en face view, the ORT network in an SD-OCT volume can be visualized in a 3D model (Fig. 4). The model represents the manual delineation of the hyperreflective ORT band in cross-sections, stacked together.
Figure 3.
Outer retinal tubulation varies in size and shape by SD-OCT en face reconstruction. Infrared reflectance (IR) images of 10 eyes (first and third columns). Green box is location of en face transverse reconstruction image from each of 10 SD-OCT volumes (Heidelberg Spectralis) of nine patients with neovascular AMD showing ORT network (yellow arrowheads) overlaid on IR image (second and fourth columns). Cyst (pink arrowhead).
Figure 4.
Reconstruction of outer retinal tubulation. Three-dimensional reconstruction of ORT generated from ORT cross-sections in SD-OCT B-scans of TCS1.
A total of 1353 ORT cross-sections were analyzed in 998 B-scans of 10 SD-OCT volumes (Table). Through a SD-OCT volume, the shape and size of ORT cross-sections can differ (Table and Supplementary Fig. S2). For example, one ORT (TCS3) contained 66% Closed, 22% Open, 3% Branching, and 10% Forming cross-sections, whereas, another ORT (TCS8) contained 100% Closed cross-sections (Table). The percentages of ORT types in cross-section for all volumes analyzed are listed in the Table.
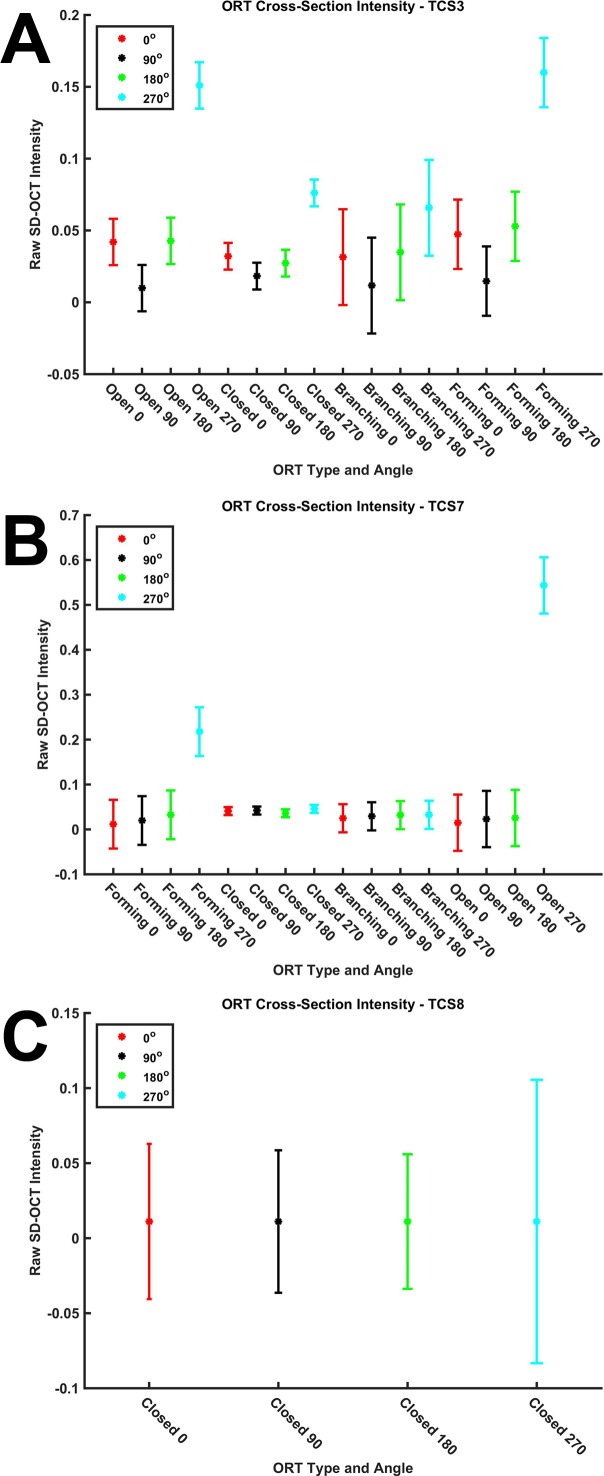
To determine if the intensity of the hyperreflective ORT band in cross-section varies with angle, we sampled intensities at 90° angles around all hyperreflective ORT bands as described in Methods (Fig. 2 and Supplementary Fig. S2, blue boxes). The maximum intensity value of the ORT band for each ORT type (Closed, Open, Branching, Forming) and angle (0°, 90°, 180°, 270°) sampled varied slightly through an ORT (Fig. 5 and Supplementary Fig. S2). Three SD-OCT volumes (TCS1, TCS3, TCS6) had mixed results (Fig. 5A). In half of the SD-OCT volumes, the intensity at 270° was significantly higher, since Forming and Open ORT cross-sections (Fig. 5B) lack a connected hyperreflective band and allowed signal to be captured by highly reflective scars lying between the ORT and Bruch's membrane. Two SD-OCT volumes (TCS8, TCS10) had no significant differences in ORT band intensity at any multiple of 90° (Fig. 5C; Table). Spectral-domain OCT volumes containing almost exclusively Closed ORT (TCS8, TCS10) showed no significant variation in ORT band intensity with angle. Figure 5 shows three representative examples of intensity differences. Data for SD-OCT volumes, TCS1 through TCS10, are in Supplementary Figure S2.
Figure 5.
Variation in hyperreflective outer retinal tubulation band in cross-section. From ORT cross-sections (examples in Figure 2), hyperreflective ORT band intensity was sampled. Average raw (linear) SD-OCT intensity (ranging from 0–1 in a 32-bit image) of intensity representing hyperreflective ORT band for each ORT type and angle in an SD-OCT volume. Representative examples of mixed intensity results (A), only 270° as significant (B), and no significant differences between angles (C). Error bars: 95% confidence interval for comparison between groups within an SD-OCT volume.
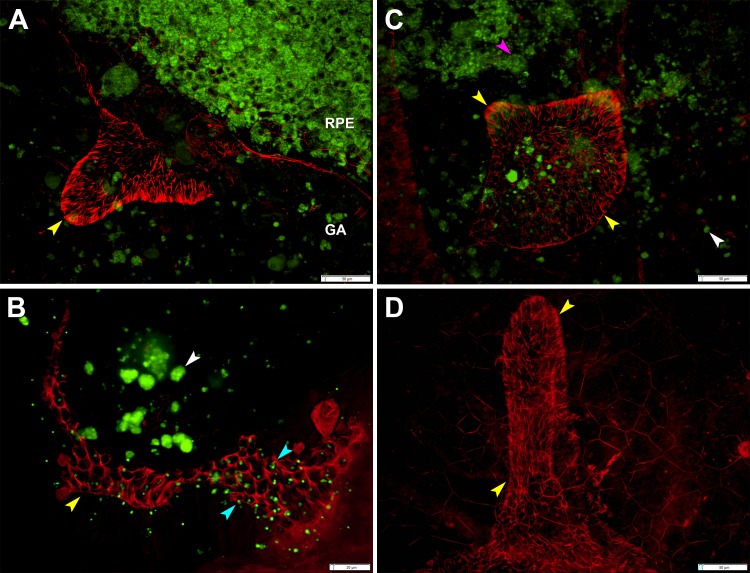
In a flatmount retina from a donor with neovascular AMD, ORT was viewed en face and visualized by the ELM cytoskeleton meshwork (Fig. 6, red). Autofluorescent lipofuscin (Fig. 6, green) was located in four places: RPE cells of an intact RPE layer near an atrophic area (Fig. 6A), in individual dissociated RPE25 (Fig. 6C), as granule aggregates shed from apparently apoptotic RPE (Fig. 6B), and in individual cone inner segments passing through gaps of the ELM meshwork (Fig. 6B).25 Outer retinal tubulation abutting the edge of atrophy may appear as a finger-like projection into the atrophic area (Fig. 6D), similar to the shape of ORT identified in en face SD-OCT images (Fig. 3, TCS4). Each gap in the ELM meshwork is occupied by a single cone pointing toward the lumen, and the cone inner segments tile the lumenal surface of a Closed ORT in a hexagonal packing arrangement. Mean cross-sectional area for cone inner segments at the ELM of this ORT was 49.1 ± 7.9 μm2. Center-to-center cone spacing was 7.5 ± 0.6 μm. The spatial density of ORT cones was 20,351 cones/mm2.
Figure 6.
Outer retinal tubulation in a flatmount retina. (A) Outer retinal tubulation (yellow arrowheads) marked by ELM cytoskeleton meshwork at the border of geographic atrophy (GA) 5.5 mm from the fovea. (B) Autofluorescent cone lipofuscin granules (cyan arrowheads) in ELM meshwork through which ORT cones point into lumen at 2.6 mm from fovea. Retinal pigment epithelium granule aggregates (white arrowheads). (C) Outer retinal tubulation overlying dissociated RPE25 at 5.1 mm from the fovea. Spherical RPE cell in the process of degranulating (pink arrowhead). (D) Outer retinal tubulation of different morphology at 4 mm from fovea; RPE autofuorescence is not shown. Tissue from 86-year-old woman with neovascular AMD, labeled with Alexa 647 Phalloidin. Lipofuscin is shown by 488-nm autofluorescence. (A–D) were used, with others, to calculate cross-sectional cone area (49.1 ± 7.9 μm2), center-to-center cone spacing (7.5 ± 0.6 μm), and cone density (20,351 cones/mm2) in ORT.
From the SD-OCT volumes, which cover part of the macula as shown in Figure 3, the estimated ORT surface area at the ELM ranged from 0.16 to 1.76 mm2 (Table). The estimated number of cones in partial ORT at eccentricities from 0.3 to 2.6 mm ranged from 3212 to 35,743 cones (Table). Assuming the entire macula is covered by ORT to the same degree indicated in the partial SD-OCT volume, the number of ORT cones in one advanced AMD macula ranged from 26,399 to 186,833 (Table).
Discussion
Variation in ORT
This study provides the first quantitative measurements of ORT, including estimates for morphologic variants, intensity of the hyperreflective ORT band, cone density, and number of surviving cones, some of which may be capable of supporting vision in ORT in advanced AMD. Commonly identified in SD-OCT B-scans from patients with advanced AMD2–6 and some inherited diseases with photoreceptor and RPE damage or loss,2,7–9 ORT can be best understood as connecting caverns containing degenerating cone photoreceptors interleaved by Müller cells, lining the walls.
The variation in size and shape of ORT cross-sections in SD-OCT B-scans and transverse sections in SD-OCT en face images may provide insight into the dynamism and stability of ORT as they evolve over years.3 Outer retinal tubulations have been imaged transversely and described qualitatively in other studies.2–4 The ORT networks in this study range from tubes to branching networks. Perilesional ORT was observed in a location in the flatmount retina (Fig. 6A). Not all of the ORT networks over scars in retinas with neovascular AMD in this study are considered pseudodendritic.4 Half of the SD-OCT volumes (Fig. 2; TCS1, TCS3, TCS5, TCS6, TCS7) may be considered pseudodendritic4 and advanced owing to their multiple branches. Although the SD-OCT volumes included here did not include the entire ORT network in each retina, we can still get a sense of their topography when viewed en face and in cross-sections. The distribution of ORT types in SD-OCT B-scans and complexity of ORT en face may hint at the stability of ORT over time. In these SD-OCT volumes, Closed ORT dominated over other forms and thus seems to represent a more stable formation of ORT, whereas less common Open and Forming ORT cross-sections may be more transient. As Müller cells seem to be prime movers in ORT formation by sealing off cones from the RPE–Bruch's complex and remaining until the end,6 Forming ORT may be the most dynamic of the ORT types. Longitudinal monitoring on the time course of years with high-density SD-OCT scans would be required, as ORT are anticipated to involute slowly.3 How ORT networks acquire different shapes en face or how ORT cross-sections transition between ORT types will require future research.
As the size and shape of ORT cross-sections vary, so does the intensity of the ORT band in cross-section. The source of reflectivity contributing to the hyperreflective ORT band in SD-OCT B-scans has been attributed to a combination of migrating mitochondria, which are light scatterers,13,26 within the inner segments and the gliotic Müller cells forming the ELM.6,11,12 Because of the combination of reflectivity-generating signal of the ORT band, we sought a difference in the intensity around the ORT band in cross-section. However, this analysis did not reveal a consistent trend with the intensity of the ORT band. The two SD-OCT volumes that contained almost all Closed ORT showed no difference in the ORT band intensity. The variability of the Forming and Open ORT bands and underlying scars misaligning ORT on top of them may affect their reflectivity in SD-OCT B-scans. If there was any residual waveguiding not captured by conventional SD-OCT, directional OCT27 could provide more insight into the reflectivity of forming ORT and ORT tilted by underlying scar, which may appear differently with off-axis reflectivity. Understanding reflectivity in multimodal imaging may be important in determining the viability of cones in ORT and their capacity for vision. A decrease in the intensity of band 2, currently referred to as the ellipsoid zone,28 has been shown to correspond with decreased cone function.29 Additionally, the intensity of band 2 has been shown to correlate with retinal function by multifocal electroretinography.30 Additional exploration is needed to understand the relationship between the intensity of the ORT band and state of cone degeneration in the ORT band.
Number of Cones in ORT
In this study, the retina surface area included in SD-OCT volumes ranged from 2.64 mm2 to 6.75 mm2 of the 28.27 mm2 area of a macula (3-mm radius). In these SD-OCT volumes, ORTs took up 5% to 33% of the retina imaged (Table), which could contain some of the last surviving cones in the macula. In this study, the average center-to-center cone spacing measured from a single flat mounted ORT, assuming triangular packing, was 7.5 ± 0.6 μm. This result is a plausible diameter for cone inner segments in the macula, compared to previous measurements in histology and in living human eyes with split-detection adaptive optics scanning light ophthalmoscopy.31
In this study, average ORT cone density was calculated to be 20,351 cones/mm2, based on a flatmount retina with eccentricities varying between 2.2 and 5.5 mm. In a healthy retina at these eccentricities, cone density is 11,189 cones/mm2 at 2 mm and 5,901 cones/mm2 at 5 mm.32 In a healthy fovea, mean peak cone density is 197,000 cones/mm2.33 In older people, foveal cone densities range from 116,600 to 210,000 cones/mm2,33 depending on eccentricity. Many studies34–36 have calculated cone density in the living human eye. By adaptive optics scanning laser ophthalmoscopy, peak cone density has been calculated to range from 136,132 to 247,061 cones/mm2 in a cohort of young adults.34 As compared to healthy maculas, cone density in ORT is decreased relative to the fovea and increased relative to the perifovea, suggesting considerable distortion of the photoreceptor mosaic, as suggested by histology.6,10
The estimated number of surviving cones in partial ORT captured by SD-OCT, with eccentricities from 0.3 to 2.6 mm, ranged from 3212 to 35,743 cones, and the estimated number of surviving cones in ORT in an entire macula ranged from 26,399 to 186,833, which is 6% to 44% of the 421,000 cones in a 6-mm-diameter healthy macula (Table).32 Identifying that cones persist in ORT in areas of atrophy,11 or over disciform scars,10 may lead to future detection by adaptive optics–assisted retinal imaging. If surviving cones in ORT are identified by adaptive optics–assisted retinal imaging, the cone density will be significantly less than that in a healthy retina. In vivo multimodal imaging of ORT will allow longitudinal monitoring of disease progression and microscopic in vivo timeline of cone degeneration.
Limitations and Conclusions
This study had limitations. The manual delineations of ORT in B-scans may introduce errors. Since there is no validated automatic segmentation software to identify ORT, our study was a first step toward future automation. Subretinal scarring makes generating en face images challenging, since in some retinas ORT cross-sections are not in the same transverse plane. Therefore, it may not be possible to view entire ORT networks in the same en face image. Intensity of the hyperreflective ORT band was sampled on a linear scale at intervals that could result in oversampling. Additionally, we identified ORT in one flatmount donor retina, and more specimens would certainly be desirable.
Nonetheless, we were able to provide insight into ORT as a network of various shapes and intensity in cross-section, and estimate the number of cones surviving in ORT. Outer retinal tubulation inception and longitudinal dynamics, including specific criteria for detecting and measuring ORT change in clinical SD-OCT scans, are yet to be elucidated. However, these results provide additional insight into the reflectivity and cones of ORT, a distinctive process of neurodegeneration and gliosis, observable in living patients by SD-OCT, as cone photoreceptors persist and disease progresses. Although we studied ORT in AMD, what we learned can inform the understanding, diagnosis, treatment, and prevention of many diseases involving macular cones that degenerate, such as choroideremia, now the subject of a gene therapy trial.37 Future monitoring of ORT could inform the future considerations about neuroprotective strategies.
Supplementary Material
Acknowledgments
The authors thank Karen Schaal, MD, for helpful discussions.
Presented at the annual meeting of the Association for Research in Vision and Ophthalmology, Denver, Colorado, United States, May 2015.
Supported by Vision Science Graduate Program (KML), National Institutes of Health (NIH) Grant EY06019 (CAC), DFG (German Research Foundation) AC265/1-1 and AC265/2-1 (TA), NIH EY024378 (YZ), unrestricted funds to the Department of Ophthalmology from Research to Prevent Blindness and EyeSight Foundation of Alabama (CAC, YZ); Macula Foundation, Inc., (KBF); acquisition of donor eyes received additional support from International Retinal Research Foundation, National Eye Institute P30 EY003039, and the Arnold and Mabel Beckman Initiative for Macular Research.
Disclosure: K.M. Litts, None; T. Ach, None; K.M. Hammack, None; K.R. Sloan, None; Y. Zhang, None; K.B. Freund, Genetech (C), Heidelberg Engineering (C), Regeneron (C), Thrombogenics and Bayer HeathCare (C); C.A. Curcio, Genetech (C), Janssen Cell Therapy (C), Merck (C), Novartis (C)
References
- 1. Adhi M,, Duker JS. Optical coherence tomography—current and future applications. Curr Opin Ophthalmol. 2013; 24: 213–221. [DOI] [PMC free article] [PubMed] [Google Scholar]
- 2. Zweifel SA,, Engelbert M,, Laud K,, Margolis R,, Spaide RF,, Freund KB. Outer retinal tubulation: a novel optical coherence tomography finding. Arch Ophthalmol. 2009; 127: 1596–1602. [DOI] [PubMed] [Google Scholar]
- 3. Jung JJ,, Freund KB. Long-term follow-up of outer retinal tubulation documented by eye-tracked and en face spectral-domain optical coherence tomography. Arch Ophthalmol. 2012; 130: 1618–1619. [DOI] [PubMed] [Google Scholar]
- 4. Wolff B,, Matet A,, Vasseur V,, Sahel JA,, Mauget-Faysse M. En face OCT imaging for the diagnosis of outer retinal tubulations in age-related macular degeneration. J Ophthalmol. 2012; 2012: 542417. [DOI] [PMC free article] [PubMed] [Google Scholar]
- 5. Moussa K,, Lee JY,, Stinnett SS,, Jaffe GJ. Spectral domain optical coherence tomography-determined morphologic predictors of age-related macular degeneration-associated geographic atrophy progression. Retina. 2013. ; 33: 1590–1599. [DOI] [PubMed] [Google Scholar]
- 6. Schaal KB,, Freund KB,, Litts KM,, Zhang Y,, Messinger JD,, Curcio CA. Outer retinal tubulation in advanced age-related macular degeneration: optical coherence tomographic findings correspond to histology. Retina. 2015; 35: 1339–1350. [DOI] [PMC free article] [PubMed] [Google Scholar]
- 7. Goldberg NR,, Greenberg JP,, Laud K,, Tsang S,, Freund KB. Outer retinal tubulation in degenerative retinal disorders. Retina. 2013. ; 33: 1871–1876. [DOI] [PMC free article] [PubMed] [Google Scholar]
- 8. Iriyama A,, Aihara Y,, Yanagi Y. Outer retinal tubulation in inherited retinal degenerative disease. Retina. 2013. ; 33: 1462–1465. [DOI] [PubMed] [Google Scholar]
- 9. Fujinami K,, Sergouniotis PI,, Davidson AE,, et al. Clinical and molecular analysis of Stargardt disease with preserved foveal structure and function. Am J Ophthalmol. 2013; 156: 487–501. [DOI] [PubMed] [Google Scholar]
- 10. Curcio CA,, Medeiros NE,, Millican CL. Photoreceptor loss in age-related macular degeneration. Invest Ophthalmol Vis Sci. 1996; 37: 1236–1249. [PubMed] [Google Scholar]
- 11. Litts KM,, Messinger JD,, Dellatorre K,, Yannuzzi LA,, Freund KB,, Curcio CA. Clinicopathological correlation of outer retinal tubulation in age-related macular degeneration. JAMA Ophthalmol. 2015; 133: 609–612. [DOI] [PubMed] [Google Scholar]
- 12. Litts KM,, Messinger JD,, Freund KB,, Zhang Y,, Curcio CA. Inner segment remodeling and mitochondrial translocation in cone photoreceptors in age-related macular degeneration with outer retinal tubulation. Invest Ophthalmol Vis Sci. 2015; 56: 2243–2253. [DOI] [PMC free article] [PubMed] [Google Scholar]
- 13. Hoang QV,, Linsenmeier RA,, Chung CK,, Curcio CA. Photoreceptor inner segments in monkey and human retina: mitochondrial density, optics, and regional variation. Vis Neurosci. 2002; 19: 395–407. [DOI] [PubMed] [Google Scholar]
- 14. Wilson JD,, Cottrell WJ,, Foster TH. Index-of-refraction-dependent subcellular light scattering observed with organelle-specific dyes. J Biomed Opt. 2007; 12: 014010. [DOI] [PubMed] [Google Scholar]
- 15. Wilson JD,, Bigelow CE,, Calkins DJ,, Foster TH. Light scattering from intact cells reports oxidative-stress-induced mitochondrial swelling. Biophys J. 2005. ; 88: 2929–2938. [DOI] [PMC free article] [PubMed] [Google Scholar]
- 16. Wilson JD,, Foster TH. Mie theory interpretations of light scattering from intact cells. Opt Lett. 2005; 30: 2442–2444. [DOI] [PubMed] [Google Scholar]
- 17. Lee JY,, Folgar FA,, Maguire MG,, et al. Outer retinal tubulation in the Comparison of Age-Related Macular Degeneration Treatments Trials (CATT). Ophthalmology. 2014; 121: 2423–2431. [DOI] [PMC free article] [PubMed] [Google Scholar]
- 18. Williams DS,, Arikawa K,, Paallysaho T. Cytoskeletal components of the adherens junctions between the photoreceptors and the supportive Muller cells. J Comp Neurol. 1990; 295: 155–164. [DOI] [PubMed] [Google Scholar]
- 19. Omri S,, Omri B,, Savoldelli M,, et al. The outer limiting membrane (OLM) revisited: clinical implications. Clin Ophthalmol. 2010; 4: 183–195. [DOI] [PMC free article] [PubMed] [Google Scholar]
- 20. Schindelin J,, Arganda-Carreras I,, Frise E,, et al. Fiji: an open-source platform for biological-image analysis. Nat Methods. 2012. ; 9: 676–682. [DOI] [PMC free article] [PubMed] [Google Scholar]
- 21. Ach T,, Tolstik E,, Messinger JD,, Zarubina AV,, Heintzmann R,, Curcio CA. Lipofuscin redistribution and loss accompanied by cytoskeletal stress in retinal pigment epithelium of eyes with age-related macular degeneration. Invest Ophthalmol Vis Sci. 2015; 56: 3242–3252. [DOI] [PMC free article] [PubMed] [Google Scholar]
- 22. Ach T,, Huisingh C,, McGwin G,, Jr, et al. Quantitative autofluorescence and cell density maps of the human retinal pigment epithelium. Invest Ophthalmol Vis Sci. 2014; 55: 4832–4841. [DOI] [PMC free article] [PubMed] [Google Scholar]
- 23. Iwasaki M,, Inomata H. Lipofuscin granules in human photoreceptor cells. Invest Ophthalmol Vis Sci. 1988; 29: 671–679. [PubMed] [Google Scholar]
- 24. Tucker GS. Refractile bodies in the inner segments of cones in the aging human retina. Invest Ophthalmol Vis Sci. 1986; 27: 708–715. [PubMed] [Google Scholar]
- 25. Zanzottera EC,, Messinger JD,, Ach T,, Smith RT,, Freund KB,, Curcio CA. The Project MACULA Retinal Pigment Epithelium Grading System for Histology and Optical Coherence Tomography in Age-Related Macular Degeneration. Invest Ophthalmol Vis Sci. 2015; 56: 3253–3268. [DOI] [PMC free article] [PubMed] [Google Scholar]
- 26. Spaide RF,, Curcio CA. Anatomical correlates to the bands seen in the outer retina by optical coherence tomography: literature review and model. Retina. 2011. ; 31: 1609–1619. [DOI] [PMC free article] [PubMed] [Google Scholar]
- 27. Lujan BJ,, Roorda A,, Knighton RW,, Carroll J. Revealing Henle's fiber layer using spectral domain optical coherence tomography. Invest Ophthalmol Vis Sci. 2011; 52: 1486–1492. [DOI] [PMC free article] [PubMed] [Google Scholar]
- 28. Staurenghi G,, Sadda S,, Chakravarthy U,, Spaide RF;, International Nomenclature for Optical Coherence Tomography Panel. Proposed lexicon for anatomic landmarks in normal posterior segment spectral-domain optical coherence tomography: the IN*OCT consensus. Ophthalmology. 2014; 121: 1572–1578. [DOI] [PubMed] [Google Scholar]
- 29. Hood DC,, Zhang X,, Ramachandran R,, et al. The inner segment/outer segment border seen on optical coherence tomography is less intense in patients with diminished cone function. Invest Ophthalmol Vis Sci. 2011; 52: 9703–9709. [DOI] [PMC free article] [PubMed] [Google Scholar]
- 30. Wu Z,, Ayton LN,, Guymer RH,, Luu CD. Relationship between the second reflective band on optical coherence tomography and multifocal electroretinography in age-related macular degeneration. Invest Ophthalmol Vis Sci. 2013; 54: 2800–2806. [DOI] [PubMed] [Google Scholar]
- 31. Scoles D,, Sulai YN,, Langlo CS,, et al. In vivo imaging of human cone photoreceptor inner segments. Invest Ophthalmol Vis Sci. 2014; 55: 4244–4251. [DOI] [PMC free article] [PubMed] [Google Scholar]
- 32. Curcio CA,, Sloan KR,, Kalina RE,, Hendrickson AE. Human photoreceptor topography. J Comp Neurol. 1990; 292: 497–523. [DOI] [PubMed] [Google Scholar]
- 33. Curcio CA,, Millican CL,, Allen KA,, Kalina RE. Aging of the human photoreceptor mosaic: evidence for selective vulnerability of rods in central retina. Invest Ophthalmol Vis Sci. 1993; 34: 3278–3296. [PubMed] [Google Scholar]
- 34. Zhang T,, Godara P,, Blanco ER,, et al. Variability in human cone topography assessed by adaptive optics scanning laser ophthalmoscopy. Am J Ophthalmol. 2015; 160: 290–300. [DOI] [PMC free article] [PubMed] [Google Scholar]
- 35. Chui TY,, Song H,, Clark CA,, Papay JA,, Burns SA,, Elsner AE. Cone photoreceptor packing density and the outer nuclear layer thickness in healthy subjects. Invest Ophthalmol Vis Sci. 2012; 53: 3545–3553. [DOI] [PMC free article] [PubMed] [Google Scholar]
- 36. Wilk MA,, McAllister JT,, Cooper RF,, et al. Relationship between foveal cone specialization and pit morphology in albinism. Invest Ophthalmol Vis Sci. 2014; 55: 4186–4198. [DOI] [PMC free article] [PubMed] [Google Scholar]
- 37. Syed R,, Sundquist SM,, Ratnam K,, et al. High-resolution images of retinal structure in patients with choroideremia. Invest Ophthalmol Vis Sci. 2013; 54: 950–961. [DOI] [PMC free article] [PubMed] [Google Scholar]
- 38. Monés J,, Biarnes M,, Trindade F. Hyporeflective wedge-shaped band in geographic atrophy secondary to age-related macular degeneration: an underreported finding. Ophthalmology. 2012. ; 119: 1412–1419. [DOI] [PubMed] [Google Scholar]
- 39. Polyak S. The Retina. Chicago: University of Chicago; 1941. [Google Scholar]
- 40. Zanzottera EC,, Messinger JD,, Ach T,, Smith RT,, Curcio CA. Subducted and melanotic cells in advanced age-related macular degeneration are derived from retinal pigment epithelium. Invest Ophthalmol Vis Sci. 2015; 56: 3269–3278. [DOI] [PMC free article] [PubMed] [Google Scholar]
Associated Data
This section collects any data citations, data availability statements, or supplementary materials included in this article.


