Abstract
In this study we characterized ammonia and ammonium (NH3/NH4+) transport by the rhesus-associated (Rh) glycoproteins RhAG, Rhbg, and Rhcg expressed in Xenopus oocytes. We used ion-selective microelectrodes and two-electrode voltage clamp to measure changes in intracellular pH, surface pH, and whole cell currents induced by NH3/NH4+ and methyl amine/ammonium (MA/MA+). These measurements allowed us to define signal-specific signatures to distinguish NH3 from NH4+ transport and to determine how transport of NH3 and NH4+ differs among RhAG, Rhbg, and Rhcg. Our data indicate that expression of Rh glycoproteins in oocytes generally enhanced NH3/NH4+ transport and that cellular changes induced by transport of MA/MA+ by Rh proteins were different from those induced by transport of NH3/NH4+. Our results support the following conclusions: 1) RhAG and Rhbg transport both the ionic NH4+ and neutral NH3 species; 2) transport of NH4+ is electrogenic; 3) like Rhbg, RhAG transport of NH4+ masks NH3 transport; and 4) Rhcg is likely to be a predominantly NH3 transporter, with no evidence of enhanced NH4+ transport by this transporter. The dual role of Rh proteins as NH3 and NH4+ transporters is a unique property and may be critical in understanding how transepithelial secretion of NH3/NH4+ occurs in the renal collecting duct.
Keywords: ammonia transport, Rh glycoproteins, pH regulation, RhAG, Rhbg, Rhcg
the mammalian rhesus-associated (Rh) glycoproteins are members of the solute transporter family SLC42 and include RhAG, which is present exclusively in erythrocytes, and two nonerythroid members, RhBG and RhCG. RhAG is one component of the erythrocyte “Rh complex” that is mostly known for its antigenicity but also has an important role in maintaining the stability and structure of the red cell membrane. RhBG and RhCG are expressed in several tissues, including kidney, liver, skin, and the gastrointestinal tract (5–8, 10, 25, 29). RhBG and RhCG (mouse Rhbg and Rhcg, respectively) are mostly expressed together in the same epithelial cell type but with opposing polarity. Several studies over the past decade have linked the function of Rh proteins to transport of NH3 and/or NH4+ (for review see Refs. 2, 9, 23, and 28). Rhbg and Rhcg are expressed in tissues where transport of NH3/NH4+ is likely; however, a definitive role of Rh glycoproteins as transporters is yet to be determined.
Initial studies of Amt, the bacterial homolog to the Rh proteins (14), and later of MEP, the yeast homolog (13), were the first to infer that Rh proteins may be involved in ammonia transport. In later studies on Rh proteins, four possible mechanisms of transport were proposed. Westhoff et al. (30) first proposed that these proteins served as electroneutral countertransporters of NH4+ coupled to H+ efflux. These studies were based on their measurements of methyl amine/ammonium (MA/MA+) uptake (as surrogates for NH3/NH4+) in Xenopus laevis oocytes expressing RhAG (30). In effect, RhAG would be transporting net NH3 equivalents without causing any changes in intracellular pH (ΔpHi = 0). Several studies conducted in oocytes and mammalian cells expressing Rhbg were in agreement with the conclusion of Westhoff et al. (11, 12, 31). A second proposed mechanism was that Rh glycoproteins transport only the neutral NH3 gas species and not NH4+. Studies on liposomes in which RhCG was reconstituted demonstrated an increase in NH3 permeability but no effect on NH4+ permeability (15). Another study involving surface pH (pHs) measurements in oocytes expressing RhCG also concluded that NH3 was being transported (17). If this were indeed true, RhCG would be transporting net NH3 across the oocyte membrane, causing alkalinization of intracellular pH (pHi). A third proposed mechanism was that Rh glycoproteins promoted efflux of NH4+. This was based on a study conducted by Marini et al. (13), who found a higher rate of extracellular accumulation of NH4+ in yeast cells expressing RhAG or RhCG (initially referred to as RhGK) than in controls. Finally, Benjelloun et al. (4) reported that HeLa cells expressing RhAG transport both NH3 and NH4+. Other studies on RhCG (3) and Rhbg (18, 19, 21, 24) also proposed NH3 and NH4+ transport. The complexity of studying NH3/NH4+ transport was discussed by Musa-Aziz et al. (17), who analyzed five proposed models of NH3/NH4+ transport in oocytes expressing the bacterial Rh homolog AmtB. The uncertainty as to how exactly Rh glycoproteins transport NH3/NH4+ is evident in the numerous models proposed by various researchers. We conducted functional studies employing a group of simultaneous or parallel direct measurements (current, voltage, pHi, and pHs) to detect specific signatures that distinguish NH3 from NH4+ transport. This approach allowed us to characterize the mechanism of NH3/NH4+ transport by RhAG, Rhbg, and Rhcg and to show how the mechanisms each employ differ from one another.
MATERIALS AND METHODS
Solutions and Reagents
Solutions were prepared using salts and reagents purchased from Sigma (St. Louis, MO) unless otherwise noted. ND96 frog oocyte Ringer solution [in mM: 96 NaCl, 2 KCl, 1.8 CaCl2, 1 MgCl2, and 5 HEPES (N2C8H18SO4) buffer] was used as the standard medium that bathed the oocyte. In this solution, 5 mM NaCl was replaced with 5 mM NH4Cl or 5 mM methylammonium hydrochloride (CH3NH4·HCl) to make 5 mM ammonium and methylammonium HEPES oocyte Ringer solution, respectively. Oocytes were stored in OR3 (Leibovitz) medium (GIBCO BRL) containing glutamate, 500 U each of penicillin and streptomycin, and 5 mM HEPES buffer, with pH adjusted to 7.5. The pH of all solutions used to perfuse the bath was adjusted to 7.5 at room temperature (22°C) using 5 and 1 N HCl and NaOH. The osmolality of all solutions was ∼200 ± 10 mosM (mmol/kg). Before it was used to anesthetize X. laevis frogs, 0.2% tricaine (C9H11NO2·CH4SO3) solution (7.65 mM tricaine and 5 mM HEPES) was adjusted to pH 7.1–7.4 at room temperature. A buffer solution, pH 7.0, containing 0.015 M NaCl, 0.023 M NaOH, and 0.04 M KH2PO4 was used to backfill silanized pH-sensitive microelectrodes (1).
cRNA Synthesis
RhAG, Rhbg, and Rhcg cDNA constructs in pGH19 expression vector were used to prepare cRNA of the respective clones. cDNA was linearized with NotI or an appropriate restriction enzyme that could cleave downstream of the insert to produce a linear template. This was followed by proteinase K digestion (1 mg/ml). Linearized cDNA was purified with the QIAquick PCR purification kit (Qiagen). Capped cRNA was transcribed in vitro from the linearized cDNA constructs with T3, T7, or the appropriate RNA polymerase using the mMessage mMachine kit (Ambion, Austin, TX) according to the manufacturer's instructions. cRNA was purified and concentrated with the RNeasy MinElute RNA Cleanup Kit (Qiagen). The concentration of cRNA was determined by UV absorbance, and its quality was assessed by formaldehyde-MOPS-1% agarose gel electrophoresis.
Isolation of Oocytes
Oocytes in stages 5/6 were harvested as described by Nakhoul et al. (20). Briefly, X. laevis frogs were anesthetized in 0.2% tricaine. A 1-cm incision was made in the abdominal wall, first through the abdominal skin and then through the muscular plane of the peritoneum. A lobe of the ovary, which contains the oocytes, was externalized through the incisions, and the distal portion was cut. For wound closure, the lips of the incisions were joined by suturing the muscular plane of the peritoneum using 4-0 chromic gut and then suturing the abdominal skin using 6-0 silk. The excised lobe of the ovary was rinsed several times in Ca2+-free ND96 solution until the solution was clear. Separation of the oocytes was achieved by agitation of the ovary in ∼30 ml of sterile-filtered Ca2+-free solution containing 3–5 mg of collagenase (type IA) for 30–40 min. Free oocytes were rinsed multiple times with sterile OR3 medium, sorted to allow selection of the mature oocytes, and stored at 18°C. All animal procedures were performed in accordance with protocols approved by the Institutional Animal Care and Use Committee of Tulane University.
Injection of Oocytes
Sorted oocytes stored in OR3 medium were visualized under a dissecting microscope and injected with 50 nl of Rhbg, Rhcg, or RhAG cRNA (0.05 μg/μl, totaling 2.5 ng of cRNA per oocyte). Control oocytes were injected with 50 nl of sterile H2O. Accurate and precise delivery of nanoliter volumes of cRNA was achieved using the Nanoject II Auto-Nanoliter injector (Drummond Scientific). Briefly, sterile injection pipettes with ∼20-μm tip diameters were backfilled with mineral oil and attached to the injector. The tip of the securely mounted micropipette was then filled with the sample cRNA. Injections were performed manually; during the injections, the selected volume of sample cRNA was dispensed into each individual oocyte under microscope visualization. Injected oocytes were stored in fresh sterile OR3 medium at 18°C and used in our experiments 3–5 days after injection with cRNA.
Electrophysiological Measurements in Oocytes
Electrophysiological measurements in oocytes involved measuring whole cell currents (I), pHi, and pHs. Two-electrode voltage (TEV) clamp (model OC-725, Warner Instruments) was used to measure I. Two voltage microelectrodes were pulled from sections of borosilicate glass capillary tubing with filament (1.5 mm OD × 0.86 mm ID; Warner Instruments) and filled with 3 M KCl and then simultaneously used to impale the oocytes during measurements. Resistance of all electrodes was 2–10 MΩ, and tip potential was <4 mV. Two bath electrodes, serving as free-flowing reference electrodes, were filled with 3 M KCl and directly immersed into the chamber in which the oocytes were placed. The membrane potential (Vm) was obtained by measurement of the voltage difference between the intracellular voltage microelectrode and the free-flowing 3 M KCl Ag-AgCl reference electrode in the bath. All oocytes were clamped at −60 mV, and long-term readings of current were sampled at a rate of once per second. Inward flow of cations (inward current) is defined by convention as negative current.
Single-barreled H+-selective microelectrodes that were manufactured according to the methods described by Sackin and Boulpaep (26) were used to measure pHi and pHs. The microelectrodes were made from borosilicate glass capillary tubing (1.5 mm OD × 0.86 mm ID; Harvard Apparatus) that was pulled to a tip diameter <0.2 μm and dried in an oven for 2 h at 200°C. The dried capillary tubing was then vapor-silanized with 50 μl of bis(dimethylamino)-dimethyl silane in a closed vessel (300 ml) as described by Siebens and Boron (27). A very fine glass capillary attached to a syringe was used to fill the tip of a section of silanized capillary tubing with H+ ionophore I-cocktail B (Fluka-Sigma) and backfill the remaining volume of the tubing with a pH 7.0 buffer solution. The filled tubing was then fitted with a holder containing an Ag-AgCl wire and connected to a high-impedance electrometer (model FD-223, World Precision Instruments). The tip diameter of the pH electrodes used for pHs measurements (∼15 μm) was significantly greater than that of the pH electrodes used for pHi measurements (<0.2 μm). We calibrated both types of electrodes in standard pH 6 and 8 buffer solutions and confirmed that they had slopes >58 mV/pH. When conducting pHi measurements, we simultaneously impaled the oocytes with a pH electrode and a voltage electrode. A reference electrode filled with 3 M KCl was also immersed in the bath. However, when conducting pHs measurements, we pushed the electrode tip against the surface of the oocyte (∼60 μm) without impaling it. The gross potentials of the pH microelectrodes were measured by calculating the difference between the pH microelectrode and the reference electrode. The pure pHi voltage was obtained by electronically subtracting Vm from the gross potential of the pH electrode.
Oocytes were placed in a special perfusion chamber and held on a nylon mesh, where they were visualized with a dissecting microscope. We initialized our experiments by continuously flowing bath solutions of standard HEPES followed by a test solution usually containing 5 mM NH4Cl (NH3/NH4+ solution) or 5 mM MA/MA+ and then recovery in standard HEPES. This enabled us to measure the effect of each solution on pHi, pHs, Vm, or I of a single oocyte. Bath solutions were rapidly switched using a combination of a six- and a four-way valve system that is activated pneumatically. All solutions had a pH of 7.5 and flowed at a constant rate of 3–5 ml/min. Experiments were conducted at room temperature.
We used pHi vs. time tracings to calculate the initial rates of change of pHi (dpHi/dt). We obtained the dpHi/dt for each pulse (NH3/NH4+ and MA/MA+ effects) by fitting the first 20 data points of the experimental pHi vs. time curve to a linear regression line. The slope of this regression line was used to determine the recorded dpHi/dt. We also used pHi, pHs, and I vs. time measurements to calculate the absolute ΔpHi, ΔpHs, and ΔI, respectively. Measurements of ΔpHi were obtained at ∼10 min after solution change in the bath or, alternatively, when a new steady-state pHi was reached. Measurements of ΔpHs were obtained at peak values of pHs. We did not compute rates of change of pHs, because the changes occurred too fast (within seconds) to allow enough data points for reliable measurement of rates. The final calculated values for dpHi/dt, ΔpHi, ΔpHs, and ΔI in experimental and H2O-injected control oocytes were tabulated and analyzed for statistical significance.
Statistical Analysis
In all protocols, values are reported as means ± SE of the number of oocytes assayed. Statistical significance was determined using Student's t-test. P < 0.05 was considered significant.
RESULTS
NH4+- and MA+-Induced Currents in Oocytes Expressing RhAG or Rhcg
In TEV-clamp experiments, we clamped oocytes at −60 mV and measured whole cell currents in response to 5 mM NH4Cl (NH3/NH4+) or MA/MA+ in the bath. As seen in Fig. 1 (segment ab), an inward current was observed in both RhAG-expressing (red tracing) and control (H2O-injected, blue tracing) oocytes upon change of the bath solution from HEPES to 5 mM NH4Cl. The inward currents recovered instantaneously upon return of the bath solution to HEPES (segment bc). Figure 1 also shows that, in oocytes expressing RhAG, 5 mM MA/MA+ (a substitute for NH3/NH4+) caused an inward current (segment cd). Return of the bath solution to HEPES resulted in recovery of the inward current observed in RhAG-expressing oocytes (segment de). No change in current was observed in control oocytes (segment cd, blue tracing). Figure 2, which is similar to Fig. 1, shows the effect of NH3/NH4+ and MA/MA+ on H2O-injected or Rhcg-expressing oocytes. In both cases (Rhcg and control oocytes), NH3/NH4+ caused an inward current (segment ab), but MA/MA+ did not (segment cd). The NH3/NH4+-induced currents were similar in Rhcg-expressing and H2O-injected oocytes.
Fig. 1.
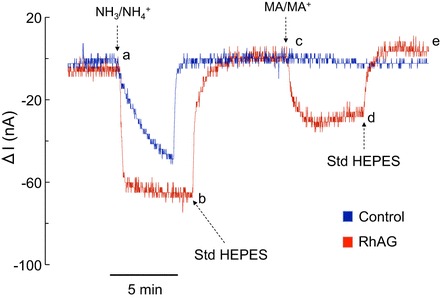
NH3/NH4+- and methyl amine/ammonium (MA/MA+)-induced currents (I) in H2O-injected and glycoprotein (RhAG)-expressing oocytes. All oocytes were clamped at −60 mV and exposed to standard HEPES-Ringer (Std HEPES), 5 mM NH4Cl HEPES-Ringer (NH3/NH4+), or 5 mM methylamine hydrochloride HEPES-Ringer (MA/MA+), pH 7.5, solution. In oocytes expressing RhAG (red tracing), an inward current was observed upon switching solution from standard HEPES to NH3/NH4+ (segment ab). Inward current recovered upon return to standard HEPES solution (segment bc). An inward current was also observed upon switching solution from standard HEPES to MA/MA+ (segment cd). Inward current also recovered upon return to standard HEPES solution (segment de). In H2O-injected oocytes (blue tracing), NH4+ influx caused an inward current (segment ab) that was not seen with MA+ (segment cd). Tracings are representative of results from 6 RhAG-expressing and for 10 H2O-injected oocytes.
Fig. 2.
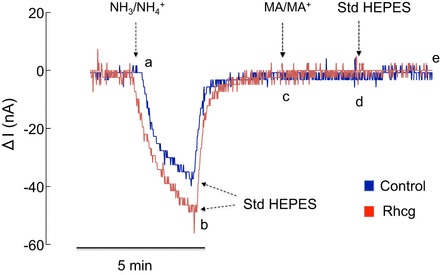
NH3/NH4+- and MA/MA+-induced currents in H2O-injected and Rhcg-expressing oocytes. In oocytes expressing Rhcg (red tracing) or injected with H2O (blue tracing), an inward current was observed upon switching solution from standard HEPES to NH3/NH4+ (segment ab). Inward current recovered upon return to standard HEPES solution (segment bc). Exposure to MA/MA+ did not cause a significant change in current (segment cd). Tracings are representative of results from 23 Rhcg-expressing and 22 H2O-injected oocytes.
Figure 3A, a summary of the data, indicates that exposure of RhAG-expressing oocytes to 5 mM NH3/NH4+ bath solution caused an inward current of −68.4 ± 9.5 nA (n = 6). This was significantly greater (P < 0.05) than the current in control oocytes, which was −44.2 ± 5.7 nA (n = 10). On the other hand, exposure of RhAG-expressing oocytes to 5 mM MA/MA+ caused an inward current of −41 ± 4.2 nA (n = 9). This was significantly greater (P < 0.001) than the current measured in control oocytes, which was not different from 0 (+0.25 ± 0.2 nA, n = 10). Figure 3B, a summary of the data from Rhcg-expressing oocytes, indicates that inward currents in oocytes expressing Rhcg (−25.9 ± 3.8 nA, n = 23) were not significantly different (P > 0.05) from those in H2O-injected control oocytes (−22.9 ± 3.4 nA, n = 22). MA/MA+ (5 mM) did not cause a significant inward current in Rhcg-expressing or H2O-injected oocytes.
Fig. 3.
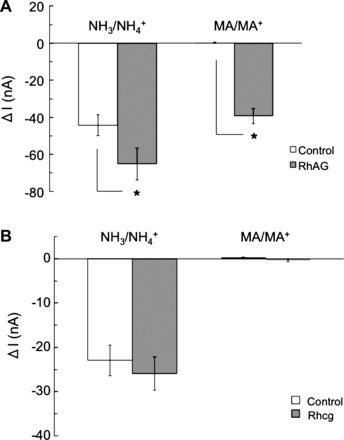
NH4+ and MA+ currents in oocytes expressing glycoproteins. A: in oocytes expressing RhAG, exposure to NH3/NH4+ (5 mM) induced an inward current of −68.4 ± 9.5 nA (n = 6) that was significantly larger than in H2O-injected (control) oocytes (P < 0.05). Exposure to MA/MA+ (5 mM) caused an inward current of −41 ± 4.2 nA (n = 9) that was also significantly larger than in H2O-injected oocytes (P < 0.001). In H2O-injected oocytes, exposure to NH3/NH4+ caused an inward current of −44 ± 5.7 nA (n = 10), whereas exposure to MA/MA+ did not cause a significant current. *Statistical significance. B: in oocytes expressing Rhcg, exposure to NH3/NH4+ (5 mM) induced an inward current of −25.9 ± 3.8 nA (n = 23) that was not significantly different −22.9 ± 3.4 nA (n = 22) in H2O-injected (control) oocytes. Exposure to MA/MA+ (5 mM) did not cause a significant inward current in oocytes expressing Rhcg (−0.3 ± 0.3 nA, n = 23) or H2O-injected oocytes (+0.2 ± 0.2 nA, n = 22).
NH3/NH4+ and MA/MA+ Effects on pHi in Oocytes Expressing RhAG or Rhcg
In the above-described experiments (Figs. 1–3), the inward currents caused by exposure to NH3/NH4+ (and MA/MA+) are consistent with influx of NH4+ (and MA+). Transport of NH3 (or MA), which cannot be detected by current measurement, could be either negligible or masked by transport of NH4+ (and MA+). To investigate this hypothesis further, we measured pHi to verify that the charged component in solution responsible for the inward currents was, in fact, NH4+ and MA+ ions that were being transported across the membrane. If this indeed were the case, both NH4+ and MA+ would be expected to dissociate upon entry into the oocyte, releasing H+ ions, thereby causing a decrease in pHi. If, on the other hand, electroneutral NH3 or MA were being transported across the membrane, an increase in pHi would be expected due to the consumption of intracellular H+ ions during the protonation of NH3 and MA to form NH4+ and MA+ intracellularly.
As shown in Fig. 4, in oocytes expressing RhAG, changing the bath solution from HEPES to 5 mM NH3/NH4+ Ringer solution caused a significant decrease in pHi and depolarization of the cell (segment ab). Return of the solution to HEPES caused recovery of pHi and Vm to steady state (segment bc). On the other hand, exposure of the oocytes to 5 mM MA/MA+ caused an increase (not a decrease) in pHi but depolarized the cell as well (segment cd). Removal of MA/MA+ from the bath completely reversed these changes (segment de).
Fig. 4.
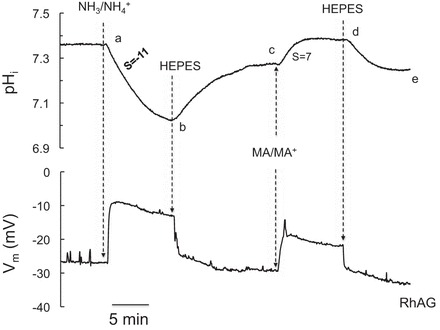
Effects of NH3/NH4+ and MA/MA+ on intracellular pH (pHi) and membrane potential (Vm) in oocytes expressing RhAG. Exposure of RhAG-expressing oocytes to NH3/NH4+ (5 mM) caused a rapid decrease in pHi (dpHi/dt = −11 × 10−4 pH units/s) and a large depolarization of the cell membrane (segment ab). Removal of bath NH3/NH4+ resulted in full recovery of pHi and Vm (segment bc). On the other hand, exposure of the oocyte to MA/MA+ (5 mM) caused a significant increase in pHi (dpHi/dt = +7 × 10⁻⁴ pH units/s) but also significantly depolarized the cell (segment cd). Removal of MA/MA+ reversed these changes (segment de). S, slope. Tracings are representative results from 20 experiments.
Similar experiments were conducted on H2O-injected (control) oocytes. As shown in Fig. 5, changing the bath solution of control oocytes from HEPES to 5 mM NH3/NH4+ also caused intracellular acidification and depolarization of the cell membranes (segment ab), both of which recovered to steady state following return of the bath solution to HEPES (segment bc). However, contrary to observations in oocytes expressing RhAG, exposure to MA/MA+ or its removal did not cause changes in pHi or Vm in control oocytes (segment cd).
Fig. 5.
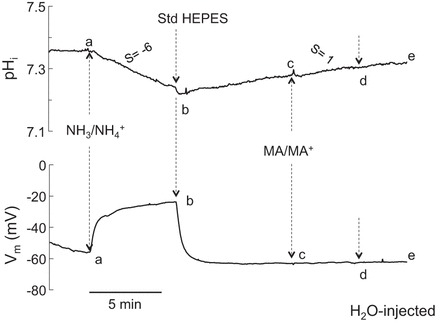
Effects of NH3/NH4+ and MA/MA+ on pHi and Vm in H2O-injected oocytes. Exposure of control oocytes to NH3/NH4+ (5 mM) caused a small and slow decrease in pHi (dpHi/dt = −6 × 10⁻⁴ pH units/s) and depolarization of the cell membrane (segment ab). Both changes readily recovered upon removal of NH3/NH4+ from the bath (segment bc). However, exposure of the H2O-injected oocyte to MA/MA+ (5 mM) caused only a small increase in pHi and no depolarization (segment cd). Removal of MA/MA+ reversed these changes (segment de). Tracings are representative results from 13 experiments.
A third set of experiments was conducted to determine the effects of NH3/NH4+ (and MA/MA+) on pHi in Rhcg-expressing oocytes. As shown in Fig. 6, exposure of Rhcg-expressing oocytes to 5 mM NH3/NH4+ caused a decrease in pHi and depolarization of the cell (segment ab). Removal of NH3/NH4+ from the bath caused complete recovery of pHi and Vm (segment bc). Exposure of the oocyte to 5 mM MA/MA+ did not cause a significant change in pHi or Vm (segment cd). These experiments indicate that oocytes expressing Rhcg behaved qualitatively similarly to H2O-injected oocytes and differently from RhAG-expressing oocytes (compare Fig. 6 with Figs. 4 and 5).
Fig. 6.
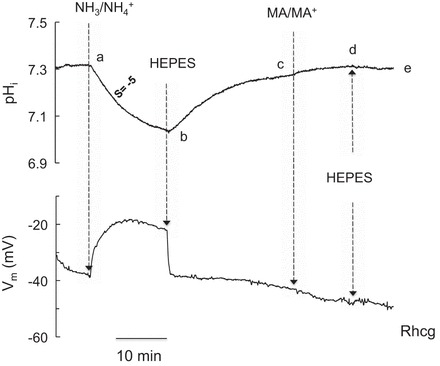
Effects of NH3/NH4+ (5 mM) and MA/MA+ (5 mM) on pHi and Vm in oocytes expressing Rhcg. Exposure of Rhcg-expressing oocytes to NH3/NH4+ (5 mM) caused a decrease in pHi and depolarization of the cell membrane (segment ab). Removal of bath NH3/NH4+ reversed these changes (segment bc). In contrast, exposure of the oocyte to MA/MA+ (5 mM) caused a very small increase in pHi and no depolarization (segment cd). Removal of MA/MA+ reversed these changes (segment de). Tracings are representative of results from 6 experiments.
The results of these experiments are summarized in Fig. 7. According to our data (Fig. 7A), 5 mM NH3/NH4+ in the bath solution resulted in a decrease in pHi of 0.31 ± 0.04 pH units (n = 20) in RhAG-expressing oocytes, 0.28 ± 0.06 pH units (n = 13) in H2O-injected oocytes, and 0.24 ± 0.03 pH units (n = 6) in Rhcg-expressing oocytes. These changes in pHi were not significantly different among the three groups. In contrast to NH3/NH4+, MA/MA+ generally caused an increase, rather than a decrease, in pHi. The magnitude of change in pHi (ΔpHi) caused by MA/MA+ was 0.14 ± 0.02 pH units (n = 21) in RhAG-expressing oocytes, 0.04 ± 0.01 pH units in control oocytes (n = 13), and 0.03 ± 0.01 pH units (n = 7) in Rhcg-expressing oocytes. The increase in pHi was significantly greater (P < 0.001) in RhAG-expressing than control or Rhcg-expressing oocytes. There was no statistical difference in ΔpHi between Rhcg-expressing and control oocytes.
Fig. 7.
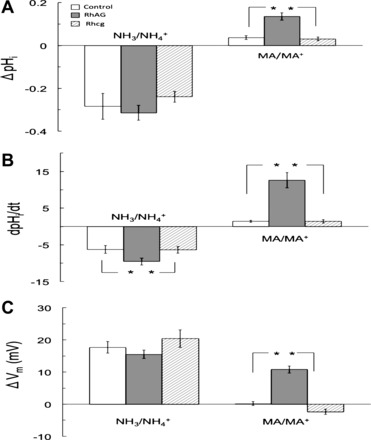
Effects of NH3/NH4+ and MA/MA+ on pHi and Vm in oocytes expressing RhAG or Rhcg or H2O-injected oocytes. A: effect on ΔpHi. In age-matched oocytes, NH3/NH4+ (5 mM) caused pHi to decrease in experimental (RhAG- and Rhcg-expressing) and control (H2O-injected) oocytes. ΔpHi values were not significantly different from each other. Decrease in pHi in RhAG- and Rhcg-expressing and control oocytes was 0.31 ± 0.04 (n = 20), 0.24 ± 0.03 (n = 6), and 0.28 ± 0.06 (n = 13) pH units, respectively. On the other hand, MA/MA+ (5 mM) caused a slight increase in control and Rhcg-expressing oocytes, with a significant increase only in RhAG-expressing oocytes (P < 0.001 vs. control, P < 0.01 vs. Rhcg). The increase in pHi of RhAG-expressing oocytes was 0.14 ± 0.02 pH units (n = 21), whereas the increase in Rhcg-expressing and control oocytes was 0.03 ± 0.01 (n = 7) and 0.04 ± 0.01 (n = 13) pH units, respectively. *Statistical significance. B: effect on rate of pHi change. NH3/NH4+ (5 mM) in the bath caused a significantly faster (P < 0.05) decrease in pHi in oocytes expressing RhAG (dpHi/dt = −10 ± 0.95 × 10⁻⁴ pH units/s, n = 22) than in H2O-injected control oocytes (dpHi/dt = −6.6 ± 1.1 × 10⁻⁴ pH units/s, n = 15) or Rhcg-expressing oocytes (dpHi/dt = −5.9 ± 0.47 × 10⁻⁴ pH units/s, n = 7). Rate of acidification in oocytes expressing Rhcg was not significantly different from that in control oocytes. In contrast, in oocytes expressing RhAG, MA/MA+ (5 mM) caused an increase in pHi at a rate of +10.9 ± 2.0 × 10⁻⁴ pH units/s (n = 21). This rate of alkalinization was significantly higher than that in Rhcg-expressing oocytes (dpHi/dt = +1.0 ± 0.35 × 10⁻⁴ pH units/s, n = 7, P < 0.01) or control oocytes (dpHi/dt = +1.5 ± 0.30 × 10⁻⁴ pH units/s, n = 13, P < 0.001). The difference in the rate of alkalinization between Rhcg-expressing and control oocytes caused by MA/MA+ was not statistically significant. *Statistical significance. C: effect on Vm. NH3/NH4+ (5 mM) caused experimental and control groups to depolarize, with no significant difference between Rhcg-expressing (20.4 ± 2.7 mV, n = 8), RhAG-expressing (15.5 ± 1.3 mV, n = 28), and control (17.7 ± 1.8 mV, n = 20) oocytes. In contrast, MA/MA+ (5 mM) caused significant depolarization in oocytes expressing RhAG (10.8 ± 1.1 mV, n = 26) compared with almost no depolarization in H2O-injected oocytes (0.2 ± 0.6 mV, n = 19, P < 0.0001) or oocytes expressing Rhcg (−2.4 ± 0.8 mV, n = 8, P < 0.001). *Statistical significance.
Figure 7B shows that dpHi/dt calculated for RhAG-expressing oocytes following exposure to 5 mM NH3/NH4+ bath solution was −10 ± 0.95 × 10⁻⁴ pH units/s (n = 22), which was significantly faster (P < 0.05) than −6.6 ± 1.1 × 10⁻⁴ pH units/s calculated for control oocytes (n = 15) or −5.9 ± 0.47 × 10⁻⁴ pH units/s (n = 7) for Rhcg-expressing oocytes. On the other hand, dpHi/dt calculated for RhAG-expressing oocytes following exposure to 5 mM MA/MA+ was +10.9 ± 2.0 × 10⁻⁴ pH units/s (n = 21), which was significantly faster (P < 0.01) than +1.5 ± 0.30 × 10⁻⁴ pH units/s (n = 13) calculated for control oocytes or +1.0 ± 0.35 × 10⁻⁴ pH units/s (n = 7) for Rhcg-expressing oocytes. There was no statistical difference between H2O-injected and Rhcg-expressing oocytes.
Figure 7C summarizes the effects of NH3/NH4+ and MA/MA+ on Vm. Exposure to 5 mM NH3/NH4+ in the bath depolarized the cell in RhAG-expressing, Rhcg-expressing, and control oocytes; however, no significant difference was detected among the three groups. The depolarization was 15.5 ± 1.3 mV in RhAG-expressing oocytes (n = 28), 17.7 ± 1.8 mV (n = 20) in control oocytes, and 20.4 ± 2.7 mV in Rhcg-expressing oocytes (n = 8). On the other hand, exposure to 5 mM MA/MA+ in the bath caused significant depolarization of the cell membranes in RhAG-expressing oocytes but almost no membrane depolarization was detected in control oocytes or Rhcg-expressing oocytes. MA/MA+ caused a 10.8 ± 1.1 mV membrane depolarization in RhAG-expressing oocytes (n = 26), which was significantly larger (P < 0.001) than 0.2 ± 0.6 mV (n = 19) in control oocytes or −2.4 ± 0.8 mV (n = 8) in Rhcg-expressing oocytes.
NH3/NH4+- and MA/MA+-Induced Changes in pHs in Oocytes Expressing RhAG or Rhcg
To determine whether NH4+ or NH3 is being transported across the oocyte membrane, we measured pHs using H+-selective electrodes. In these experiments the tip of the pH microelectrode was broken to a blunt end of ∼15 μm diameter. The electrode was pressed against the membrane surface (forming a slight dimple) without impaling the cell. As such, we measured the pH in the microenvironment between the microelectrode and the surface of the cell. In this configuration, if NH3 is predominantly transported into the cell faster than NH4+, we expect a decrease in pHs, because as NH3 moves intracellularly, NH4+, which is in equilibrium with NH3, dissociates to replenish NH3, leading to H+ accumulation at the surface. As shown in Fig. 8, exposure of oocytes that express RhAG to 5 mM NH3/NH4+ caused initial rapid acidification at the surface (segment ab, red tracing) followed by partial recovery (segment bc, red tracing). Returning the bath solution to HEPES caused recovery of pHs to steady state with a slight overshoot (segment cde). RhAG-expressing oocytes also acidified at the surface upon changing the solution from HEPES to 5 mM MA/MA+ (segment efg, red tracing). Returning the bath solution to HEPES caused recovery of pHs to steady state (segment gh).
Fig. 8.
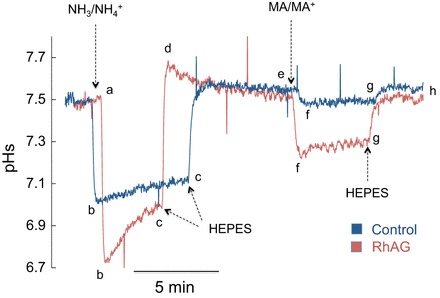
Surface pH (pHs) changes induced by NH3/NH4+ and MA/MA+ in RhAG-expressing and H2O-injected oocytes. Exposure of oocytes to NH3/NH4+ (5 mM) caused a rapid decrease in pHs (segment ab) followed by partial recovery (segment bc) of RhAG-expressing (red tracing) and control (blue tracing) oocytes. Removal of NH3/NH4+ reversed these changes (segment cde). Exposure of oocytes to MA/MA+ (5 mM) also caused a decrease in pHs in RhAG-expressing oocytes (segment efg, red tracing) but very little change in H2O-injected oocytes (blue tracing). Removal of MA/MA+ reversed these changes (segment gh). The decrease in pHs during NH3/NH4+ or MA/MA+ exposure was more pronounced in oocytes expressing RhAG than in H2O-injected control oocytes (P < 0.001). Tracings are representative of results from 12 RhAG-expressing and 12 H2O-injected oocytes.
Figure 8 also shows a superimposed tracing of an experiment conducted on H2O-injected oocytes (blue tracing). In control oocytes, changing the bath solution from HEPES to 5 mM NH3/NH4+ also caused surface acidification (segment abc), which recovered to steady state following return of the bath solution to HEPES (segment cde, blue tracing). Contrary to observations in RhAG-expressing oocytes, bath MA/MA+ did not cause significant changes in pHs (segment efg, blue tracing).
Similar experiments were also conducted on Rhbg- and Rhcg-expressing oocytes. Figure 9 shows superimposed tracings from representative experiments conducted on Rhbg-expressing (green tracing), Rhcg-expressing (red tracing), and H2O-injected (blue tracing) oocytes. Exposure of all three (Rhbg, Rhcg, and control) oocytes to 5 mM NH3/NH4+ caused a decrease in pHs (segment abc) that readily recovered upon removal of NH3/NH4+ from the bath (segment cde). However, it is important to note that the decrease in pHs was characteristically different in each case. In Rhbg-expressing oocytes, NH3/NH4+ caused a rapid decrease in pHs (segment ab, green tracing) that partially recovered (segment bc). In Rhcg-expressing oocytes, there was a sustained decrease in pHs (segment abc, red tracing) that was smaller than in Rhbg-expressing oocytes (green tracing) but larger than in control oocytes (blue tracing). In the same experiments, exposure of the oocytes to MA/MA+ caused a decrease in pHs of Rhbg-expressing oocytes (segment ef, green tracing), but there was almost no change in pHs of Rhcg-expressing (red tracing) or control (blue tracing) oocytes. The MA/MA+-induced decrease in pHs of Rhbg-expressing oocytes also showed some recovery (segment fg, green tracing), and the change was smaller than that caused by NH3/NH4+ (compare segment ef with ab). All changes were reversed upon removal of MA/MA+ from the bath.
Fig. 9.
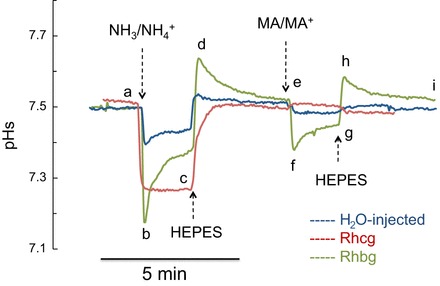
Changes in pHs induced by NH3/NH4+ and MA/MA+ in Rhbg-expressing, Rhcg-expressing, and H2O-injected oocytes. Exposure of oocytes to NH3/NH4+ (5 mM) caused a rapid decrease in pHs in Rhbg-expressing, Rhcg-expressing, and control oocytes (segment ab). In oocytes expressing Rhbg (green tracing) and control oocytes (blue tracing), decrease in pHs was followed by a spontaneous and partial recovery (segment bc), whereas in Rhcg-expressing oocytes (red tracing), pHs acidification was sustained. These changes were reversed upon removal of NH3/NH4+ from the bath (segment cde). MA/MA+ (5 mM) also caused a rapid and transient, but smaller, decrease in pHs in oocytes expressing Rhbg (segment efg, green tracing) but very little change in Rhcg-expressing (segment efg, red tracing) or control (segment efg, blue tracing) oocytes. Tracings are representative of results from 12 H2O-injected, 11 Rhbg-expressing, and 7 Rhcg-expressing oocytes.
The results of these experiments are summarized in Fig. 10. These data indicate that bath NH3/NH4+ caused a decrease in pHs (peak values) of 0.70 ± 0.04, 0.32 ± 0.02, 0.45 ± 0.03, and 0.66 ± 0.11 pH units in RhAG-expressing oocytes (n = 12), control oocytes (n = 12), Rhcg-expressing oocytes (n = 7), and Rhbg-expressing oocytes (n = 8), respectively (RhAG > Rhbg > Rhcg > H2O-injected). The acidification was significantly greater in oocytes expressing Rhbg (P < 0.01), Rhcg (P < 0.01), and RhAG (P < 0.001) than in control oocytes. Importantly, the difference in NH3/NH4+-induced pHs acidification between RhAG- and Rhcg-expressing oocytes or between Rhbg- and Rhcg-expressing oocytes was also significant (P < 0.01); however, the difference between RhAG- and Rhbg-expressing oocytes was not statistically significant (P > 0.05).
Fig. 10.
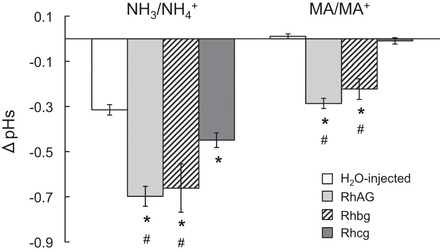
Effects of NH3/NH4+ and MA/MA+ on pHs in oocytes expressing RhAG, Rhbg, and Rhcg and H2O-injected oocytes. Exposure of oocytes to NH3/NH4+ (5 mM) caused a decrease in pHs of oocytes expressing Rhbg (−0.66 ± 0.11, n = 11), Rhcg (−0.45 ± 0.03, n = 7), and RhAG (−0.70 ± 0.045, n = 12) that was significantly greater (P < 0.01) than in H2O-injected oocytes (−0.32 ± 0.02, n = 12). Also, the decrease in pHs in oocytes expressing Rhbg and RhAG was significantly greater (P < 0.05) than in oocytes expressing Rhcg. On the other hand, the decrease in pHs induced by MA/MA+ (5 mM) was significantly greater in oocytes expressing Rhbg (−0.22 ± 0.05, n = 8) and RhAG (−0.29 ± 0.02, n = 13) than H2O-injected oocytes (0.01 ± 0.01, n = 12, P < 0.01) or oocytes expressing Rhcg (−0.01 ± 0.01, n = 11, P < 0.01). *Significantly different from control. #Significantly different from Rhcg.
Figure 10 also summarizes the results due to MA/MA+. pHs decreased by 0.29 ± 0.02, 0.01 ± 0.01, and 0.22 ± 0.05 pH units in RhAG-expressing oocytes (n = 13), Rhcg-expressing oocytes (n = 11), and Rhbg-expressing oocytes (n = 8), respectively, and by only 0.01 ± 0.01 pH units in control oocytes (n = 12). The degree of acidification was statistically different between control oocytes and oocytes expressing RhAG (P < 0.001) or Rhbg (P < 0.001). Acidification of Rhcg-expressing oocytes was not statistically different from that of control oocytes (P > 0.05). Interestingly, RhAG-expressing oocytes, with regard to pHs, acidified as much as Rhbg-expressing oocytes. The difference between both groups was not significant; however, surface acidification was significantly greater in RhAG- and Rhbg- than Rhcg-expressing oocytes (P < 0.01).
DISCUSSION
Overview
In this study we examined the transport characteristics of Rh glycoproteins with respect to NH3/NH4+ transport. We relied on measurements of NH3/NH4+ (and MA/MA+)-induced changes in I, pHi, and pHs. We measured these changes in oocytes expressing the Rh glycoproteins (RhAG, Rhcg, or Rhbg) using the TEV-clamp technique and ion-selective microelectrodes. Because total ammonia (NH3/NH4+) is NH4+ in equilibrium with NH3 as described in this reaction
| (1) |
it is critical to determine which substrate (NH3 or NH4+) is transported by the protein. Depending on the net transport of the ionic NH4+ and electroneutral NH3 component species, we would expect three possible outcomes. First, if Rh glycoproteins transport only the ionic NH4+ species, but not the uncharged NH3 species, then we can directly measure the charge being transported across the oocyte membrane with the TEV-clamp technique. In our experiments the net influx of NH4+ would be detected as an NH4+-induced inward current. Furthermore, results from pHi measurements would show acidification caused by the dissociation of the entering NH4+ into NH3 and H+ intracellularly. In contrast, pHs measurements would show surface alkalinization, because as NH4+ enters the cell, the equilibrium reaction at the cell surface (reaction 1) shifts to the left, leading to consumption of surface H+ and, therefore, an increase in pHs. We expect similar changes in I, pHi, and pHs if we expose the oocytes to MA/MA+ and only MA+ is being transported. The equilibrium reaction of MA/MA+ is similar to that of NH3/NH4+ as depicted in reaction 2
| (2) |
Due to their similarity and because MA/MA+ can be easily radiolabeled, MA/MA+ has often been used as a replacement for NH3/NH4+ in uptake studies.
Second, if, however, only the uncharged NH3 species (and not NH4+) were being transported, the following changes would be expected. Inward currents would be absent or minimal in the I measurements, and net NH3 influx would cause an increase in pHi that can be detected by pHi measurements. This would be due to the consumption of intracellular H+ by the influxed NH3, forming NH4+ intracellularly. On the other hand, at the cell surface, net NH3 influx is expected to cause a decrease in pHs due to the release of H+ ions at the surface during dissociation of NH4+ to replenish NH3 and maintain equilibrium at the cell surface caused by the entry of NH3 into the oocyte (rightward shift of reaction 1).
Third, Rh glycoproteins may simultaneously transport both the ionic NH4+ and the neutral NH3 species. If this is indeed the case, then we expect to detect transient changes in pHi or pHs, depending on the rate of entry of NH3 relative to NH4+. A higher rate of NH3 entry than NH4+ influx would cause an initial pHi increase (and an initial pHs decrease) followed by at least partial recovery as NH4+ influx follows. On the other hand, a higher relative rate of NH4+ entry would cause an initial pHi decrease (and an initial pHs increase) also followed by recovery. To detect any transients in pHi or pHs, the flux of either NH4+ or NH3 would have to be greater than the other. In other words, if the ratio (i.e., flux of NH3 to flux of NH4+) remains constant, then no changes in pHi or pHs would be detected.
Evidence for NH4+ Transport
The data in our study demonstrate that RhAG simultaneously transports both the ionic NH4+ (MA+) and the neutral NH3 (MA) species. Our data show that RhAG, like Rhbg (21), transports NH4+ (and MA+) in an electrogenic manner. This is evident by the fact that NH4Cl (NH3/NH4+) and CH3NH4·HCl (MA/MA+) induced inward currents, which can be directly attributed to net NH4+ and MA+ influx, respectively. Moreover the magnitudes of these currents are larger in RhAG-expressing than H2O-injected control oocytes (Figs. 1 and 3A). Although inward currents can be observed in control oocytes exposed to NH3/NH4+, these inward currents are due to native transport mechanisms that are smaller in magnitude, have different (slower) kinetics, and are unlikely related to Rh proteins (Fig. 1). Although it may be suggested that exposure to NH3/NH4+ (or MA/MA+) may lead to the activation of a native endogenous transporter or a channel that can transport NH3/NH4+, rather than transport through the expressed exogenous Rh transporter, our data do not support this possibility. A main observation here is that MA+ induces an inward current in RhAG-expressing oocytes but has no effect in H2O-injected control oocytes. This confirms the substrate specificity of Rh glycoproteins for MA/MA+ and argues against activation of a native transporter. It is interesting to note that, regarding effects on current, no significant difference was observed between Rhcg-expressing and control oocytes (Figs. 2 and 3B), suggesting that expression of Rhcg does not lead to significant net transport of the charged NH4+ (or MA+) species over that of NH3 (or MA).
Evidence for NH3 Transport From pHs Measurements
In addition to the evidence of electrogenic transport by Rh glycoproteins (RhAG and Rhbg) demonstrated by our TEV measurement of current, our pHs measurements provide evidence for transport of the neutral gas species as well. The surface acidification observed in oocytes expressing Rh glycoprotein (Figs. 8 and 9) can be indirectly attributed to net NH3 (or MA) influx that dominates any NH4+ (or MA+) influx. Surface acidification was also recorded in control oocytes exposed to NH3/NH4+, although significantly less than in Rh-expressing oocytes, indicating residual Rh-independent NH3 influx. Upon exposure to NH3/NH4+ solution, RhAG-, Rhbg-, and Rhcg-expressing oocytes had varying and significant amounts of peak surface acidification compared with control oocytes (Figs. 8–10), demonstrating that RhAG, Rhbg, and Rhcg transport net NH3 into the oocyte. The data also show more transport of NH3 into the oocyte by RhAG and Rhbg than Rhcg, which, as described earlier in our voltage-clamp data, was not found to transport NH4+ significantly.
It can be argued that the surface extracellular acidification that we measured may not be due to NH3 (and MA) influx as we propose but, rather, that intracellular acidification caused by NH4+ is triggering endogenous acid-extruding mechanisms in the oocyte to transport intracellular H+ to the surface and, therefore, is causing the surface extracellular acidification that we observe. This is unlikely, because it can be demonstrated that intracellular acidification caused by means other than exposure to NH3/NH4+ does not always cause pHs acidification but, rather, an increase in pHs. For example, we conducted experiments whereby exposure of oocytes to butyrate (HB) caused a decrease in pHi of ∼0.3 units in oocytes expressing Rhbg, usually accompanied by a small depolarization. The intracellular acidification is caused by butyrate diffusion into the cell, leading to release of intracellular H+ (19), as shown in the following reaction
| (3) |
As HB is transported into the cell, reaction 3 is shifted to the left, causing consumption of surface H+ that we were able to detect as an increase in pHs and not a decrease as with NH3/NH4+.
In another example, CO2 exposure (switch from HEPES to CO2/HCO3−) causes intracellular acidification by an average of ∼0.28 in the oocyte due to diffusion of CO2 across the cell membrane. The pHs that accompanies this change is an alkalinization caused by a leftward shift of the following reaction
| (4) |
and, thus, consumption of H+. This was confirmed by us and was published by others (16).
Evidence for Simultaneous NH3 and NH4+ Transport
Interestingly, although NH3/NH4+ produces an abrupt fall in pHs in oocytes expressing RhAG, Rhbg, or Rhcg, only RhAG- and Rhbg-expressing oocytes exhibit a subsequent spontaneous recovery of pHs that is not seen in Rhcg-expressing oocytes and is generally faster than that observed in control oocytes (Figs. 8 and 9). Further inspection of the tracings shows that 1) the spontaneous pHs recovery in H2O-injected control oocytes exposed to NH3/NH4+ is much slower than in oocytes expressing Rh proteins, 2) there is a complete lack of pHs recovery in control oocytes exposed to MA/MA+, 3) there is no pHs recovery in Rhcg-expressing oocytes exposed to either NH3/NH4+ or MA/MA+, 4) the pHs recovery in RhAG- or Rhbg-expressing oocytes exposed to MA/MA+ is much slower than that observed when these same oocytes are exposed to NH3/NH4+ (Figs. 8 and 9), and 5) the pHs recovery in Rhbg-expressing oocytes exposed to MA/MA+ is much faster than that in RhAG-expressing oocytes exposed to the same solution. The spontaneous pHs recovery in RhAG- and Rhbg-expressing oocytes is rapid initially but slows with time. The rapid phase of pHs recovery is consistent with subsequent cellular influx of NH4+ (and MA+), which equilibrates across the plasma membrane during the course of a few minutes, resulting in the slowing of the pHs recovery observed in our tracings. In essence, rapid NH3 influx shifts the equilibrium reaction (reaction 1) to the right initially, whereas subsequent influx of NH4+ consumes surface H+ by shifting the reaction to the left. Although it could be suggested that the spontaneous pHs recovery may be due to diffusion of H+ at the surface of the oocyte out of the surface unstirred boundary layer (between the electrode and the cell) and into the bulk solution (rather than subsequent influx of NH4+), the fact that the rates of pHs recovery differ between experimental (RhAG- and Rhbg-expressing) and control oocytes argues against this possibility. Similarly, the absence of pHs recovery in Rhcg-expressing oocytes also suggests that the spontaneous recovery is not due to H+ leak from the microdomain between the electrode tip and the oocyte membrane.
Surface acidification was also recorded in RhAG- and Rhbg-expressing oocytes exposed to MA/MA+ solution, suggesting that both transporters favor initial net MA influx over MA+ entry. Recall that these transporters (Rhbg and RhAG) were found to transport MA+ based on our TEV-clamp data. Exposure to MA/MA+ solution did not cause significant surface acidification in Rhcg-expressing and control oocytes. One possibility is that in Rhcg-expressing and control oocytes the relative influx of MA and MA+ may be equal, and, therefore, no change in pHs can be detected. However, given that our TEV-clamp data show no evidence for MA+ influx (no inward current), we conclude that neither MA nor MA+ is being significantly transported by Rhcg-expressing or H2O-injected oocytes. In the case of Rhcg-expressing oocytes, this may indicate lack of substrate selectivity by Rhcg for MA/MA+. In the case of control oocytes, this indicates that native transport mechanisms (those that can transport NH3/NH4+) are not able to transport MA/MA+.
Finally, our pHi measurements provide further evidence that RhAG simultaneously transports both the ionic NH4+ (and MA+) and the neutral NH3 (and MA) species. Exposure of both experimental (RhAG- and Rhcg-expressing) and control oocytes to NH3/NH4+ caused a decrease in pHi in all oocyte groups. In contrast, exposure of RhAG oocytes to MA/MA+ caused an increase in pHi (Fig. 4), whereas exposure of Rhcg-expressing or control oocytes to MA/MA+ caused a very small, if any, increase in pHi (Figs. 5 and 6). The dpHi/dt calculated from the initial slope of our tracings is a measure of the relative flux of NH3/NH4+ or MA/MA+. As previously mentioned, we expect that an increase in NH4+ influx would result in a faster rate of pHi decrease, because NH4+ entering the oocyte would dissociate instantaneously into NH3 and H+. This H+ resulting from the dissociation of NH4+ is depicted by the acidification rate (−dpHi/dt) measurements and is a reflection of the NH4+-induced accumulation of intracellular H+. Similarly, MA-induced H+ consumption can be defined as the H+ consumed during intracellular formation of MA+. Therefore, MA influx can be indirectly estimated from the rate of MA-induced pHi increase. In our experiments the rate of NH4+-induced pHi decrease was significantly higher in RhAG-expressing than control and Rhcg-expressing oocytes. Hence, our data strongly support enhanced net NH4+ transport by RhAG. The rate of MA-induced pHi increase was also significantly higher in RhAG-expressing than control and Rhcg-expressing oocytes. Accordingly, our data strongly support enhanced MA transport by RhAG. The fact that RhAG is capable of transporting the NH3 analog MA provides further evidence for electroneutral transport by RhAG. This also indicates that, in pHi measurements, NH3 influx by RhAG is masked by the NH4+ influx, since our pH measurements are dependent on the relative flux of NH3 to NH4+ and are only a measure of the difference in these two fluxes. This is confirmed by the NH3-induced pHs measurements as discussed above.
Our results indicate that RhAG enhances the influx of net NH3 (as suggested by greater acidification of pHs), yet it also increases the influx of net NH4+ [indicated by faster rate of NH4+-induced intracellular acidification (−dpHi/dt)]. However, paradoxically, the enhanced NH3 influx is not detected by pHi measurements, expected in this case as transient pHi increase. This may be explained by the fact that our pHs electrodes have a larger tip diameter, so as not to impale the oocyte during pHs measurements. This causes our pHs electrodes to have a lower resistance and correspondingly faster response time during measurements. As can be seen in our pHs tracings, the −ΔpHs upon exposure to NH4Cl solution is instantaneous and followed by a subsequent rapid partial recovery of pHs, which slows with time. We attribute the rapid pHs recovery to net NH4+ entry that decreases with time due to equilibration in this restricted unstirred domain.
In addition to pHi measurements, simultaneous measurements of Vm showed NH3/NH4+-induced depolarization of the membrane in all oocyte groups, consistent with NH4+ entry. However, the membrane depolarizations in RhAG- and Rhcg-expressing oocytes were not significantly larger than those in control oocytes (Fig. 7C). After exposure to MA/MA+, changes in Vm were observed only in RhAG-expressing oocytes, and not in Rhcg-expressing or control oocytes. This is consistent with our observation that MA+ entry occurred only in RhAG-expressing oocytes, and not in Rhcg-expressing and control oocytes, and is, therefore, the likely reason for the significant depolarization.
Factors To Be Considered in Characterizing NH3/NH4+ Transport
In our study we characterized NH3/NH4+ transport by Rh glycoproteins on the basis of measurements of I, pHs, and pHi. These measurements provide multiple parameters for an accurate evaluation of the complex process of NH3 and NH4+ transport. However, other points need to be considered as well. Among those are the following.
Does the NH4+-induced inward current completely explain the intracellular acidification?
In other words, to what degree is the charge change coupled to the pHi change? To answer this question, we estimated intracellular NH4+ concentration based on short-circuit current measurements (see appendix). By our calculations, the steady-state intracellular NH4+ concentration corresponding to the measured ΔI was 0.197 mM. This steady-state value is too small to explain the measured ΔpHi of 0.28. In fact, a ΔpHi of 0.28 would require an accumulation of 646 mM NH4+ at a steady state to cause this change in pHi. However, as intracellular NH4+ accumulates inside the cell, a loss of intracellular NH3 (by sequestration, metabolism, or transport) would shift the reaction (NH4+ → NH3 + H+) to the right, leading to substantial pHi decrease. We discussed this issue in a previous publication (22), and similar results were recently reported and published by others who reached essentially the same conclusion (17).
Possible coupling of Rh proteins to endogenous acid-extruding mechanisms in the oocyte.
In the oocyte system, this scenario is unlikely for the following reasons. The two most likely non-HCO3− acid-extruding mechanisms are the Na/H exchanger and H+-ATPase. Both mechanisms, if present in the oocyte, seem to work at a very low rate. For example, removal of bath Na+, which reverses Na/H exchange and should, in principle, substantially decrease pHi, causes very little change in pHi (22), and amiloride has no effect on pHi. Moreover, changing bath pH from 7.5 to 8.2 or 6.8 also causes no visible change in pHi, suggesting that H+-ATPase is also not effective (19). More importantly, after an acid load (by butyrate, CO2, or even NH3/NH4+), there is no spontaneous pHi recovery (no undershoot). Recovery of pHi occurs only after removal of butyrate, CO2, or NH3/NH4+, and the recovery rate is very slow, suggesting that acid extrusion is absent or sluggish. However, in native tissues such as the kidney collecting duct, the coupling of Rhbg and/or Rhcg to endogenous acid-base transporters is very plausible.
Is Rhcg expressed properly in the oocyte?
In oocytes expressing Rhcg, exposure to NH3/NH4+ induced changes in pHi (dpHi/dt and Vm) that closely resembled those in H2O-injected control oocytes. This could imply that Rhcg may not be expressed in the oocyte or that it is not inserted in the membrane. We therefore confirmed by immunohistochemistry that Rhcg was properly expressed in the oocyte membrane, as shown in Fig. 11. Furthermore, measurements of pHs indicated a significant difference between H2O-injected and Rhcg-expressing oocytes, consistent with a role of Rhcg in electroneutral transport of NH3 as discussed above.
Fig. 11.
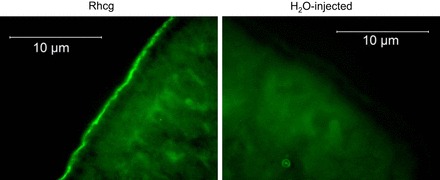
Expression of Rhcg in oocytes. Left: immunolabeling of Rhcg (green) at the membrane of oocytes injected with cRNA for Rhcg. Right: no labeling of Rhcg in H2O-injected oocytes.
Conclusions
We discussed four possible mechanisms of transport that had been proposed by various groups. The first proposal was put forth by Westhoff et al. (30), who suggested that these proteins served as electroneutral countertransporters of MA+ (or NH4+) coupled to H+ efflux. In effect, they concluded that RhAG transported net NH3 equivalents without causing changes in pHi. Contrary to this proposal, our pHi studies demonstrate that RhAG and Rhbg serve as electrogenic transporters of NH4+ and that NH4+ transport is not likely coupled to H+ efflux. This is evident in our pHi tracings, where NH4+ entry causes a decrease in pHi. An electroneutral NH4+/H+ exchanger is not expected to cause significant pHi decrease. A second proposed mechanism was that Rh glycoproteins transport only the neutral NH3 gas species (15, 17). Our pHi and I data clearly show that some Rh glycoproteins also transport the ionic NH4+ species in an electrogenic manner. This is especially evident in the inward currents observed in oocytes expressing RhAG and Rhbg. A third proposal suggested that RhCG transported NH3 without affecting NH4+ permeability (15). Our studies indicate that Rhcg is likely an NH3 transporter. This is evident in our pHs measurements, where we observe significant surface acidification, caused by influx of NH3, in Rhcg-expressing oocytes upon NH4Cl exposure. The lack of a subsequent pHs recovery and the absence of inward currents, both of which would indicate NH4+ transport, provide further evidence for the role of Rhcg as a predominantly NH3 transporter. A fourth proposed mechanism was that Rh glycoproteins promote only efflux of NH4+ (13). Our pHi and I measurements show intracellular acidification, not alkalinization, and an inward current consistent with NH4+ influx. However, this does not preclude the possibility that bidirectional movement of NH4+ is likely.
Cellular transport of NH3/NH4+ is important in tissues and, particularly, in the kidney, where renal excretion of NH4+ in the urine is critical for regulation of acid-base balance. In the collecting duct, secretion of total ammonia (NH3/NH4+) occurs along the length of the tubule, where it contributes to net acid excretion by the kidney. The secretion of NH3/NH4+ in this segment is a complex process that involves transcellular NH3 and NH4+ transport. The apical membrane of the collecting duct cells (where Rhcg is expressed) is the site where rapid NH3 diffusion has to occur, yet permeability of this membrane to NH3 is rate-limiting. On the other hand, the basolateral membrane (where Rhbg is expressed) is the site where NH4+ transport occurs, presumably by NH4+ transporters. Our data showing net NH3 and NH4+ transport by Rhcg and Rhbg are consistent with a role for these transporters in renal NH3/NH4+ transport. It is likely, for example, that Rhbg transports NH4+ (and possibly NH3) at the basolateral membrane and that Rhcg predominantly transports NH3 at the apical membrane. As such, Rhbg and Rhcg, working in tandem, function as the elusive NH3/NH4+ transporters in the kidney to explain how the distal nephron achieves net transepithelial NH3/NH4+ transport.
In summary, our data support the following conclusions. 1) RhAG and Rhbg transport the ionic NH4+ and the neutral NH3 species. 2) Transport of NH4+ is electrogenic. 3) RhAG and Rhbg expression enhance MA transport, an electroneutral component. 4) Like Rhbg, RhAG also transports MA+, an electrogenic component. The charged MA+ seems to be a direct substrate for RhAG. 5) Rhcg is likely a predominantly NH3 transporter. 6) RhAG and Rhbg are unlikely to be NH4+/H+ exchangers. These data, which clearly show robust NH4+ transport (in addition to NH3) by Rhbg and, predominantly, NH3 transport by Rhcg, support an important role for these transporters in transepithelial NH3/NH4+ transport in the kidney. The dual role of Rh proteins as NH3 and NH4+ transporters is a unique property and may be critical in understanding renal handling of acid-base homeostasis.
GRANTS
This work was supported by Veterans Affairs Merit Grant BX 001513 (Southeast Louisiana Veterans Health Care System), National Institutes of Health, National Institute of Diabetes and Digestive and Kidney Diseases Grant RO1-DK-6225, and Tulane institutional funds. The contents of this paper do not represent the views of the US Department of Veterans Affairs or the United States Government.
DISCLOSURES
No conflicts of interest, financial or otherwise, are declared by the authors.
AUTHOR CONTRIBUTIONS
T.C., K.B., M.T.I., and N.L.N. performed the experiments; T.C., S.A.-N., and N.L.N. analyzed the data; T.C., S.A.-N., L.L.H., and N.L.N. interpreted the results of the experiments; T.C. and N.L.N. prepared the figures; T.C. drafted the manuscript; T.C., S.A.-N., L.L.H., and N.L.N. approved the final version of the manuscript; S.A.-N., L.L.H., and N.L.N. developed the concept and designed the research; S.A.-N. and N.L.N. edited and revised the manuscript.
Appendix
Estimating intracellular NH4+ concentration from whole cell current measurements.
If it is assumed that all the measured inward current is caused by influx of bath NH4+, it is possible to theoretically estimate intracellular NH4+ from the measured change in inward current. In RhAG-expressing oocytes, exposure to 5 mM NH4+ caused a change in whole cell current (ΔI) of −68.4 ± 9.5 nA over an average of ∼250 s. The number of coulombs (Q) that are presumably carried by movement of NH4+ can be calculated as
If NH4+ transfer is responsible for all this charge, then the number of moles of NH4+ that would cause this change can be calculated by dividing by Faraday's constant
For an oocyte volume of 0.9 μl (assuming a spherical volume with a diameter of 1.2 mm), the calculated change in intracellular NH4+ concentration is
Calculating concentration of intracellular NH4+ from changes in pHi assuming that all the pHi change was caused by accumulating NH4+ intracellularly.
If it is assumed that the NH3/NH4+-induced change in pHi of 0.28 ± 0.03 (measured) in oocytes expressing RhAG is caused solely by NH4+ influx and that there is no permeability to NH3, it is possible to calculate the concentration of intracellular NH4+ from the change in pHi and the buffering power (β). The intrinsic buffering power in the oocyte is calculated to be 12.4 ± 1.6 mM/pH unit from CO2-induced pHi changes as described by Boron and De Weer (4a). Accordingly,
Because H+ is formed from dissociation of NH4+, an equivalent amount of NH3 of 3.47 mM is formed. With the assumptions of no loss of NH3 and a pKa of 9.25 for the NH4+/NH3 equilibrium, then at pHi 6.98 (pHi after exposure to NH3/NH4+)
Obviously, this is an unrealistically large amount to accumulate intracellularly and is many orders of magnitude greater than the calculated intracellular NH4+ from current measurements. It is likely, however, that there is a loss of intracellular NH3 (by sequestration, transport, or metabolism), which can lead to intracellular acidification by rightward shift of the reaction NH4+ = NH3 + H+ and generation of H+. We discussed this possibility previously (22), and others (17) proposed similar conclusions.
REFERENCES
- 1.Ammann D, Lanter F, Steiner RA, Schulthess P, Shijo Y, Simon W. Neutral carrier based hydrogen ion selective microelectrode for extra- and intracellular studies. Anal Chem 53: 2267–2269, 1981. [DOI] [PubMed] [Google Scholar]
- 2.Avent ND, Madgett TE, Lee ZE, Head DJ, Maddocks DG, Skinner LH. Molecular biology of Rh proteins and relevance to molecular medicine. Expert Rev Mol Med 8: 1–20, 2006. [DOI] [PubMed] [Google Scholar]
- 3.Bakouh N, Benjelloun F, Hulin P, Brouillard F, Edelman A, Cherif-Zahar B, Planelles G. NH3 is involved in the NH4+ transport induced by the functional expression of the human Rh C glycoprotein. J Biol Chem 279: 15975–15983, 2004. [DOI] [PubMed] [Google Scholar]
- 4.Benjelloun F, Bakouh N, Fritsch J, Hulin P, Lipecka J, Edelman A, Planelles G, Thomas SR, Cherif-Zahar B. Expression of the human erythroid Rh glycoprotein (RhAG) enhances both NH3 and NH4+ transport in HeLa cells. Pflügers Arch 450: 155–167, 2005. [DOI] [PubMed] [Google Scholar]
- 4a.Boron WF, De Weer P. Intracellular pH transients in squid giant axons caused by CO2, NH3, and metabolic inhibitors. J Gen Physiol 67: 91–112, 1976. [DOI] [PMC free article] [PubMed] [Google Scholar]
- 5.Han KH, Croker BP, Clapp WL, Werner D, Sahni M, Kim J, Kim HY, Handlogten ME, Weiner ID. Expression of the ammonia transporter, Rh C glycoprotein, in normal and neoplastic human kidney. J Am Soc Nephrol 17: 2670–2679, 2006. [DOI] [PMC free article] [PubMed] [Google Scholar]
- 6.Han KH, Lee HW, Handlogten ME, Whitehill F, Osis G, Croker BP, Clapp WL, Verlander JW, Weiner ID. Expression of the ammonia transporter family member, Rh B glycoprotein, in the human kidney. Am J Physiol Renal Physiol 304: F972–F981, 2013. [DOI] [PMC free article] [PubMed] [Google Scholar]
- 7.Han KH, Mekala K, Babida V, Kim HY, Handlogten ME, Verlander JW, Weiner ID. Expression of the gas-transporting proteins, Rh B glycoprotein and Rh C glycoprotein, in the murine lung. Am J Physiol Lung Cell Mol Physiol 297: L153–L163, 2009. [DOI] [PMC free article] [PubMed] [Google Scholar]
- 8.Handlogten ME, Hong SP, Zhang L, Vander AW, Steinbaum ML, Campbell-Thompson M, Weiner ID. Expression of the ammonia transporter proteins Rh B glycoprotein and Rh C glycoprotein in the intestinal tract. Am J Physiol Gastrointest Liver Physiol 288: G1036–G1047, 2005. [DOI] [PubMed] [Google Scholar]
- 9.Huang CH, Ye M. The Rh protein family: gene evolution, membrane biology, and disease association. Cell Mol Life Sci 67: 1203–1218, 2010. [DOI] [PMC free article] [PubMed] [Google Scholar]
- 10.Lee HW, Verlander JW, Handlogten ME, Han KH, Cooke PS, Weiner ID. Expression of the rhesus glycoproteins, ammonia transporter family members, RHCG and RHBG in male reproductive organs. Reproduction 146: 283–296, 2013. [DOI] [PMC free article] [PubMed] [Google Scholar]
- 11.Ludewig U. Electroneutral ammonium transport by basolateral rhesus B glycoprotein. J Physiol 559: 751–759, 2004. [DOI] [PMC free article] [PubMed] [Google Scholar]
- 12.Mak DO, Dang B, Weiner ID, Foskett JK, Westhoff CM. Characterization of ammonia transport by the kidney Rh glycoproteins RhBG and RhCG. Am J Physiol Renal Physiol 290: F297–F305, 2006. [DOI] [PMC free article] [PubMed] [Google Scholar]
- 13.Marini AM, Matassi G, Raynal V, Andre B, Cartron JP, Cherif-Zahar B. The human rhesus-associated RhAG protein and a kidney homologue promote ammonium transport in yeast. Nat Genet 26: 341–344, 2000. [DOI] [PubMed] [Google Scholar]
- 14.Marini AM, Urrestarazu A, Beauwens R, Andre B. The Rh (rhesus) blood group polypeptides are related to NH4+ transporters. Trends Biochem Sci 22: 460–461, 1997. [DOI] [PubMed] [Google Scholar]
- 15.Mouro-Chanteloup I, Cochet S, Chami M, Genetet S, Zidi-Yahiaoui N, Engel A, Colin Y, Bertrand O, Ripoche P. Functional reconstitution into liposomes of purified human RhCG ammonia channel. PLos One 5: e8921, 2010. [DOI] [PMC free article] [PubMed] [Google Scholar]
- 16.Musa-Aziz R, Chen LM, Pelletier MF, Boron WF. Relative CO2/NH3 selectivities of AQP1, AQP4, AQP5, AmtB, and RhAG. Proc Natl Acad Sci USA 106: 5406–5411, 2009. [DOI] [PMC free article] [PubMed] [Google Scholar]
- 17.Musa-Aziz R, Jiang L, Chen LM, Behar KL, Boron WF. Concentration-dependent effects on intracellular and surface pH of exposing Xenopus oocytes to solutions containing NH3/NH4+. J Membr Biol 228: 15–31, 2009. [DOI] [PMC free article] [PubMed] [Google Scholar]
- 18.Nakhoul NL, Abdulnour-Nakhoul SM, Boulpaep EL, Rabon E, Schmidt E, Hamm LL. Substrate specificity of Rhbg: ammonium and methyl ammonium transport. Am J Physiol Cell Physiol 299: C695–C705, 2010. [DOI] [PMC free article] [PubMed] [Google Scholar]
- 19.Nakhoul NL, Abdulnour-Nakhoul SM, Schmidt E, Doetjes R, Rabon E, Hamm LL. pH sensitivity of ammonium transport by Rhbg. Am J Physiol Cell Physiol 299: C1386–C1397, 2010. [DOI] [PMC free article] [PubMed] [Google Scholar]
- 20.Nakhoul NL, Davis BA, Romero MF, Boron WF. Effect of expressing the water channel aquaporin-1 on the CO2 permeability of Xenopus oocytes. Am J Physiol Cell Physiol 274: C543–C548, 1998. [DOI] [PubMed] [Google Scholar]
- 21.Nakhoul NL, Dejong H, Abdulnour-Nakhoul SM, Boulpaep EL, Hering-Smith K, Hamm LL. Characteristics of renal Rhbg as an NH4+ transporter. Am J Physiol Renal Physiol 288: F170–F181, 2005. [DOI] [PubMed] [Google Scholar]
- 22.Nakhoul NL, Hering-Smith KS, Abdulnour-Nakhoul SM, Hamm LL. Transport of NH3/NH4+ in oocytes expressing aquaporin-1. Am J Physiol Renal Physiol 281: F255–F263, 2001. [DOI] [PubMed] [Google Scholar]
- 23.Nakhoul NL, Hamm LL. Characteristics of mammalian Rh glycoproteins (SLC42 transporters) and their role in acid-base transport. Mol Aspects Med 34: 629–637, 2013. [DOI] [PMC free article] [PubMed] [Google Scholar]
- 24.Nakhoul NL, Schmidt E, Abdulnour-Nakhoul SM, Hamm LL. Electrogenic ammonium transport by renal Rhbg. Transfus Clin Biol 13: 147–153, 2006. [DOI] [PubMed] [Google Scholar]
- 25.Quentin F, Eladari D, Cheval L, Lopez C, Goossens D, Colin Y, Cartron JP, Paillard M, Chambrey R. RhBG and RhCG, the putative ammonia transporters, are expressed in the same cells in the distal nephron. J Am Soc Nephrol 14: 545–554, 2003. [DOI] [PubMed] [Google Scholar]
- 26.Sackin H, Boulpaep EL. Isolated perfused salamander proximal tubule: methods, electrophysiology, and transport. Am J Physiol Renal Fluid Electrolyte Physiol 241: F39–F52, 1981. [DOI] [PubMed] [Google Scholar]
- 27.Siebens AW, Boron WF. Effect of electroneutral luminal and basolateral lactate transport on intracellular pH in salamander proximal tubules. J Gen Physiol 90: 799–831, 1987. [DOI] [PMC free article] [PubMed] [Google Scholar]
- 28.Weiner ID, Verlander JW. Ammonia transport in the kidney by rhesus glycoproteins. Am J Physiol Renal Physiol 306: F1107–F1120, 2014. [DOI] [PMC free article] [PubMed] [Google Scholar]
- 29.Weiner ID, Verlander JW. Renal and hepatic expression of the ammonium transporter proteins, Rh B glycoprotein and Rh C glycoprotein. Acta Physiol Scand 179: 331–338, 2003. [DOI] [PubMed] [Google Scholar]
- 30.Westhoff CM, Ferreri-Jacobia M, Mak DO, Foskett JK. Identification of the erythrocyte Rh blood group glycoprotein as a mammalian ammonium transporter. J Biol Chem 277: 12499–12502, 2002. [DOI] [PubMed] [Google Scholar]
- 31.Zidi-Yahiaoui N, Mouro-Chanteloup I, D'Ambrosio AM, Lopez C, Gane P, Le van Kim C, Cartron JP, Colin Y, Ripoche P. Human rhesus B and rhesus C glycoproteins: properties of facilitated ammonium transport in recombinant kidney cells. Biochem J 391: 33–40, 2005. [DOI] [PMC free article] [PubMed] [Google Scholar]


