

Abstract
Amylin enhances arcuate (ARC) and ventromedial (VMN) hypothalamic nuclei leptin signaling and synergistically reduces food intake and body weight in selectively bred diet-induced obese (DIO) rats. Since DIO 125I-amylin dorsomedial nucleus-dorsomedial VMN binding was reduced, we postulated that this contributed to DIO ventromedial hypothalamus (VMH) leptin resistance, and that impairing VMH (ARC + VMN) calcitonin receptor (CTR)-mediated signaling by injecting adeno-associated virus (AAV) expressing a short hairpin portion of the CTR mRNA would predispose diet-resistant (DR) rats to obesity on high-fat (45%) diet (HFD). Depleting VMH CTR by 80–90% in 4-wk-old male DR rats reduced their ARC and VMN 125I-labeled leptin binding by 57 and 51%, respectively, and VMN leptin-induced phospho-signal transducer and activator of transcription 3-positive neurons by 59% vs. AAV control rats. After 6 wk on chow, VMH CTR-depleted DR rats ate and gained the equivalent amount of food and weight but had 18% heavier fat pads (relative to carcass weight), 144% higher leptin levels, and were insulin resistant compared with control AAV DR rats. After 6 wk more on HFD, VMH CTR-depleted DR rats ate the same amount but gained 28% more weight, had 60% more carcass fat, 254% higher leptin levels, and 132% higher insulin areas under the curve during an oral glucose tolerance test than control DR rats. Therefore, impairing endogenous VMH CTR-mediated signaling reduced leptin signaling and caused DR rats to become more obese and insulin resistant, both on chow and HFD. These results suggest that endogenous VMH amylin signaling is required for full leptin signaling and protection from HFD-induced obesity.
Keywords: calcitonin receptor, arcuate nucleus, ventromedial nucleus, insulin resistance, pSTAT3
amylin is a 37-amino acid peptide pancreatic β-cell hormone coreleased with insulin in response to food intake (32). Amylin acts on a heterodimeric receptor complex composed of one of two Gs/Gq-protein-coupled calcitonin receptors (CTRA or CTRB), combined with one of three receptor activity modifying proteins (RAMP1, -2, and -3) (1, 19, 25, 27). CTRA is the most prevalent isoform and is widely expressed in the periphery and brain (1, 26). CTRB is found only in brain but at lower levels than CTRA. RAMP1, -2, and -3 increase the affinity of amylin for CTRA (3, 52, 76). The mRNA and protein for CTRA and CTRB are present in the ventromedial nucleus (VMN) and arcuate (ARC) hypothalamic nuclei where their genes, as are those for RAMP1, -2 and, -3, are expressed in equal proportions (10, 35). There are high levels of 125I-labeled amylin binding to its receptor complex in dispersed brain areas. These include the area postrema (AP), the caudal nucleus tractus solitarius (NTS), dorsomedial hypothalamic nucleus (DMN), and the dorsomedial portion of the VMN (VMNdm) (Fig. 1) (35, 60, 74).
Fig. 1.
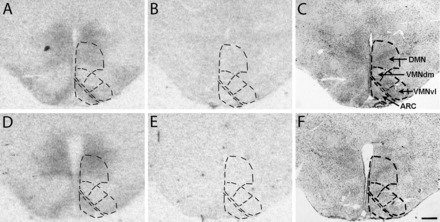
Representative 125I-labeled amylin receptor binding autoradiograms from diet-induced obese (DIO; A–C) and diet-resistant (DR; D–F) rats in sections through the midpoint of the arcuate (ARC), ventromedial (VMN), and dorsomedial hypothalamic nuclei (DMN). Readings for Fig. 2 were taken in the ARC and the combined DMN and dorsomedial portion of the VMN (VMNdm) and ventrolateral portion of the VMN (VMNvl), as delineated in the respective areas outlined by dotted lines. Total binding (A and D), nonspecific binding (B and E), and cresyl violet (C and F) stained sections, from which autoradiograms in A and D were generated, are shown.
Eating elicits an early rise in circulating amylin levels (68) and peripheral amylin administration reduces eating within minutes, most likely by its rapid access to its receptors in the AP (45), a circumventricular organ that lacks a blood-brain barrier (21). Amylin's actions in the AP/NTS contribute to meal termination and reduction of meal size similar to other satiety hormones, such as cholecystokinin (43, 50, 67). However, peripherally administered amylin also amplifies the leptin-induced phosphorylation of signal transducer and activator of transcription 3 (pSTAT3) in the ARC and VMN [VMN hypothalamus (VMH)] (80) and increases the expression of proopiomelanocortin (POMC) mRNA (70). These actions most likely reflect amylin's ability to cross the blood-brain barrier to reach neurons in the ARC and VMN (6, 7). While intrahypothalamic amylin reduces food intake in rats, this requires supraphysiological doses (16, 17), making it unlikely to be a primary site at which peripheral amylin acts on its own as a short-term satiation factor. On the other hand, chronic peripheral (2, 44) and central (73) amylin administration decreases body weight and fat gain. Most importantly, pharmacological doses of amylin have a prominent synergistic or additive effect with leptin on reducing food intake and body weight in obese rats and humans (2, 18, 20, 44, 55, 66, 71, 72, 77, 78).
Amylin's enhancement of leptin's catabolic effects are paralleled by amylin's increase in leptin-induced pSTAT3 (35, 71, 80), 125I-labeled leptin receptor binding (80) and mRNA expression of the long (signaling) form of the leptin receptor (Lepr-b) (35). Our laboratory recently demonstrated (35) that this leptin sensitization occurs when amylin stimulates VMH microglia to produce and secrete IL-6, which, through its action on its IL-6/gp130 receptor, interacts downstream of Lepr-b to increase pSTAT3 expression. This coactivation of pSTAT3 expression is the presumptive mechanism by which exogenous amylin increases VMH leptin signaling (35, 71, 80).
We have used the selectively bred diet-induced obese (DIO) and diet-resistant (DR) rat strains to identify the mechanisms that contribute to the obesity that develops during ingestion of a high-fat diet (HFD) (37, 40). One of the prominent characteristics of the DIO rat is its inherent leptin resistance, which is present during the early postnatal period, before it becomes obese (24, 29, 30, 38, 39). Because of the dramatic ability of exogenously administered amylin to increase defective VMH leptin signaling and reduce food intake and body weight in obese DIO rats (35, 71, 80), we hypothesized that DIO rats might have decreased amylin signaling in the VMH as a contributor to their impaired leptin signaling. Our initial results demonstrated a decrease in 125I-labeled amylin binding to its receptor complex in the DMN/VMNdm of DIO rats (Fig. 2), which supported this hypothesis. The present studies were undertaken to test the hypothesis that endogenous CTR-mediated signaling is required for fully intact VMH leptin signaling. Although 125I-labeled amylin receptor binding was decreased in the DMN and VMNdm areas of DIO vs. DR rats, we chose to focus on the ARC and VMN in the present studies because of previous studies demonstrating a strong interaction between amylin and leptin signaling in these hypothalamic nuclei (35, 70, 80). Toward this aim, we utilized local VMH injection of an adeno-associated virus (AAV) expressing a short hairpin portion of CTR (CTR shRNA) to deplete the CTR component of the amylin receptor complex (3, 49) in the VMH. We carried this out in the obesity-resistant DR rat to assess whether impairing VMH CTR-mediated signaling would similarly reduce their leptin signaling and make them prone to become obese on a HFD similarly to the DIO rats.
Fig. 2.
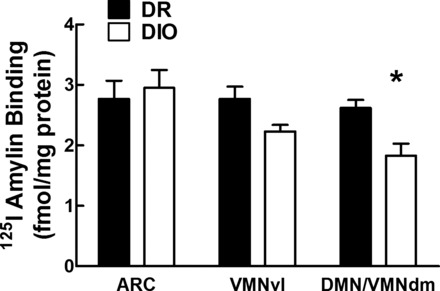
Specific 125I-labeled amylin receptor binding in the ARC, VMNvl, and DMN/VMNdm of adult male DR and DIO rats fed chow from weaning. Specific binding = total − nonspecific binding. Values are means ± SE. *P ≤ 0.05 when binding (fmol/mg protein) was compared between DIO and DR rats in the VMNdm.
METHODS
Animals
Animals were housed at 23–24°C on a reversed 12:12-h light-dark cycle (lights off at 0900). Male rats selectively bred to express the DR or DIO phenotypes (37) were raised in our in-house colony and used for all studies. Litters were culled to 10 pups per dam on postnatal day 2 (P2) and weaned at P21 onto Purina rat chow and water ad libitum. Purina rat chow (no. 5001) contains 13.5% fat, 28.5% protein, and 58% carbohydrate. In experiment 1, rats were also fed a 45% fat diet, which also contains 20% protein and 35% carbohydrate as a percentage of total energy content (Research Diets, New Brunswick, NJ). Throughout the course of all experiments, cumulative food intake and body weight measurements were obtained weekly. Terminally, rats were fasted 2 h before lights off and killed by decapitation with collection of trunk blood for glucose, insulin, and leptin assays after 2 h. Brains were removed and snap frozen on dry ice, followed by the removal and weighing of five representative fat pads (retroperitoneal, mesenteric, perirenal, epididymal, and inguinal), as well as the liver. All work was in compliance with the Institutional Animal Care and Use Committee of the E. Orange Veterans Affairs Medical Center, which reviewed and approved the studies.
Experiment 1
Groups of male DR rats (n = 8/group) were weaned onto chow at 3 wk of age and, at 23–28 days of age, were stereotaxically injected bilaterally in the ARC or VMN with 0.5 μl/site containing either an AAV (1.25 E9 genome copies) expressing green fluorescent protein (control) or an AAV designed to reduce expression of both CTRA and CTRB through expression of CTR shRNA (AAV CTR shRNA) together with green fluorescent protein (47, 49). A third group of DR rats (sham; n = 8) underwent anesthesia, but had no stereotaxic injections. All rats were fed chow for an additional 6 wk. After 6 wk on chow, tail blood was sampled for leptin, insulin, and glucose levels. Then all groups were switched to a 45% fat diet for an additional 6 wk. On the 4th wk on 45% fat diet (10 wk after AAV injections), they underwent an oral glucose tolerance test (OGTT) (23). They were assessed terminally for trunk blood glucose, insulin and leptin, brain punches for a variety of mRNA species (see below), and fat pad and liver weights.
Experiment 2
Based on the findings in experiment 1 demonstrating that VMH (ARC + VMN) CTR depletion caused DR rats to become obese on 45% fat diet, but with no substantial differences between sham and control AAV groups, a second set of studies was undertaken. These studies tested the hypothesis that reducing VMH amylin signaling would produce defective leptin signaling comparable to what is seen in chow-fed DIO rats, which are leptin resistant and predisposed to become obese on HFD (24, 36, 38, 39). Thus male DR rats were weaned onto chow at 3 wk of age and injected with control AAV or AAV CTR shRNA (n = 12/group) at 23–28 days of age as in experiment 1. An additional group of sham-operated DIO rats of comparable age (n = 12) was included for comparison. Given the relatively high titer of AAV used and the ∼90% depletion of VMH CTRA and CTRB in experiment 1, only 10% (1.25 E8 genome copies) of the original concentration of AAVs was used in this second set of studies. Rats were fed chow for 6 wk, and, during the 4th wk, all rats underwent an OGTT. During the 6th wk, each group was divided such that one-half of each group was perfused and assessed for leptin-induced pSTAT3 expression, and the other one-half was assessed for 125I-labeled leptin receptor binding in the ARC and VMN, respectively.
Stereotaxic Surgery
Rats were anesthetized with 80 mg/kg ketamine/7.5 mg/kg xylazine ip, placed in a stereotaxic frame, and injected bilaterally with 0.5 μl AAV into the ARC (9.6 mm) and VMN (9.3 mm from dura) at 5.9 mm anterior to the intra-aural line and 0.3 mm (ARC) or 0.6 mm (VMN) lateral to the midline. They were given buprenorphine 0.02 mg/kg sc postoperatively. Cannula placements were confirmed histologically postmortem.
Quantitative Real-Time PCR Assessment of CTR shRNA-Induced Changes in Gene Expression
Brains were removed, snap frozen on dry ice, and stored at −80°C for mRNA analysis by quantitative real-time PCR. Frozen brains were sectioned at 300 μm through the midpoint of the VMH (61), and slices were placed in RNA Later (Ambion, Grand Island, NY) until the ARC, VMN, or entire VMH was micropunched under microscopic guidance. Expression of mRNA was assayed by quantitative real-time PCR (Applied Biosystems, Grand Island, NY) using primers shown in Table 1. For data calculations, a standard curve was generated for each gene, and then the abundance of that gene in a given sample was expressed relative to this standard curve (i.e., fold change). This value was then normalized against constitutively expressed cyclophilin in that sample, as previously described (34, 59).
Table 1.
Quantitative PCR probe sets
| Gene | Genbank ID | Forward | Reverse | Probe |
|---|---|---|---|---|
| AGRP | NM_033650.1 | TCTCCGCGTCGCTGTGTA | CGCAGCAAGGTACCTGTTGTC | AGGACTCGTGCAGCCT |
| CTRB | NM_053816.2 | TGGTTGAGGTTGTGCCCAAT | GTTCCCACTGCATTGTCCACATATA | TCGCACCAGGTCTCC |
| Cyclophilin | NM_017101.1 | AATGGCACTGGTGGCAAGTC | GCCAGGACCTGTATGCTTCAG | TCTACGGAGAGAAATT |
| GP130 | NM_001008725.3 | GGATCTGGCTAATGCAAGCTTTG | GACAACTGGAAACTCAGGGTAGAT | CTGAGTCTATAGGTCAACTTG |
| IL6 | NM_012589.2 | TTCACAAGTCGGAGGCTTAATTACAT | GCATCATCGCTGTTCATACAATCAG | CACAACTCTTTTCTCATTTCC |
| IL6rα | NM_017020.3 | CACTATTTGTGCTTCCTGGATGATC | GCCACTCACAAAAGGCATTTACAAG | CTGGTGGATGTTCCCC |
| NPY | NM_012614.2 | TCGTGTGTTTGGGCATTCTG | GCGGAGTAGTATCTGGCCATGT | ACAATCCGGGCGAGGA |
| Leprb | NM_012596.1 | AACCTGTGAGGATGAGTGTCAGAGT | CCTTGCTCTTCATCAGTTTCCA | ATGCAACGCTGGTCAG |
| POMC | NM_139326.2 | GGCGTGCGGAGGAAGAG | GCCCTCCCGTGGACTTG | TGGCCGTCCGGAGC |
| RAMP1 | NM_031645.1 | GGAAGACTCTGTGGTGTGACT | GCCAGAAACAGCCAATCTTGT | TCACTGCACCAAACTC |
| RAMP2 | NM_031646.1 | GTGCAACTGGACTTTGATTAGCA | GCCTCGTACTCCAAGCAATACC | CAGGTTGCTGTAATACC |
| RAMP3 | NM_020100.2 | ACGTCTGGAAGTGGTGCAA | TGCAGTTAGTGAAGCTTTCGTAGT | CCTGTCGGAGTTCATC |
| SOCS3 | NM_053565.1 | CGCCGTGCGCAAGCT | TCGCCGCCGGTTACG | CTCCAGTAGAATCCG |
For most of the genes, TAQman MGB probe sets (Applied Biosystems) were designed by the manufacturer. This table shows the unlabeled forward and reverse PCR primers, along with the FAM-labeled probe sequence. For calcitonin (CTR) receptor A (CTRA) (GenBank ID NM_001034015.1), a predesigned TaqMan primer set was used (Applied Biosystems assay ID Rn01526770_m1). AGRP, agouti-related protein; CTRB, CTR receptor B; IL6rα, IL-6 receptor alpha; NPY, neuropeptide Y; Leprb, long (signaling) form of the leptin receptor; POMC, proopiomelanocortin; RAMP, receptor activity modifying protein; SOCS3, suppressors of cytokine signaling-3.
Leptin-Induced Expression of ARC and VMN pSTAT3 Immunohistochemistry
Food was removed at 2 h before lights off (0900) in one set of rats from experiment 2. At lights off, rats were injected intraperitoneally with 0.5 ml PBS containing rat leptin (5 mg/kg; National Hormone and Peptide Program, Torrance, CA). After 45 min, they were anesthetized with ketamine-xylazine and then rapidly perfused with ice-cold saline for 1 min, followed by ice-cold 4% paraformaldehyde for 10 min. Brain sections (30 μm) were cut through the mid-VMH (61) and then assayed for pSTAT3 immunocytochemistry, as previously described (58). Neurons expressing pSTAT3 were counted in three consecutive sections per brain using an image analysis system (Bioquant, Nashville, TN) by an experimentally naive observer. No rats were injected only with PBS to assess constitutive expression of pSTAT3, since our laboratory's previous studies demonstrated extremely low levels of such expression in the ARC and VMN of DIO and DR rats (38).
OGTT
Food was removed 2 h before lights off, and, at lights off, rats were gavaged with 0.5 g/kg, and blood was sampled by tail nip at 15, 30, 60, 90, and 120 min for glucose and insulin.
125I-Labeled Amylin Receptor Binding Autoradiography
Brains from groups of nonfasted male, 8 wk old, chow-fed DIO and DR rats (n = 8/group) were removed at lights out and quickly frozen on powdered dry ice. Sections (12 μm) were cut through the midpoint of the ARC, VMN, and DMN, pars compacta (Fig. 1) (61), mounted on gel-coated slides, desiccated, and stored at −80°C. Amylin receptor binding was carried out by methods adapted (35) from Sexton et al. (74). Briefly, sections were thawed and rinsed in incubation buffer (20 mM HEPES containing 100 mM NaCl, 1 mg/ml BSA, and 0.5 mg/ml bacitracin). Sections were then incubated at room temperature for 1 h in incubation buffer containing 70–75 pM 125I-labeled amylin (NEX44; Perkin Elmer, Boston, MA) or 70–75 pM radiolabeled amylin plus 1 μM unlabeled rat amylin (nonspecific “binding”; Bachem, Torrance, CA). Slides were rinsed in incubation buffer at 4°C and rinsed two more times at 4°C in modified incubation buffer (20 mM HEPES containing 100 mM NaCl). After a brief dip in dH2O, sections were dried under forced cold air and desiccated for 24 h. Sections were then exposed to BioMax MR Film (Kodak, Rochester, NY) at −80°C for 7–14 days. Quantification was carried out by an experimentally naive observer, whereby the areas to be read (ARC, DMN/VMN, and dorsolateral VMN) were first defined as shown in Fig. 1 on the same cresyl violet-stained section that had been used to generate that specific autoradiogram. This image was digitally superimposed on the autoradiographic image to assess binding density in the selected brain regions using computer-assisted densitometry (Drexel University, Philadelphia, PA). Film density was equated to the density of known 14C radioactive standards (calibrated against 125I) placed on each film, and binding was calculated directly from density and the specific activities of 125I-labeled amylin (29). Specific binding was calculated as the total binding in a specific area minus nonspecific “binding” as defined above. Nonspecific “binding” averaged 24% of total binding in the ARC and VMN.
125I-Labeled Leptin Receptor Binding Autoradiography
The procedure for 125I-labeled leptin binding was carried out by procedures previously established in our laboratory (29), as adapted from the original method of Baskin et al. (8). Frozen slides were brought to room temperature, dipped in cold 0.5% paraformaldehyde, and then rinsed several times in cold Tris buffer. Binding was carried out by incubating the slides for 1 h at room temperature in a solution containing 0.25 nM murine 125I-labeled leptin (PerkinElmer Life Sciences, Boston, MA), Tris·HCl (pH 7.2), 1% BSA (Sigma, St. Louis, MO), 0.05% leupeptin (Sigma), and 0.001% pepstatin (Sigma). Nonspecific binding (23% of total binding) was defined as that seen in the presence of a 1,000-fold excess of unlabeled rat leptin (National Hormone and Peptide Program, Torrance, CA), and this accounted for <30% of total binding. After 1 h incubation in the respective radioactive solutions, total and nonspecific labeled slides were rinsed in cold Tris·HCl and dipped in cold 4% paraformaldehyde, followed by a dip in Tris·HCl. The slides were dipped in cold distilled water, dried overnight, exposed to BioMax MR film (Kodak, Rochester, NY) for 3–5 days, and read by an experimentally naive observer, as described above.
Assays of Insulin, Leptin, Free Fatty Acid, β-Hydroxybutyrate, and Glucose
Plasma insulin and leptin levels were analyzed with radioimmunoassay and ELISA kits (EMD Millipore, Billerica, MA) with sensitivities of 0.8 ng/μl per 100 μl and 10-μl sample size, respectively. Blood glucose levels were measured using a glucose Analox instrument (Lunenburg, MA). Colorimetric assays from Wako Diagnostics (Mountainview, CA) were used to measure fatty acids (NEFA kit) and β-hydroxybutyrate (3-H3 kit).
Statistics
Groups were compared by one-way and repeated-measures ANOVA. Post hoc assessment was by Bonferroni correction for multiple comparisons. For OGTTs, areas under the curve (AUC) for insulin and glucose levels during the testing period were calculated using the trapezoidal rule. Insulin sensitivity index (ISI) was calculated according to the Matsuda and DeFronzo (46) formula: [10,000/square root of (fasting glucose × fasting insulin) × (mean glucose × mean insulin during OGTT)].
RESULTS
Experiment 1
125I-labeled amylin binding in DIO vs. DR rats.
To assess potential differences between the ability of amylin binding, receptor binding autoradiography was carried out in sections through the midpoint of the ARC-VMN-DMN area of the hypothalamus (Fig. 1) in adult DIO vs. DR rats. This binding was 30% lower in the VMNdm and DMN in DIO vs. DR rats (Fig. 2). There were no differences in binding between DIO and DR rats in the ARC or ventrolateral portion of the VMN.
Effects of depleting VMH CTR on energy homeostasis in DR rats fed low-fat diets and HFDs.
To test the hypothesis that the reduced amylin binding to its CTR-RAMP receptor complex in the VMH contributes to the propensity of DIO rats to become obese when fed a HFD, DR rats were injected in the VMH with either a control AAV or an AAV expressing CTR shRNA, and these results were compared with those of sham-operated DR rats. When fed chow from the time of VMH injections (4 wk of age) for 6 wk, there were no differences in body weight gain or food intake among the three groups (Fig. 3, Table 2). Given their similar weight gains and intakes, there were no intergroup differences in feed efficiency [body weight gain (g)/food intake (kcal)] after 6 wk on chow. However, blood samples drawn at the end of the 6 wk on chow showed that, despite the lack of differences in intake or weight gain, fasting plasma leptin levels in VMH CTR-depleted DR rats were 207 and 106% higher than sham- and control AAV-injected DR rats, respectively [F(2,17) = 13.7; P = 0.001; Table 2]. In keeping with the likely increase in adiposity of VMH CTR-depleted rats inferred by their increased leptin levels, these rats had 31 and 76% higher fasting insulin levels than sham and AAV control DR rats, respectively [F(2,17) = 21.7; P = 0.001; Table 1]. Thus, although depleting VMH CTR had no apparent effect on body weight gain or food intake, elevated plasma leptin and insulin levels in these rats suggested that they were more obese and possibly insulin resistant compared with sham- and control AAV-injected rats when fed only low-fat chow for 6 wk.
Fig. 3.
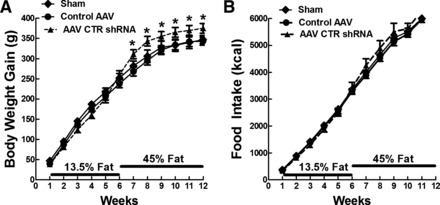
Experiment 1: body weight gain (A) and food intake (B) in DR rats that were sham, control adeno-associated virus (AAV), and AAV containing a short hairpin portion of the calcitonin receptor mRNA (AAV CTR shRNA) injected bilaterally in the ARC and VMN at 4 wk of age and fed chow (13.5% fat) for 6 wk, followed by 6 wk on 45% fat diet. Values are means ± SE. *P ≤ 0.05 when food intake and body weight gain data at a specific time point (on x-axis) in AAV CTR shRNA-injected rats were compared with that in sham and control AAV-injected rats by post hoc Bonferroni test after intergroup differences were found by one-way ANOVA for repeated measures.
Table 2.
Experiment 1: Morphometric and biochemical data for male DR rats injected at 4 wk of age with AAV control shRNA or AAV CTR shRNA in the VMH
| Sham | AAV Control | AAV CTR | |
|---|---|---|---|
| 6-wk chow | |||
| Initial body weight, g | 87.6 ± 4.2 | 89.8 ± 3.8 | 84.4 ± 5.7 |
| Body weight chow, g | 306 ± 8 | 301 ± 12 | 287 ± 14 |
| Body weight gain on chow, g | 218 ± 9 | 212 ± 9 | 202 ± 11 |
| Food intake on chow, kcal | 2,629 ± 42 | 2,619 ± 110 | 2,505 ± 135 |
| Feed efficiency on chow, BWG (g)/FI (kcal) × 1,000 | 83 ± 3 | 81 ± 3 | 81 ± 3 |
| Leptin, ng/ml | 5.14 ± 0.9a | 7.64 ± 0.89a | 15.8 ± 2.43b |
| Glucose, mg/dl | 137.63 ± 1.75 | 137.94 ± 7.46 | 138.69 ± 3.25 |
| Insulin, ng/ml | 0.80 ± 11a | 1.05 ± 0.10a | 1.85 ± 0.13b |
| 6-wk 45% fat diet | |||
| Body weight gain, g | 126 ± 9a | 131 ± 18a | 168 ± 13b |
| Food intake, kcal | 1,594 ± 39 | 1,560 ± 72 | 1,613 ± 87 |
| Feed efficiency, BWG (g)/FI (kcal) × 1,000 | 33 ± 1 | 35 ± 3 | 39 ± 5 |
| Total 6-wk chow, 6-wk 45% fat diet | |||
| Final body weight, g | 435 ± 14 | 433 ± 25 | 459 ± 23 |
| Total body weight gain, g | 347 ± 18 | 343 ± 23 | 375 ± 23 |
| Total food intake, kcal | 6,488 ± 173 | 6,310 ± 312 | 6,609 ± 370 |
| Feed efficiency total, BWG (g)/FI (kcal) × 1,000 | 53 ± 1 | 54 ± 2 | 54 ± 3 |
| Retroperitoneal, g | 9.28 ± 0.78a | 10.52 ± 0.79a | 13.87 ± 1.22b |
| Retroperitoneal, %BW | 2.15 ± 0.17a | 2.43 ± 0.12a,b | 3.00 ± 0.22b |
| Mesenteric, g | 7.79 ± 1.45a | 8.39 ± 0.81a | 15.0 ± 1.7b |
| Mesenteric, %BW | 1.79 ± 0.16a | 1.94 ± 0.17a | 3.31 ± 0.31b |
| Inguinal, g | 6.47 ± 0.68a | 8.77 ± 1.01a | 16.89 ± 1.03b |
| Inguinal, %BW | 1.81 ± 0.34a | 2.05 ± 0.25a | 3.35 ± 0.28b |
| Epididymal, g | 9.38 ± 0.66 | 11.0 ± 1.3 | 16.0 ± 1.7 |
| Epididymal, %BW | 2.18 ± 0.15a | 2.53 ± 0.20a | 3.75 ± 0.34b |
| Perirenal, g | 3.50 ± 0.12 | 4.05 ± 0.52 | 5.70 ± 0.68 |
| Perirenal, %BW | 0.81 ± 0.04 | 0.93 ± 0.08 | 1.14 ± 0.09 |
| Total fat pads, g | 38.0 ± 3.3a | 42.8 ± 3.8a | 70.4 ± 8.5b |
| Total fat pad/carcass weight, % | 8.07 ± 0.45a | 9.88 ± 0.68a | 15.8 ± 0.9b |
| Leptin, ng/ml | 11.2 ± 0.7a | 18.8 ± 2.3a | 39.6 ± 2.9b |
| Glucose, mg/dl | 148 ± 4 | 152 ± 6 | 143 ± 3 |
| Insulin, ng/ml | 1.75 ± 0.28a | 2.63 ± 0.46a,b | 3.66 ± 0.46b |
| Glucose AUC, mg·dl−1·120 min−1 | 4,932 ± 813 | 4,643 ± 606 | 5,731 ± 764 |
| Insulin AUC, mg·dl−1·120 min−1 | 87.9 ± 19.7a | 91.1 ± 17.7a | 204.1 ± 30.6b |
| Insulin sensitivity index | 34.2 ± 5.2a | 30.9 ± 4.2a | 17.4 ± 2.5b |
| Liver, g | 13.64 ± 1.08 | 12.80 ± 0.89 | 12.66 ± 0.68 |
| Naso-anal length, cm | 24.8 ± 0.2 | 24.4 ± 0.4 | 23.6 ± 0.3 |
Values are means ± SE; n = 7 AAV control shRNA rats; n = 8 AAV CTR shRNA rats. Additional diet-resistant (DR) rats were sham-injected (n = 7). Rats were maintained on chow diet for 6 wk, followed by 6 wk on 45% fat diet.
VMH, ventromedial hypothalamus; AAV CTR shRNA, adeno-associated virus containing a short hairpin portion of the CTR mRNA; AAV, adeno-associated virus; BW, body weight; BWG, BW gain; FI, food intake; AUC, area under the curve.
Data for each parameter with differing superscripted letters differ from each other by P = 0.05 by post hoc Bonferroni test after intergroup differences were found by one-way ANOVA.
When all three groups of DR rats were switched to a 45% HFD for 6 wk, there were no intergroup differences in food intake. However, VMH CTR-depleted rats gained 33 and 28% more weight than sham- and control AAV-injected rats, respectively, over the ensuing 6 wk [F(2,19) = 5.59; P = 0.05; Fig. 3, Table 2]. In keeping with their increased body weight gain, CTR-depleted rats had 65% heavier total fat pad weights [F(2,18) = 25.3; P = 0.001; Table 2] and 60% higher fat pad weights as a function of carcass weight compared with AAV controls [F(2,18) = 23.3; P = 0.001; Table 2]. This increased adiposity was distributed fairly equally among both intra-abdominal (retroperitoneal, mesenteric) and subcutaneous (inguinal) depots and was reflected in a 254 and 111% increase in plasma leptin levels compared with sham and control AAV-injected rats, respectively [F(2,17) = 41.9, P = 0.001; Table 2]. Fasting insulin levels in CTR-depleted rats were 109% greater than those in sham rats [F(2,19) = 5.57, P = 0.05], while insulin AUCs during an OGTT were 223 and 244% higher [F(2,17) = 14.8; P = 0.001], and ISIs were 44 and 49% lower than control AAV-injected and sham rats, respectively [F(2,17) = 12.9; P = 0.001; Table 2].
Effects of depleting VMH CTR on amylin-IL-6 signaling and energy homeostasis mRNAs.
Injecting AAV expressing CTR shRNA bilaterally into both the ARC and VMN reduced ARC CTRA [F(2,18) = 17.2, P = 0.001] and CTRB mRNA [F(2,18) = 10.3, P = 0.001] expression to 12% of control AAV levels (Table 3) and VMN CTRA to 14% [F(2,18) = 12.3, P = 0.001] and CTRB to 5% of control AAV levels [F(2,18) = 15.3, P = 0.001; Table 4]. As a consequence of depleting ARC CTR, RAMP1 mRNA was decreased by 24% [F(2,18) = 12.3, P = 0.001], while RAMP2 was increased by 17% relative to AAV controls [F(2,18) = 8.53, P = 0.01]. Furthermore, IL-6 mRNA was reduced by 67% compared with AAV controls [F(2,18) = 15.6, P = 0.001; Table 4], while there were no effects on the expression of the IL-6 receptor complex (IL6 receptor α, gp130), neuropeptide Y, agouti-related protein, POMC, Lepr-b, or suppressors of cytokine signaling-3 (SOCS3) expression. VMN depletion of CTR had no effects on any other mRNA species assessed (Table 4).
Table 3.
Experiment 1: Effects of VMH CTR depletion from 4 wk of age on arcuate gene expression in DR rats after 6 wk on chow and 6 wk on 45% fat diet
| Sham | AAV Control | AAV CTR shRNA | |
|---|---|---|---|
| CTRA | 2.92 ± 0.60a | 3.23 ± 0.70a | 0.37 ± 0.10b |
| CTRB | 2.16 ± 0.34a | 1.12 ± 0.21b | 0.12 ± 0.04c |
| RAMP1 | 1.20 ± 0.17a | 1.17 ± 0.15a | 0.90 ± 0.05b |
| RAMP2 | 1.28 ± 0.14a | 1.12 ± 0.07b | 1.31 ± 0.13a |
| RAMP3 | 0.94 ± 0.10 | 1.30 ± 0.20 | 1.11 ± 0.15 |
| NPY | 1.38 ± 0.32 | 1.02 ± 0.27 | 1.39 ± 0.25 |
| POMC | 1.75 ± 0.47 | 1.28 ± 0.48 | 1.03 ± 0.23 |
| AgRP | 1.51 ± 0.43 | 0.30 ± 0.45 | 1.24 ± 0.32 |
| IL-6 | 0.76 ± 0.09a | 2.82 ± 0.84b | 0.92 ± 0.19a |
| IL-6Rα | 0.72 ± 0.09 | 0.75 ± 0.12 | 1.01 ± 0.12 |
| gp130 | 0.93 ± 0.12 | 1.00 ± 0.21 | 0.95 ± 0.11 |
| Lepr-b | 1.09 ± 0.22 | 1.07 ± 0.20 | 1.22 ± 0.17 |
| SOCS3 | 0.86 ± 0.16 | 1.31 ± 0.34 | 1.03 ± 0.18 |
Values are means ± SE of duplicate determinations expressed relative to the amount of the mRNA expression of cyclophilin (n = 7–8/group).
Data for each parameter with differing superscripted letters differ from each other by P = 0.05 by post hoc Bonferroni test after intergroup differences were found by one-way ANOVA.
Table 4.
Experiment 1: Effects of VMH CTR depletion from 4 wk of age on ventromedial nucleus gene expression in DR rats after 6 wk on chow and 6 wk on 45% fat diet
| Sham | AAV Control | AAV CTR shRNA | |
|---|---|---|---|
| CTRA | 1.18 ± 0.25a | 1.73 ± 0.37a | 0.25 ± 0.13b |
| CTRB | 0.99 ± 0.19a | 1.30 ± 0.31a | 0.07 ± 0.04b |
| RAMP1 | 1.57 ± 0.29 | 1.75 ± 0.49 | 1.27 ± 0.23 |
| RAMP2 | 1.22 ± 0.10 | 0.90 ± 0.14 | 0.97 ± 0.12 |
| RAMP3 | 1.65 ± 0.17 | 1.55 ± 0.16 | 1.45 ± 0.16 |
| IL-6 | 0.77 ± 0.11 | 0.87 ± 0.13 | 0.82 ± 0.09 |
| IL-6Rα | 0.50 ± 0.16 | 1.06 ± 0.31 | 1.30 ± 0.30 |
| gp130 | 2.01 ± 0.19 | 2.38 ± 0.24 | 2.43 ± 0.23 |
| Lepr-b | 1.07 ± 0.13 | 0.95 ± 0.18 | 0.81 ± 0.12 |
| SOCS3 | 0.42 ± 0.11 | 0.74 ± 0.13 | 0.52 ± 0.03 |
Values are means ± SE of duplicate determinations expressed relative to the amount of the mRNA expression of cyclophilin (n = 7–8/group).
Data for each parameter with differing superscripted letters differ from each other by P = 0.05 by post hoc Bonferroni test after intergroup differences were found by one-way ANOVA.
Experiment 2
Effects of depleting VMH CTR on energy and glucose homeostasis in DR rats fed low-fat diet for 6 wk.
Inherent leptin resistance is a major factor predisposing selectively bred DIO rats to become obese when exposed to a HFD (24, 36, 38, 39). To test the hypothesis that the reduced DMN/VMNdm amylin receptor binding seen in DIO rats (Fig. 2) might underlie their reduced leptin signaling and propensity to become obese on HFD, DR rats were injected in the VMH at 4 wk of age with control AAV or AAV expressing CTR shRNA and compared with each other and to sham-injected DIO rats fed only low-fat chow diet for 6 wk. Similar to the results in experiment 1, DR rats injected in the VMH with AAV CTR shRNA gained the same amount of body weight and ate the same amount of food as control AAV DR rats (Fig. 4, Table 5). Despite similarities in weight gain and energy intake, VMH CTR-depleted DR rats had 18% more total fat and 25% heavier retroperitoneal fat pads (as a percentage of carcass weight) and 144% higher plasma leptin levels than control AAV-injected DR rats (Table 5). In keeping with their greater adiposity, CTR-depleted DR rats also had 30% higher plasma insulin levels, 25% higher insulin AUC during an OGTT, and 23% lower ISI than DR controls (Table 5). Their increased adiposity and likely insulin resistance was associated with an 81% decrease in total VMH (ARC + VMN) CTR mRNA compared with control AAV-injected DR rats (Table 5). Thus substantial depletion of intrinsic CTR amylin signaling caused DR rats fed only low-fat chow diet to become more obese and probably insulin resistant.
Fig. 4.
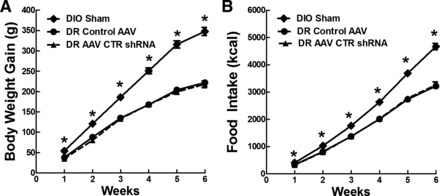
Experiment 2: body weight gain (A) and food intake (B) in DIO sham and DR rats that were injected with control AAV or AAV CTR shRNA bilaterally in the ARC and VMN at 4 wk of age and fed chow (13.5% fat) for 6 wk. Values are means ± SE. *P ≤ 0.05 when food intake and body weight gain data at a specific time point (on x-axis) from sham DIO rats were compared with that from control AAV and AAV CTR shRNA-injected DR rats by post hoc Bonferroni test after intergroup differences were found by one-way ANOVA for repeated measures.
Table 5.
Experiment 2: Morphometric and biochemical data for male sham-operated DIO and DR rats injected at 4 wk of age with control AAV shRNA or AAV CTR shRNA in the VMH
| DIO Sham | DR Ctrl AAV | DR AAV CTR shRNA | |
|---|---|---|---|
| Initial body weight, g | 86 ± 4a | 66 ± 2b | 65 ± 2b |
| Final body weight, g | 433 ± 11 | 288 ± 6b | 283 ± 8b |
| Body weight gain, g | 347 ± 9a | 222 ± 6b | 218 ± 8b |
| Food intake, kcal | 4,669 ± 115a | 3,221 ± 81b | 3,264 ± 112b |
| Feed efficiency, BWG (g)/FI (kcal) × 1,000 | 74.3 ± 7.2 | 68.9 ± 6.9 | 66.8 ± 7.1 |
| Perirenal, g | 1.31 ± 0.14a | 0.45 ± 0.08b | 0.43 ± 0.04b |
| Mesenteric, g | 5.86 ± 0.30a | 2.81 ± 0.13b | 2.85 ± 0.16b |
| Inguinal, g | 5.72 ± 0.27a | 2.85 ± 0.16b | 3.08 ± 0.17b |
| Epididymal, g | 5.92 ± 0.32a | 2.62 ± 0.10b | 2.60 ± 0.21b |
| Perirenal, g | 1.31 ± 0.14a | 0.45 ± 0.08b | 0.43 ± 0.04b |
| Retroperitoneal, g | 4.64 ± 0.24a | 1.55 ± 0.13b | 1.87 ± 0.12c |
| Retroperitoneal carcass, % | 1.10 ± 0.11a | 0.52 ± 0.04b | 0.65 ± 0.05c |
| Total fat pad total, g | 25.8 ± 2.2a | 10.1 ± 0.4b | 11.6 ± 0.4c |
| Total fat pad/carcass weight, % | 5.9 ± 0.3a | 3.4 ± 0.1b | 4.0 ± 0.1c |
| Leptin, ng/ml | 16.2 ± 2.2a | 6.1 ± 0.7b | 14.9 ± 2.1a |
| Glucose, mg/dl | 154 ± 8a | 132 ± 5b | 130 ± 6b |
| Insulin, ng/ml | 1.45 ± 0.14a | 0.87 ± 0.11b | 1.12 ± 0.10c |
| Glucose AUC, mg·dl−1·120 min−1 | 3,789 ± 540a | 2,398 ± 425b | 2,934 ± 469b |
| Insulin AUC, mg·dl−1·120 min−1 | 110 ± 10a | 72 ± 5b | 90 ± 6c |
| Insulin sensitivity index | 19.4 ± 1.3a | 33.3 ± 3.5b | 25.5 ± 2.3c |
| CTR mRNA | 0.71 ± 0.08a | 1.40 ± 0.20b | 0.27 ± 0.11c |
Values are means ± SE; n = 12/group.
DIO, diet-induced obese. Rats were maintained on chow diet for 6 wk.
Data for each parameter with differing superscripted letters differ from each other by P = 0.05 by post hoc Bonferroni test after intergroup differences were found by one-way ANOVA. CTR mRNA levels are given as relative abundance normalized against cyclophilin.
As in previous studies (24, 36–39), DIO rats were heavier than both groups of DR rats at 4 wk of age [F(2,33) = 25.5; P = 0.001] and gained 23% more body weight [F(2,33) = 113; P = 0.001], ate 45% more chow [F(2,33) = 60.9, P = 0.001] (Fig. 4), had 18% more total carcass fat as a percentage of body weight [F(2,33) = 39.0; P = 0.001] and 165% higher plasma leptin levels [F(2,33) = 30.3, P = 0.001] than did chow-fed control DR rats (Table 5). However, although the VMH CTR-depleted DR rats were more obese than their DR controls, they had only 68% as much total fat as a percentage of carcass weight, as did DIO rats when assessing five fat pads. On the other hand, plasma leptin levels were comparable between DIO and DR CTR-depleted rats, suggesting that impairing DR VMH amylin signaling might have caused them to become almost as obese as DIO rats when fed only low-fat diet. Finally, while depleting VMH CTR in DR rats made them more insulin resistant than control DR rats, they still had 23% lower basal insulin levels, 18% lower insulin AUC, and 31% higher ISI than did DIO rats (Table 5). Thus, although depleting VMH CTR expression in DR rats made them more obese and insulin resistant than control DR rats, they did not become as obese or insulin resistant as DIO rats when all groups were fed chow.
Effects of depleting DR VMH CTR on leptin signaling.
Depleting DR VMH CTR by 81% resulted in a 57% decrease in ARC and 51% decrease in VMN 125I-labeled leptin binding compared with DR controls, respectively (Fig. 5A). This reduced binding was mirrored by a 59% decrease in the number of leptin-induced pSTAT3-positive neurons in the VMN, but no difference in the ARC compared with control DR rats (Fig. 5B). As our laboratory has shown previously (29), in the present studies, chow-fed DIO rats had 55 and 16% lower leptin receptor binding in the ARC and VMN, respectively, and 27% reduced leptin-induced pSTAT3 only in the VMN compared with control AAV-injected DR rats (Fig. 5B). These data strongly support the hypothesis that significantly impairing endogenous VMH amylin signaling by depleting the CTR component of its receptor complex impairs leptin signaling, increases adiposity, produces insulin resistance, and may be an important factor that predisposes such depleted DR rats to become obese on HFD (experiment 1). However, despite 80% reduction in VMH CTR expression in DR rats, they did not become as obese or insulin resistant as control DIO rats on low-fat chow diets.
Fig. 5.
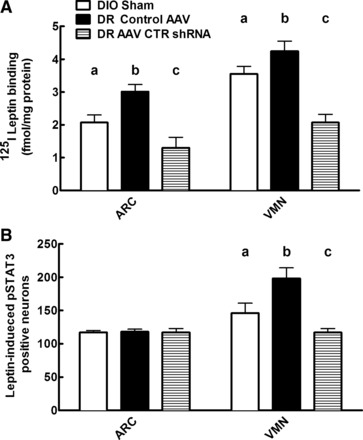
Experiment 2: 125I-labeled leptin binding (A) and leptin-induced phosphorylation of signal transducer and activator of transcription 3 (pSTAT3) immunohistochemistry (B) in the ARC and VMN of DIO sham, DR AAV control, and DR AAV CTR shRNA rats injected at 4 wk of age and fed chow for 6 wk. Values are means ± SE; N = 12/group. a,b,c|Data with differing superscripted letters differ from each other by P ≤ 0.05 by post hoc Bonferroni test after intergroup differences were found by one-way ANOVA.
DISCUSSION
Compared with DR rats, selectively bred DIO rats have reduced ARC and VMN leptin signaling, which is associated with impaired physiological and biochemical responses to leptin before exposure to HFD that make them obese (24, 29, 30, 38, 39). Here we show that DIO rats also have reduced 125I-labeled amylin binding in the DMN and VMNdm, an area that overlaps with their decreased 125I-labeled leptin binding (29) and leptin-induced pSTAT3 expression (13, 38, 58). Amylin enhances Lepr-b expression (35), 125I-labeled leptin binding (80), and leptin-induced STAT3 activation (71) and produces a synergistic effect on lowering food intake and body weight in obese rodents and humans (71). Thus we postulated that reducing endogenous amylin signaling in the VMH by depleting the CTR component of the amylin receptor complex would impair leptin signaling and make obesity-resistant DR rats “leptin resistant” and prone to become obese on HFD. In fact, depleting ARC and VMN CTRA and CTRB by 80–95% in DR rats did impair their leptin signaling (ARC and VMN 125I-labeled leptin binding and VMN leptin-induced pSTAT3). In addition to the marked depletion of VMH CTRA and CTRB, RAMP1 mRNA expression was also decreased in the ARC, which should reduce the affinity of amylin for the CTR/RAMP complex (76). However, we have no direct proof that reductions in CTR and RAMP1 actually reduced amylin binding and signaling since, due to technical problems, we were unable to carry out 125I-labeled amylin receptor binding studies. In addition, both calcitonin gene-related peptide (CGRP) (75) and amylin peptide (41) are expressed in the hypothalamus, and both can serve as ligands for CTR and/or the CTR-RAMP complex (3, 52, 76). Amylin peptide is present in Lepr-b-expressing neurons in many of the same hypothalamic areas where 125I-labeled amylin binds, where its expression varies as a function of sex, obesity, and the presence of leptin (41). Thus, although amylin is expressed in low abundance in the hypothalamus, it, rather than peripheral amylin, might serve as the endogenous ligand that regulates leptin signaling within the VMH. Finally, although injections of the AAVs likely did spread to other areas, such as the DMN, our focus on the ARC and VMN as mediators of the physiological effects on energy and glucose homeostasis seems warranted, since this is where changes in leptin signaling occurred as a result of ARC and VMN CTR depletion.
While chow-fed DIO rats gained more weight and adiposity and were insulin resistant [by OGTT and ISI (46)] compared with chow-fed control DR rats, chow-fed VMH CTR-depleted DR rats also had increased adiposity and insulin resistance compared with DR controls. However, these changes occurred in the absence of increased body weight gain or food intake in VMH CTR-depleted DR rats. Most importantly, neither chow-fed DIO controls nor VMH CTR-depleted DR rats had particularly high levels of carcass adiposity (6 and 4% total fat pad and carcass weight, respectively) compared with that seen after the latter was fed HFD for 6 wk (16%). Unfortunately, we had no HFD-fed DIO rats to compare to those CTR-depleted DR rats fed HFD in experiment 1, so it is not possible to say whether impairing their VMH CTR and leptin signaling would have caused them to become as obese and insulin resistant as DIO rats fed HFD. Nevertheless, it is clear that impairing signaling mediated by VMH CTR does significantly reduce leptin signaling and predispose DR rats to obesity and insulin resistance when fed HFD. Thus the main conclusion from these studies is that endogenous signaling via VMH CTR is required for full leptin signaling and protection from developing obesity and insulin resistance on a HFD. However, the endogenous ligand responsible for this signaling, be it peripheral or hypothalamic amylin or CGRP, remains to be clarified.
VMH CTR-depleted DR rats had increased adiposity without increased intake when fed only chow. When fed HFD for 6 wk, they increased their body weight gain and adiposity in the absence of increased food intake compared with DR controls. These findings suggest that reduced VMH amylin signaling decreased their energy expenditure to account for weight gain without hyperphagia. This is in keeping with previous studies demonstrating that both acute systemic (31, 35, 54, 82) and centrally administered amylin increase energy expenditure, even though this occurs in the presence of decreased food intake (54, 83). Chronic central administration does not affect overall energy expenditure, but does reduce the respiratory quotient (83). Thus, although very large doses of amylin injected directly into the hypothalamus can reduce food intake in rats (16, 17), our data suggest that the primary effect of amylin-leptin interactions in the VMH may be on energy expenditure (either increased thermogenesis and/or activity) rather than food intake. On the other hand, most available evidence points to the AP and underlying NTS as the primary sites of amylin's acute satiating effects (45, 64, 68), as well as the longer term anorectic effects of chronic amylin infusions (44). Besides its direct effects, amylin also interacts in the hindbrain with other gut peptides like cholecystokinin (11, 42, 51), as well as leptin (33, 35, 48), to enhance their satiating effects. However, in addition to the AP/NTS, short-term amylin-induced reductions in feeding can also be elicited by injection of salmon calcitonin (as an amylin surrogate) into the ventral tegmental area (VTA) (where it interacts with leptin) (48) and the nucleus accumbens where amylin reduces food intake in an opiate-dependent fashion (4, 5).
This discrepancy between the acute satiating effects of amylin and its chronic effects on reducing both food intake and body weight in obese rodents and humans (71, 79) raises the possibility of at least two different mechanisms of action for amylin. The acute satiating effects in the AP/NTS appear to be dependent on phosphorylation of ERK1/2 (63). Our present data and several other studies (35, 69, 71, 79, 80) suggest that the chronic effects of amylin administration on reducing body weight in obese rodents and humans (2, 18, 20, 44, 55, 66, 71, 72, 77, 78) are dependent on long-term amylin interactions with leptin signaling at its receptor and downstream signaling cascade in the VMH (69, 71, 79). Our laboratory previously demonstrated that exogenous amylin given over several days, in vivo or in vitro, stimulates VMH microglia to produce IL-6, which interacts with its IL-6 receptor-α/gp130 receptor complex on Lepr-b-expressing neurons to coactivate STAT3 downstream of both receptors (35). This increased pSTAT3 expression and its presumptive stimulation of gene transcription are the likely mechanisms by which amylin increases VMH Lepr-b mRNA expression (35), leptin receptor binding (80), as well as ARC POMC expression (70).
While we did not directly assess amylin's interactions with its VMH receptors, the decrease in IL-6 seen here in the ARC of VMH CTR-depleted DR rats (at least compared with control AAV-injected rats) suggests that amylin signaling might have been reduced in those rats as a proximate cause of their decreased VMH leptin signaling. Our laboratory's previous studies (35) strongly suggest that IL-6 is the critical messenger linking exogenous amylin administration with VMH leptin signaling. For example, amylin fails to reduce food intake or body weight or to enhance VMH leptin-induced pSTAT3 expression in IL-6 knockout mice (35). Thus our present results are compatible with the contention that endogenous amylin signaling via the CTR, together with amylin-induced IL-6 production, are required for full VMH leptin signaling and protection from HFD-induced obesity. However, utilizing the same AAV CTR shRNA as we used here, Mietlicki-Baase et al. (49) showed that knockdown of CTR in the VTA exacerbated both the hyperphagia and the obesity seen in rats fed HFD, suggesting that other brain areas besides the VMH are involved in amylin's long-term effects on energy homeostasis.
Our present studies raise the issue of how endogenous amylin signaling and pharmacological amylin therapy differ and why amylin “resistance” does not seem to develop in obese individuals, despite their elevated plasma amylin levels (14, 15). The present studies, and those in which the CTR portion of the amylin receptor complex was knocked down in the VTA (49), provide evidence that endogenous CTR-mediated signaling, possibly utilizing peripheral amylin transported into the brain or endogenous amylin or CGRP, is an important mediator of ongoing regulation of energy and glucose homeostasis. Although we did not measure plasma amylin levels here, obese rodents are well documented to have elevated levels (14, 15, 62), much as their plasma leptin levels are elevated. Yet such elevations of endogenous amylin and leptin levels are not sufficient to combat the development of hyperphagia and obesity on HFD exposure. On the other hand, even though DIO rats have reduced VMH amylin binding and leptin signaling, even before they become obese (29), they still respond to pharmacological doses of amylin alone, or together with leptin, by increasing VMH leptin signaling and reducing their food intake and body weight gain (35, 71, 80).
Although our laboratory previously showed that exogenous amylin activates VMH microglial IL-6 production, which then acts downstream of the IL-6 receptor complex to increase pSTAT3 expression, this action of exogenous amylin on IL-6 production is limited to the first few days of administration (35). This suggests that a possible “hit and run” string of epigenetic effects are set in motion, which prolong the responses to chronic amylin administration. Nevertheless, at least in the ARC, interfering with endogenous amylin signaling reduced IL-6 expression in our DR rats. Together, these findings suggest that endogenous amylin signaling is required to maintain a tonic level of IL-6 and IL-6-mediated enhancement of leptin signaling in the VMH, but, that the high endogenous amylin levels associated with obesity are insufficient to overcome the leptin resistance seen in obese individuals. Thus a form of amylin resistance at the level of the VMH may occur in obese individuals. This is possibly due to the fact that amylin-induced IL-6 signaling, like leptin signaling, stimulates pSTAT3 (9, 12, 22, 81) and the resultant expression of SOCS3, an endogenous inhibitor of leptin signaling (56, 57) that contributes to leptin resistance in obesity (28, 53). On the other hand, pharmacological doses of amylin may, by further stimulating IL-6 production, act to increase VMH leptin signaling, such that the enhancing effects of amylin on Lepr-b expression and leptin binding outweigh the inhibitory effects of SOCS3. Clearly, amylin or amylin receptor agonists remain effective in decreasing food intake and body weight gain in obese rodents (15, 71) and overweight/obese humans (18, 66), even in the face of persistent hyperamylinemia, with or without obesity (15).
Finally, although selectively bred DIO rats have reduced Lepr-b expression (39), leptin-induced pSTAT3 (13, 38, 58), and/or 125I-labeled leptin binding in the VMH, these parameters do not differ between DIO and DR rats in the VTA (29) or NTS (38). This suggests that DIO rats have selective leptin resistance (65) and that chronic amylin administration might additionally act in concert with leptin on VTA (48) and AP/NTS neurons (55) to enhance reductions in food intake and body weight in obese individuals.
In summary, our results strongly support the hypothesis that endogenous amylin signaling via its CTR/RAMP receptor complex in the VMH is required for full leptin signaling and protection from becoming obese and insulin resistant on HFD. However, from the present studies, we cannot definitively determine whether amylin transported from the periphery into the brain or endogenous hypothalamic amylin or CGRP are the relevant ligands or whether RAMPs are required for such full expression of leptin signaling. Clearly, there are other sites in the brain where amylin acts, sometimes in concert with leptin, to reduce feeding and inhibit weight and adipose gain on such diets. However, the actions in the VMH appear to be mostly involved with energy expenditure and glucose homeostasis, since impairing VMH amylin signaling reduces leptin signaling and produces increased adiposity and insulin resistance, but not hyperphagia, on HFD. Thus the reduced amylin binding in the DMN/VMNdm of DIO rats may contribute to both their impaired leptin signaling and propensity to become obese on HFD.
GRANTS
This work was funded by the Research Service of the Veterans Administration (B. E. Levin, A. A. Dunn-Meynell), National Institute of Diabetes and Digestive and Kidney Diseases (NIDDK) Grant DK-RO1-30066 (B. E. Levin), Swiss National Science Foundation and the Center for Integrative Human Physiology (T. A. Lutz), and NIDDK Grant DK-096139 (M. R. Hayes).
DISCLOSURES
No conflicts of interest, financial or otherwise, are declared by the author(s).
AUTHOR CONTRIBUTIONS
Author contributions: A.A.D.-M. and B.E.L. conception and design of research; A.A.D.-M., C.L.F., and M.D.J. performed experiments; A.A.D.-M., C.L.F., M.D.J., T.A.L., M.R.H., and B.E.L. analyzed data; A.A.D.-M., C.L.F., T.A.L., M.R.H., and B.E.L. interpreted results of experiments; A.A.D.-M. drafted manuscript; A.A.D.-M., C.L.F., M.D.J., T.A.L., M.R.H., and B.E.L. edited and revised manuscript; A.A.D.-M., C.L.F., M.D.J., T.A.L., M.R.H., and B.E.L. approved final version of manuscript; C.L.F. and B.E.L. prepared figures.
ACKNOWLEDGMENTS
The authors thank Antoinette Moralishvili, Sunny Lee, Charlie Salter, Derek Zimmer, and Lauren McGrath for expert technical assistance.
REFERENCES
- 1.Albrandt K, Mull E, Brady EM, Herich J, Moore CX, Beaumont K. Molecular cloning of two receptors from rat brain with high affinity for salmon calcitonin. FEBS Lett 325: 225–232, 1993. [DOI] [PubMed] [Google Scholar]
- 2.Arnelo U, Permert J, Adrian TE, Larsson J, Westermark P, Reidelberger RD. Chronic infusion of islet amyloid polypeptide causes anorexia in rats. Am J Physiol Regul Integr Comp Physiol 271: R1654–R1659, 1996. [DOI] [PubMed] [Google Scholar]
- 3.Bailey RJ, Walker CS, Ferner AH, Loomes KM, Prijic G, Halim A, Whiting L, Phillips AR, Hay DL. Pharmacological characterization of rat amylin receptors: implications for the identification of amylin receptor subtypes. Br J Pharmacol 166: 151–167, 2012. [DOI] [PMC free article] [PubMed] [Google Scholar]
- 4.Baisley SK, Baldo BA. Amylin receptor signaling in the nucleus accumbens negatively modulates mu-opioid-driven feeding. Neuropsychopharmacology 39: 3009–3017, 2014. [DOI] [PMC free article] [PubMed] [Google Scholar]
- 5.Baldo BA, Kelley AE. Amylin infusion into rat nucleus accumbens potently depresses motor activity and ingestive behavior. Am J Physiol Regul Integr Comp Physiol 281: R1232–R1242, 2001. [DOI] [PubMed] [Google Scholar]
- 6.Banks WA, Kastin AJ. Differential permeability of the blood-brain barrier to two pancreatic peptides: insulin and amylin. Peptides 19: 883–889, 1998. [DOI] [PubMed] [Google Scholar]
- 7.Banks WA, Kastin AJ, Maness LM, Huang W, Jaspan JB. Permeability of the blood-brain barrier to amylin. Life Sci 57: 1993–2001, 1995. [DOI] [PubMed] [Google Scholar]
- 8.Baskin DG, Breininger JF, Bonigut S, Miller MA. Leptin binding in the arcuate nucleus is increased during fasting. Brain Res 828: 154–158, 1999. [DOI] [PubMed] [Google Scholar]
- 9.Baumann H, Morella KK, White DW, Dembski M, Bailon PS, Kim H, Lai CF, Tartaglia LA. The full-length leptin receptor has signaling capabilities of interleukin 6-type cytokine receptors. Proc Natl Acad Sci U S A 93: 8374–8378, 1996. [DOI] [PMC free article] [PubMed] [Google Scholar]
- 10.Becskei C, Riediger T, Zund D, Wookey P, Lutz TA. Immunohistochemical mapping of calcitonin receptors in the adult rat brain. Brain Res 1030: 221–233, 2004. [DOI] [PubMed] [Google Scholar]
- 11.Bhavsar S, Watkins J, Young A. Synergy between amylin and cholecystokinin for inhibition of food intake in mice. Physiol Behav 64: 557–561, 1998. [DOI] [PubMed] [Google Scholar]
- 12.Bjorbaek C, Lavery HJ, Bates SH, Olson RK, Davis SM, Flier JS, Myers MG Jr. SOCS3 mediates feedback inhibition of the leptin receptor via Tyr985. J Biol Chem 275: 40649–40657, 2000. [DOI] [PubMed] [Google Scholar]
- 13.Bouret SG, Gorski JN, Patterson CM, Chen S, Levin BE, Simerly RB. Hypothalamic neural projections are permanently disrupted in diet-induced obese rats. Cell Metab 7: 179–185, 2008. [DOI] [PMC free article] [PubMed] [Google Scholar]
- 14.Boyle CN, Lutz TA. Amylinergic control of food intake in lean and obese rodents. Physiol Behav 105: 129–137, 2011. [DOI] [PubMed] [Google Scholar]
- 15.Boyle CN, Rossier MM, Lutz TA. Influence of high-fat feeding, diet-induced obesity, and hyperamylinemia on the sensitivity to acute amylin. Physiol Behav 104: 20–28, 2011. [DOI] [PubMed] [Google Scholar]
- 16.Chance WT, Balasubramaniam A, Chen X, Fischer JE. Tests of adipsia and conditioned taste aversion following the intrahypothalamic injection of amylin. Peptides 13: 961–964, 1992. [DOI] [PubMed] [Google Scholar]
- 17.Chance WT, Balasubramaniam A, Zhang FS, Wimalawansa SJ, Fischer JE. Anorexia following the intrahypothalamic administration of amylin. Brain Res 539: 352–354, 1991. [DOI] [PubMed] [Google Scholar]
- 18.Chapman I, Parker B, Doran S, Feinle-Bisset C, Wishart J, Strobel S, Wang Y, Burns C, Lush C, Weyer C, Horowitz M. Effect of pramlintide on satiety and food intake in obese subjects and subjects with type 2 diabetes. Diabetologia 48: 838–848, 2005. [DOI] [PubMed] [Google Scholar]
- 19.Christopoulos G, Perry KJ, Morfis M, Tilakaratne N, Gao Y, Fraser NJ, Main MJ, Foord SM, Sexton PM. Multiple amylin receptors arise from receptor activity-modifying protein interaction with the calcitonin receptor gene product. Mol Pharmacol 56: 235–242, 1999. [DOI] [PubMed] [Google Scholar]
- 20.Eiden S, Daniel C, Steinbrueck A, Schmidt I, Simon E. Salmon calcitonin–a potent inhibitor of food intake in states of impaired leptin signalling in laboratory rodents. J Physiol 541: 1041–1048, 2002. [DOI] [PMC free article] [PubMed] [Google Scholar]
- 21.Ferguson AV, Bains JS. Electrophysiology of the circumventricular organs. Front Neuroendocrinol 17: 440–475, 1996. [DOI] [PubMed] [Google Scholar]
- 22.Ghilardi N, Ziegler S, Wiestner A, Stoffel R, Heim MH, Skoda RC. Defective STAT signaling by the leptin receptor in diabetic mice. Proc Natl Acad Sci USA 93: 6231–6235, 1996. [DOI] [PMC free article] [PubMed] [Google Scholar]
- 23.Gorski J, Levin BE. Effects of cross fostering on body weight, adiposity and insulin sensitivity in selectively bred obesity-prone and resistant rats (Abstract). Obes Res 12: A103, 2004. [Google Scholar]
- 24.Gorski JN, Dunn-Meynell AA, Levin BE. Maternal obesity increases hypothalamic leptin receptor expression and sensitivity in juvenile obesity-prone rats. Am J Physiol Regul Integr Comp Physiol 292: R1782–R1791, 2007. [DOI] [PubMed] [Google Scholar]
- 25.Hay DL, Christopoulos G, Christopoulos A, Sexton PM. Amylin receptors: molecular composition and pharmacology. Biochem Soc Trans 32: 865–867, 2004. [DOI] [PubMed] [Google Scholar]
- 26.Hilton JM, Chai SY, Sexton PM. In vitro autoradiographic localization of the calcitonin receptor isoforms, C1a and C1b, in rat brain. Neuroscience 69: 1223–1237, 1995. [DOI] [PubMed] [Google Scholar]
- 27.Houssami S, Findlay DM, Brady CL, Myers DE, Martin TJ, Sexton PM. Isoforms of the rat calcitonin receptor: consequences for ligand binding and signal transduction. Endocrinology 135: 183–190, 1994. [DOI] [PubMed] [Google Scholar]
- 28.Howard JK, Cave BJ, Oksanen LJ, Tzameli I, Bjorbaek C, Flier JS. Enhanced leptin sensitivity and attenuation of diet-induced obesity in mice with haploinsufficiency of Socs3. Nat Med 10: 734–738, 2004. [DOI] [PubMed] [Google Scholar]
- 29.Irani BG, Dunn-Meynell AA, Levin BE. Altered hypothalamic leptin, insulin and melanocortin binding associated with moderate fat diet and predisposition to obesity. Endocrinology 148: 310–316, 2007. [DOI] [PubMed] [Google Scholar]
- 30.Irani BG, Le Foll C, Dunn-Meynell AA, Levin BE. Ventromedial nucleus neurons are less sensitive to leptin excitation in rats bred to develop diet-induced obesity. Am J Physiol Regul Integr Comp Physiol 296: R521–R527, 2009. [DOI] [PMC free article] [PubMed] [Google Scholar]
- 31.Isaksson B, Wang F, Permert J, Olsson M, Fruin B, Herrington MK, Enochsson L, Erlanson-Albertsson C, Arnelo U. Chronically administered islet amyloid polypeptide in rats serves as an adiposity inhibitor and regulates energy homeostasis. Pancreatology 5: 29–36, 2005. [DOI] [PubMed] [Google Scholar]
- 32.Kahn SE, D'Alessio DA, Schwartz MW, Fujimoto WY, Ensinck JW, Taborsky GJ Jr, Porte D Jr. Evidence of cosecretion of islet amyloid polypeptide and insulin by beta-cells. Diabetes 39: 634–638, 1990. [DOI] [PubMed] [Google Scholar]
- 33.Kusakabe T, Ebihara K, Sakai T, Miyamoto L, Aotani D, Yamamoto Y, Yamamoto-Kataoka S, Aizawa-Abe M, Fujikura J, Hosoda K, Nakao K. Amylin improves the effect of leptin on insulin sensitivity in leptin-resistant diet-induced obese mice. Am J Physiol Endocrinol Metab 302: E924–E931, 2012. [DOI] [PubMed] [Google Scholar]
- 34.Le Foll C, Dunn-Meynell A, Musatov S, Magnan C, Levin BE. FAT/CD36: a major regulator of neuronal fatty acid sensing and energy homeostasis in rats and mice. Diabetes 62: 2709–2716, 2013. [DOI] [PMC free article] [PubMed] [Google Scholar]
- 35.Le Foll C, Johnson MD, Dunn-Meynell AA, Boyle CA, Lutz TA, Levin BE. Amylin-induced IL-6 production enhances ventromedial hypothalamic leptin signaling. Diabetes 64: 1621–1631, 2015. [DOI] [PMC free article] [PubMed] [Google Scholar]
- 36.Levin BE, Dunn-Meynell AA. Reduced central leptin sensitivity in rats with diet-induced obesity. Am J Physiol Regul Integr Comp Physiol 283: R941–R948, 2002. [DOI] [PubMed] [Google Scholar]
- 37.Levin BE, Dunn-Meynell AA, Balkan B, Keesey RE. Selective breeding for diet-induced obesity and resistance in Sprague-Dawley rats. Am J Physiol Regul Integr Comp Physiol 273: R725–R730, 1997. [DOI] [PubMed] [Google Scholar]
- 38.Levin BE, Dunn-Meynell AA, Banks WA. Obesity-prone rats have normal blood-brain barrier transport but defective central leptin signaling prior to obesity onset. Am J Physiol Regul Integr Comp Physiol 286: R143–R150, 2004. [DOI] [PubMed] [Google Scholar]
- 39.Levin BE, Dunn-Meynell AA, Ricci MR, Cummings DE. Abnormalities of leptin and ghrelin regulation in obesity-prone juvenile rats. Am J Physiol Endocrinol Metab 285: E949–E957, 2003. [DOI] [PubMed] [Google Scholar]
- 40.Levin BE, Keesey RE. Defense of differing body weight set-points in diet-induced obese and resistant rats. Am J Physiol Regul Integr Comp Physiol 274: R412–R419, 1998. [DOI] [PubMed] [Google Scholar]
- 41.Li Z, Kelly L, Heiman M, Greengard P, Friedman JM. Hypothalamic amylin acts in concert with leptin to regulate food intake. Cell Metab 22: 1–9, 2015. [DOI] [PubMed] [Google Scholar]
- 42.Lutz TA, Del Prete E, Szabady MM, Scharrer E. Attenuation of the anorectic effects of glucagon, cholecystokinin, and bombesin by the amylin receptor antagonist CGRP(8–37). Peptides 17: 119–124, 1996. [DOI] [PubMed] [Google Scholar]
- 43.Lutz TA, Geary N, Szabady MM, Del Prete E, Scharrer E. Amylin decreases meal size in rats. Physiol Behav 58: 1197–1202, 1995. [DOI] [PubMed] [Google Scholar]
- 44.Lutz TA, Mollet A, Rushing PA, Riediger T, Scharrer E. The anorectic effect of a chronic peripheral infusion of amylin is abolished in area postrema/nucleus of the solitary tract (AP/NTS) lesioned rats. Int J Obes Relat Metab Disord 25: 1005–1011, 2001. [DOI] [PubMed] [Google Scholar]
- 45.Lutz TA, Senn M, Althaus J, Del Prete E, Ehrensperger F, Scharrer E. Lesion of the area postrema/nucleus of the solitary tract (AP/NTS) attenuates the anorectic effects of amylin and calcitonin gene-related peptide (CGRP) in rats. Peptides 19: 309–317, 1998. [DOI] [PubMed] [Google Scholar]
- 46.Matsuda M, DeFronzo R. Insulin sensitivity indices obtained from oral glucose tolerance testing: comparison with the euglycemic insulin clamp. Diabetes Care 22: 1462–1470, 1999. [DOI] [PubMed] [Google Scholar]
- 47.Mietlicki-Baase EG, Hayes MR. Amylin activates distributed CNS nuclei to control energy balance. Physiol Behav 136: 39–46, 2014. [DOI] [PMC free article] [PubMed] [Google Scholar]
- 48.Mietlicki-Baase EG, Olivos DR, Jeffrey BA, Hayes MR. Cooperative interaction between leptin and amylin signaling in the ventral tegmental area for the control of food intake. Am J Physiol Endocrinol Metab 308: E1116–E1122, 2015. [DOI] [PMC free article] [PubMed] [Google Scholar]
- 49.Mietlicki-Baase EG, Reiner DJ, Cone JJ, Olivos DR, McGrath LE, Zimmer DJ, Roitman MF, Hayes MR. Amylin modulates the mesolimbic dopamine system to control energy balance. Neuropsychopharmacology 40: 372–385, 2015. [DOI] [PMC free article] [PubMed] [Google Scholar]
- 50.Mollet A, Gilg S, Riediger T, Lutz TA. Infusion of the amylin antagonist AC 187 into the area postrema increases food intake in rats. Physiol Behav 81: 149–155, 2004. [DOI] [PubMed] [Google Scholar]
- 51.Mollet A, Meier S, Grabler V, Gilg S, Scharrer E, Lutz TA. Endogenous amylin contributes to the anorectic effects of cholecystokinin and bombesin. Peptides 24: 91–98, 2003. [DOI] [PubMed] [Google Scholar]
- 52.Morfis M, Tilakaratne N, Furness SG, Christopoulos G, Werry TD, Christopoulos A, Sexton PM. Receptor activity-modifying proteins differentially modulate the G protein-coupling efficiency of amylin receptors. Endocrinology 149: 5423–5431, 2008. [DOI] [PubMed] [Google Scholar]
- 53.Mori H, Hanada R, Hanada T, Aki D, Mashima R, Nishinakamura H, Torisu T, Chien KR, Yasukawa H, Yoshimura A. Socs3 deficiency in the brain elevates leptin sensitivity and confers resistance to diet-induced obesity. Nat Med 10: 739–743, 2004. [DOI] [PubMed] [Google Scholar]
- 54.Osaka T, Tsukamoto A, Koyama Y, Inoue S. Central and peripheral administration of amylin induces energy expenditure in anesthetized rats. Peptides 29: 1028–1035, 2008. [DOI] [PubMed] [Google Scholar]
- 55.Osto M, Wielinga PY, Alder B, Walser N, Lutz TA. Modulation of the satiating effect of amylin by central ghrelin, leptin and insulin. Physiol Behav 91: 566–572, 2007. [DOI] [PubMed] [Google Scholar]
- 56.Park KW, Lin CY, Li K, Lee YS. Effects of reducing suppressors of cytokine signaling-3 (SOCS3) expression on dendritic outgrowth and demyelination after spinal cord injury. PloS One 10: e0138301, 2015. [DOI] [PMC free article] [PubMed] [Google Scholar]
- 57.Park KW, Nozell SE, Benveniste EN. Protective role of STAT3 in NMDA and glutamate-induced neuronal death: negative regulatory effect of SOCS3. PloS One 7: e50874, 2012. [DOI] [PMC free article] [PubMed] [Google Scholar]
- 58.Patterson CM, Bouret SG, Dunn-Meynell AA, Levin BE. Three weeks of postweaning exercise in DIO rats produces prolonged increases in central leptin sensitivity and signaling. Am J Physiol Regul Integr Comp Physiol 296: R537–R548, 2009. [DOI] [PMC free article] [PubMed] [Google Scholar]
- 59.Patterson CM, Dunn-Meynell AA, Levin BE. Three weeks of early-onset exercise prolongs obesity resistance in DIO rats after exercise cessation. Am J Physiol Regul Integr Comp Physiol 294: R290–R301, 2008. [DOI] [PubMed] [Google Scholar]
- 60.Paxinos G, Chai SY, Christopoulos G, Huang XF, Toga AW, Wang HQ, Sexton PM. In vitro autoradiographic localization of calcitonin and amylin binding sites in monkey brain. J Chem Neuroanat 27: 217–236, 2004. [DOI] [PubMed] [Google Scholar]
- 61.Paxinos G, Watson C. The Rat Brain in Stereotaxic Coordinates. New York: Academic, 1986. [DOI] [PubMed] [Google Scholar]
- 62.Pieber TR, Roitelman J, Lee Y, Luskey KL, Stein DT. Direct plasma radioimmunoassay for rat amylin-(1–37): concentrations with acquired and genetic obesity. Am J Physiol Endocrinol Metab 267: E156–E164, 1994. [DOI] [PubMed] [Google Scholar]
- 63.Potes CS, Boyle CN, Wookey PJ, Riediger T, Lutz TA. Involvement of the extracellular signal-regulated kinase 1/2 signaling pathway in amylin's eating inhibitory effect. Am J Physiol Regul Integr Comp Physiol 302: R340–R351, 2012. [DOI] [PubMed] [Google Scholar]
- 64.Potes CS, Lutz TA. Brainstem mechanisms of amylin-induced anorexia. Physiol Behav 100: 511–518, 2010. [DOI] [PubMed] [Google Scholar]
- 65.Rahmouni K, Haynes WG, Mark AL. Cardiovascular and sympathetic effects of leptin. Curr Hypertens Rep 4: 119–125, 2002. [DOI] [PubMed] [Google Scholar]
- 66.Ravussin E, Smith SR, Mitchell JA, Shringarpure R, Shan K, Maier H, Koda JE, Weyer C. Enhanced weight loss with pramlintide/metreleptin: an integrated neurohormonal approach to obesity pharmacotherapy. Obesity (Silver Spring) 17: 1736–1743, 2009. [DOI] [PMC free article] [PubMed] [Google Scholar]
- 67.Reidelberger RD, Kelsey L, Heimann D. Effects of amylin-related peptides on food intake, meal patterns, and gastric emptying in rats. Am J Physiol Regul Integr Comp Physiol 282: R1395–R1404, 2002. [DOI] [PubMed] [Google Scholar]
- 68.Riediger T, Zuend D, Becskei C, Lutz TA. The anorectic hormone amylin contributes to feeding-related changes of neuronal activity in key structures of the gut-brain axis. Am J Physiol Regul Integr Comp Physiol 286: R114–R122, 2004. [DOI] [PubMed] [Google Scholar]
- 69.Roth JD, Hughes H, Coffey T, Maier H, Trevaskis JL, Anderson CM. Effects of prior or concurrent food restriction on amylin-induced changes in body weight and body composition in high-fat-fed female rats. Am J Physiol Endocrinol Metab 293: E1112–E1117, 2007. [DOI] [PubMed] [Google Scholar]
- 70.Roth JD, Hughes H, Kendall E, Baron AD, Anderson CM. Antiobesity effects of the beta-cell hormone amylin in diet-induced obese rats: effects on food intake, body weight, composition, energy expenditure, and gene expression. Endocrinology 147: 5855–5864, 2006. [DOI] [PubMed] [Google Scholar]
- 71.Roth JD, Roland BL, Cole RL, Trevaskis JL, Weyer C, Koda JE, Anderson CM, Parkes DG, Baron AD. Leptin responsiveness restored by amylin agonism in diet-induced obesity: evidence from nonclinical and clinical studies. Proc Natl Acad Sci USA 105: 7257–7262, 2008. [DOI] [PMC free article] [PubMed] [Google Scholar]
- 72.Rushing PA, Hagan MM, Seeley RJ, Lutz TA, Woods SC. Amylin: a novel action in the brain to reduce body weight. Endocrinology 141: 850–853, 2000. [DOI] [PubMed] [Google Scholar]
- 73.Rushing PA, Seeley RJ, Air EL, Lutz TA, Woods SC. Acute 3rd-ventricular amylin infusion potently reduces food intake but does not produce aversive consequences. Peptides 23: 985–988, 2002. [DOI] [PubMed] [Google Scholar]
- 74.Sexton PM, Paxinos G, Kenney MA, Wookey PJ, Beaumont K. In vitro autoradiographic localization of amylin binding sites in rat brain. Neuroscience 62: 553–567, 1994. [DOI] [PubMed] [Google Scholar]
- 75.Skofitsch G, Jacobowitz DM. Calcitonin gene-related peptide: detailed immunohistochemical distribution in the central nervous system. Peptides 6: 721–745, 1985. [DOI] [PubMed] [Google Scholar]
- 76.Tilakaratne N, Christopoulos G, Zumpe ET, Foord SM, Sexton PM. Amylin receptor phenotypes derived from human calcitonin receptor/RAMP coexpression exhibit pharmacological differences dependent on receptor isoform and host cell environment. J Pharmacol Exp Ther 294: 61–72, 2000. [PubMed] [Google Scholar]
- 77.Trevaskis JL, Coffey T, Cole R, Lei C, Wittmer C, Walsh B, Weyer C, Koda J, Baron AD, Parkes DG, Roth JD. Amylin-mediated restoration of leptin responsiveness in diet-induced obesity: magnitude and mechanisms. Endocrinology 149: 5679–5687, 2008. [DOI] [PubMed] [Google Scholar]
- 78.Trevaskis JL, Lei C, Koda JE, Weyer C, Parkes DG, Roth JD. Interaction of leptin and amylin in the long-term maintenance of weight loss in diet-induced obese rats. Obesity (Silver Spring) 18: 21–26, 2010. [DOI] [PubMed] [Google Scholar]
- 79.Trevaskis JL, Lei C, Koda JE, Weyer C, Parkes DG, Roth JD. Interaction of leptin and amylin in the long-term maintenance of weight loss in diet-induced obese rats. Obesity (Silver Spring) 18: 21–26, 2010. [DOI] [PubMed] [Google Scholar]
- 80.Turek VF, Trevaskis JL, Levin BE, Dunn-Meynell AA, Irani B, Gu G, Wittmer C, Griffin PS, Vu C, Parkes DG, Roth JD. Mechanisms of amylin/leptin synergy in rodent models. Endocrinology 151: 143–152, 2010. [DOI] [PubMed] [Google Scholar]
- 81.Vaisse C, Halaas JL, Horvath CM, Darnell JE Jr, Stoffel M, Friedman JM. Leptin activation of Stat3 in the hypothalamus of wild-type and ob/ob mice but not db/db mice. Nat Genet 14: 95–97, 1996. [DOI] [PubMed] [Google Scholar]
- 82.Wielinga PY, Alder B, Lutz TA. The acute effect of amylin and salmon calcitonin on energy expenditure. Physiol Behav 91: 212–217, 2007. [DOI] [PubMed] [Google Scholar]
- 83.Wielinga PY, Lowenstein C, Muff S, Munz M, Woods SC, Lutz TA. Central amylin acts as an adiposity signal to control body weight and energy expenditure. Physiol Behav 101: 45–52, 2010. [DOI] [PMC free article] [PubMed] [Google Scholar]