Abstract
Nearly all patients with tuberous sclerosis complex (TSC) develop renal angiomyolipomas, although the tumor cell of origin is unknown. We observed decreased renal angiomyolipoma development in patients with TSC2- polycystic kidney disease 1 deletion syndrome and hypertension that were treated from an early age with angiotensin-converting enzyme inhibitors or angiotensin receptor blockers compared with patients who did not receive this therapy. TSC-associated renal angiomyolipomas expressed ANG II type 1 receptors, platelet-derived growth factor receptor-β, desmin, α-smooth muscle actin, and VEGF receptor 2 but did not express the adipocyte marker S100 or the endothelial marker CD31. Sera of TSC patients exhibited increased vascular mural cell-secreted peptides, such as VEGF-A, VEGF-D, soluble VEGF receptor 2, and collagen type IV. These findings suggest that angiomyolipomas may arise from renal pericytes. ANG II treatment of angiomyolipoma cells in vitro resulted in an exaggerated intracellular Ca2+ response and increased proliferation, which were blocked by the ANG II type 2 receptor antagonist valsartan. Blockade of ANG II signaling may have preventative therapeutic potential for angiomyolipomas.
Keywords: tuberous sclerosis complex, angiomyolipoma, angiotensin II type 1 receptor, pericyte, perivascular epithelioid cell tumor, mammalian target of rapamycin
patients with tuberous sclerosis complex (TSC) progressively develop renal tumors, called angiomyolipomas, which develop aneurysms that can rupture, leading to life-threatening hemorrhage and even death. Surgical and interventional radiology procedures have been used to control bleeding and tumor burden (7). Angiomyolipomas are a type of perivascular epithelioid cell tumor, and although this tumor's origin has been suggested, the exact identity of the cell of origin is unclear (5, 12, 28, 50). Clonality of angiomyolipomas has been demonstrated, which is intriguing given the different cellular components that comprise the lesions (22). The typical TSC-associated angiomyolipoma contains fat, blood vessels, spindle (or smooth muscle-like) cells, and epithelioid cells (18). These highly vascular tumors contain several morphologically distinct vessel types, and most types exhibit TSC1 or TSC2 loss of heterozygosity and increased immunoreactivity to phospho-S6 antibodies, indicating dysregulated mammalian target of rapamycin (mTOR) activity (30). Spindle, adipocyte-like, and epithelioid cells can all express α-smooth muscle actin (α-SMA) as well as melanocyte markers such as glycoprotein 100 [human melanoma black (HMB)-45], a splice variant of premelanosome protein 17, and even MelanA/melanoma antigen recognized by T cells (MART)-1. Expression of these melanocyte-associated genes is downstream of microphthalmia-associated transcription factor (MITF) family activity, whose production is upregulated with increased mTOR activity (35, 37). Based on the aberrant mTOR signaling of TSC-associated angiomyolipomas, recent clinical trials (9, 10) have supported the use of mTOR inhibitors as the first pharmacological treatment to reduce the tumor burden for TSC patients. However, this therapy is likely cytostatic as tumors often return to pretreatment size when therapy is discontinued. Although yet unexplored, TSC-associated renal angiomyolipomas are ideal candidates for preventative therapies because TSC is most often diagnosed in early childhood, and angiomyolipomas are later identified and grow over the patient's lifetime, becoming symptomatic most often in adulthood (7, 18).
Angiomyolipoma cells do not stain for endothelial markers such as CD31, although blood vessel tunica intima does (2). We focused on the possibility that angiomyolipoma cells were myofibroblasts or pericytes (2). Pericytes are mesenchymal perivascular cells attached to the abluminal surface of capillaries. They share lineage with fibroblasts, and there may be plasticity between pericytes and interstitial fibroblasts, but, unlike fibroblasts, pericytes have specific functions in regulating microvascular stability, development, and function (1, 54). A pericyte origin was especially interesting because angiomyolipoma cells, like pericytes, histochemically express α-SMA and pericytes also can accumulate lipid, as is seen in angiomyolipomas (17).
Renal manifestations of tuberous sclerosis include angiomyolipomas as well as renal cystic disease. Approximately 2% of TSC patients have a severe, very early onset polycystic kidney phenotype that is usually associated with deletions affecting the adjacent TSC2 and polycystic kidney disease 1 (PKD1) genes on chromosome 16p13 (45). Such polycystic kidney disease is commonly associated with hypertension. Given the perivascular nature of angiomyolipomas, we posited that if they were of vascular cell origin, then interference in vascular signaling by the use of angiotensin-converting enzyme (ACE) inhibitors or angiotensin receptor blockers (ARBs) would impact tumor growth.
In the present study, we provide clinical and laboratory evidence of a pericyte cell of origin for angiomyolipomas, evidence supporting a role of ANG II, a traditionally vascular signaling pathway, in angiomyolipoma pathogenesis, and the rationale for novel therapeutic intervention for angiomyolipomas in patients with TSC by targeting the renin-angiotensin system (RAS).
METHODS
Chemicals and reagents.
All chemicals and reagents were obtained from Sigma-Aldrich (St. Louis, MO) unless otherwise indicated. RAD-001 was obtained from Novartis (Basel, Switzerland) per the material transfer agreement (WSJ-386.12.06-12.12).
Analysis of angiomyolipoma in patients with the polycystic kidney variety of TSC.
After obtaining Institutional Review Board (Cincinnati Children's Hospital Medical Center) or Ethics Committee (Cardiff University School of Medicine) approval, reports from scans obtained for clinical reasons were assessed for the presence or absence of angiomyolipomas, and charts were reviewed to ascertain whether the patients were or were not on ACE inhibitors or ARBs. Patients younger than 10 yr of age were excluded from analysis. In the case of patients who received ACE inhibitors or ARB therapy after the initial detection of angiomyolipomas, the treatment was considered no factor. Statistical significance was determined by Fisher's exact test.
Real-time quantitative RT-PCR.
Immortalized TSC2-deficient human renal angiomyolipoma cells (TRI102 cells) and the same cell line in which TSC2 is reexpressed (TRI103 cells) were used. TRI102 and TRI103 cells were grown to 80–90% confluence. Total RNA was isolated using an RNeasy mini kit (Qiagen, Valencia, CA). Total RNA (2 μg) was used for cDNA synthesis using the RT2 first-strand kit (Qiagen) and reverse transcribed using RT2 SYBR Green MasterMix (Qiagen) following the manufacturer's instructions. Gene expression was quantified by RT-PCR using Mastercycler ep realplex and was performed using the following primers for the ANG II type 1 receptor (AT1R) gene (AGTR1): forward 5′-AAGTTTTCGTGCCGGTTTTCAGC-3′ and reverse 5′-ACGGGCATTGTTTTGGCAGTGTA-3′. GAPDH (IDT) was used as a reference gene.
Serum biomarker analysis.
After informed consent was obtained using an Institutional Review Board-approved consent form, blood was drawn from patients and serum was isolated. Samples were run as a batch sample using standard ELISA technology. All patient plasma samples were stored at −80°C before batched analysis. Samples were thawed at room temperature and analyzed according to the manufacturer's recommendations. In brief, the multiplexed Human Growth Factor Panel I containing basic FGF, placental growth factor, VEGF-A, and soluble (s)VEGF receptor (VEGFR)1 and the multiplexed Human Growth Factor Panel II containing sVEGFR2 and cKit were used (Mesoscale Discovery). A volume of 25 μl of neat sample was used for Human Growth Factor Panel I, whereas 25 μl of 1:20 dilution of the sample was used for Human Growth Factor Panel II. A Quantikine ELISA kit (R&D Systems) was used to measure VEGF-D levels in 50 μl of neat plasma, whereas collagen type IV was measured using an ELISA kit (Kamiya Biomedical) using the same volume of sample. All samples were analyzed in duplicate wells, and assay plates were read either in a Sector 2400 instrument (Mesoscale Discovery) or Spectramax-M2 (Molecular Devices) as recommended by the manufacturer. Analyte concentrations were calculated using either four- or five-parameter standard curves, and means of the concentrations from duplicate wells were reported.
Electron microscopy.
Tissues were fixed in 3% buffered glutaraldehyde, postfixed in 1% osmium tetroxide, dehydrated in graded alcohols, and embedded in LX-112 resin. Sections were cut with diamond knives on an ultramicrotome, stained with uranyl acetate and lead citrate, and examined in a Hitachi H-7600 electron microscope.
Light microscopy and immunohistochemistry.
Representative sections from cases of human renal angiomyolipoma and controls including a normal kidney, nonalcoholic fatty liver disease liver, and translocation renal cell carcinoma were prepared from 10% formalin-fixed, paraffin-embedded tissue and stained with hematoxylin and eosin. Immunohistochemical stains were carried out on formalin-fixed, paraffin-embedded tissue using the avidin-biotin technique with diaminobenzidine as the chromogen on an automatic immunostainer (Benchmark XT, Ventana Medical Systems, Tucson, AZ). The following monoclonal antibodies were used: S100 (Ventana Medical Systems), PDGF receptor (PDGFR)-β (Santa Cruz Biotechnology, Santa Cruz, CA), VEGFR2 (GenScript, Piscataway, NJ), AT1R (Abcam, Cambridge, MA), and glycoprotein nonmetastatic B (GPNMB; Abcam). In every case, formalin-fixed tissue was subjected to heat-induced antigen retrieval.
Crystal violet cell quantitation.
TRI102 and TRI103 cell quantitation was performed as previously described (49). Briefly, cells were plated at 5 × 10³ cells/well in 96-well plates and allowed to adhere for 24 h before treatment. After treatments, cells were washed with PBS, formaldehyde fixed, washed with deionized water, and incubated in 0.1% crystal violet and H2O for 30 min. Excess crystal violet was washed out with deionized water. DNA-bound crystal violet was dissolved by adding 10% acetic acid with mild agitation. Absorbance at 540 nm was detected using a Biotek Synergy H4 microplate reader (Biotek, Winooski, VT).
Fura-2 measurements of intracellular Ca2+.
TRI102 and TRI103 cells were seeded at 1 × 10⁴ cells/well on black opaque 96-well plates (Perkin-Elmer, Waltham, MA) and cultured to near confluence after 72 h of growth. Cells were washed with Ringer solution [containing (in mM) 140 NaCl, 2.4 K2HPO4, 10 d-glucose, 10 HEPES, 1.5 CaCl2, and 1 MgSO4], and incubated in 5 μM fura-2 AM (Teflabs, Austin, TX) in Ringer solution at 37°C for 30 min. Fura-2 solution was aspirated, and cells were bathed in Ringer solution with or without 1 μM valsartan (Tocris Bioscience, Ellisville, MO). Fura-2 fluorescence was measured kinetically at excitation/emission wavelengths of 340/510 and 380/510 nm using a Biotek Synergy H4 microplate reader. Indicated treatments were administered by an automated injection manifold (Biotek).
In vitro VEGF assays.
TRI102 and TRI103 cells were seeded at 3 × 10⁵ cells/well in six-well tissue culture plates. After 56 h, serum was removed from the culture media. At 72 h, the indicated treatments were administered in serum-free culture media. After 24 h of treatment, conditioned media were collected, and VEGF-A levels were determined by ELISA according to the manufacturer's specifications (R&D Systems).
Protein isolation/Western blot analysis.
TRI102 and TRI103 cells were seeded at 3 × 10⁵ cells/well in six-well tissue culture plates. After 56 h, serum was removed from the culture media. At 72 h, the indicated treatments were administered in serum-free culture media. Cells were washed with ice-cold PBS and bathed in ice-cold RIPA buffer [containing 50 mM Tris·HCl (pH 8), 150 mM NaCl, 1% Nonidet P-40, 0.5% sodium deoxycholate, and 0.1% SDS] with protease and phosphatase inhibitors to obtain total cell lysates. A BCA protein assay (Pierce) was performed to determine the protein concentration. Normalized protein amounts were loaded on polyacrylamide gels, separated by SDS-PAGE, and transferred to polyvinylidene difluoride membranes. Membranes were incubated in primary antibodies overnight at 4°C. The following antibodies and dilutions were used: Akt, phosphorylated Akt (Ser473), and phosphorylated Akt (Thr308), 1:1,000 (Cell Signaling, Boston, MA); GAPDH, 1:300,000; α-SMA, 1:1,000 (Novus Biologicals, Littleton, CO); and H-caldesmon, 1:200 (Santa Cruz Biotechnology). Membranes were incubated in horseradish peroxidase-conjugated secondary antibodies (1:3,000, GE Healthcare Biosciences, Pittsburgh, PA) at room temperature for 1 h. ECL Plus (GE Healthcare Biosciences) was used for chemiluminescence detection.
Lipid droplet fluorescence imaging.
TRI102 and TRI103 cells were seeded at 7.5 × 10⁴ cells/well on glass coverslips in 24-well tissue culture plates and allowed to attach for 24–48 h and reach ∼70% confluence. The indicated treatments were administered for 4 or 24 h in culture media supplemented with 0, 50, 100, or 400 μM Na-oleate. After treatment, cells were washed twice with PBS and fixed with 4% paraformaldehyde and PBS for 10 min. Fixed cells were washed twice with PBS and then incubated with LipidTOX red neutral lipid stain according to the manufacturer's specifications (Molecular Probes, Eugene, OR). Coverslips were mounted on glass slides using ProLong Gold antifade mounting agent containing 4',6-diamidino-2-phenylindole (Molecular Probes). Images were obtained using a Zeiss Axiovert 400 microscope with a ×40 Plan NeoFluar lens and an AxioCam MRm black and white camera (Carl Zeiss Microscopy, Munich, Germany), and image analysis and pseudocoloring were performed with ImageJ software (National Institutes of Health, Bethesda, MD).
Statistical analysis.
Statistical analysis was performed using Prism 6.0c software (GraphPad Software, La Jolla, CA).
RESULTS
Anti-RAS therapy correlates with a reduced angiomyolipoma burden in patients with TSC.
Imaging from 58 patients with the polycystic kidney variety of TSC was reviewed for the presence of angiomyolipomas, and a retrospective chart review was performed to determine whether patients received antihypertensive therapy with ACE inhibitors or ARBs. This group was selected for analysis because having the polycystic phenotype would put these patients at risk for hypertension so that many receive antihypertensive therapy even from a very early age. None of the patients had received rapamycin. Four of 33 (12%) patients treated with ACE inhibitors or ARBs had angiomyolipomas, whereas 11 of 25 (44%) untreated patients had these lesions (Fig. 1).
Fig. 1.
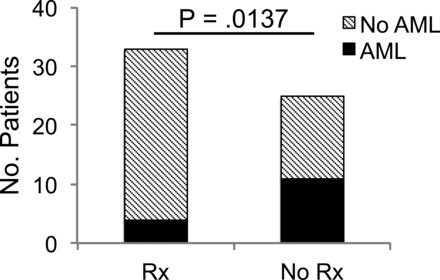
Antihypertensive therapy correlates with reduced angiomyolipoma burden in patients with tuberous sclerosis complex (TSC). The presence of renal angiomyolipomas was examined from renal imaging in a subset of TSC patients with the TSC2-polycystic kidney disease 1 contiguous gene syndrome and cross-referenced with treatment with either angiontensin-converting enzyme (ACE) inhibitors or angiotensin receptor blockers (ARBs). Rx, ACE inhibitor or ARB therapy; AML, angiomyolipoma. Statistical significance was determined by Fisher's exact test.
AT1Rs are overexpressed in angiomyolipoma tissue and cells.
In order for ANG II to exert tumorigenic effects, the AT1R likely would be present on tumor cells. In renal angiomyolipoma tissue from patients with TSC, we observed robust AT1R expression in spindle, epithelioid, and adipocyte-like cells, which was absent in adjacent mature fat and far more intense compared with the vascular smooth muscle of tumor arterioles (Fig. 2). Tissue from patients with TSC2-PKD1 contiguous gene mutations was not available for immunohistochemical analysis because diagnosis is made by imaging and there is no role for biopsy. Immunohistochemical examination has been effectively used to identify AT1R expression, but some studies have reported uncertainty with this methodology. We sought to verify the present findings using an in vitro angiomyolipoma cell model. In TRI102 and TRI103 cells (49), we examined AT1R mRNA (AGT1R) expression by real-time quantitative RT-PCR. We observed nearly threefold greater AT1R mRNA in the absence of TSC2 expression (Fig. 3). Treatment with the mTOR complex 1 (mTORC1) inhibitor RAD-001 (Everolimus, Novartis Pharmaceuticals) reduced AT1R levels in TRI102 cells, whereas levels in TRI103 cells were nearly unaffected (Fig. 3).
Fig. 2.
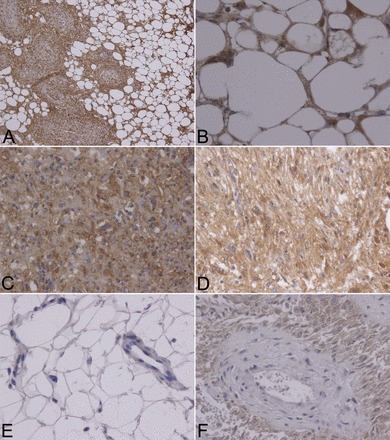
ANG II type 1 receptor (AT1R) expression by immunohistochemistry in TSC patient renal angiomyolipomas. A: spindle and adipocyte-like cells of renal angiomyolipoma tissue from a patient with TSC displaying strong AT1R positivity (×200 magnification). B: AT1R-positive adipocyte-like cells (×600 magnification). C: AT1R-positive epithelioid cells (×400 magnification). D: AT1R-positive spindle cells (×400 magnification). E: mature fat, a capillary, and a vein from adjacent renal tissue were negative for AT1Rs (×400 magnification). F: spindle cells surrounding a vessel displayed comparatively stronger AT1R-positive signals (×400 magnification). Four separate TSC-associated angiomyolipomas were analyzed.
Fig. 3.
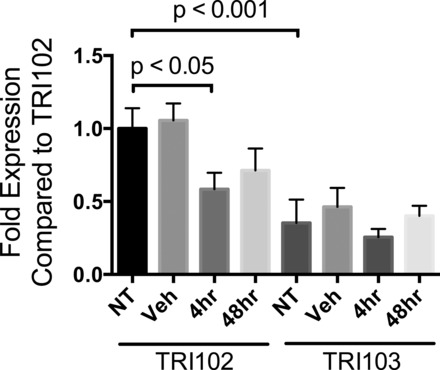
Quantitative RT-PCR of AT1R mRNA (AGTR1 gene) from human renal angiomyolipoma cells. TSC2-deficient human renal angiomyolipoma (TRI102) and TSC2-rescued (TRI103) cells were treated with RAD-001 (20 nM) for 4 and 48 h or equivalent DMSO. AT1R mRNA levels are expressed as fold changes relative to TRI102 cells. GAPDH was used as the reference gene. All data are the average of 4 separate experiments (each performed in duplicate or triplicate). NT, no treatment; Veh, vehicle.
Angiomyolipoma cells display AT1R-mediated signaling in vitro.
Given the clinical findings and AT1R expression, we postulated that ANG II might activate AT1R-mediated signaling in angiomyolipoma cells, resulting in inositol 1,4,5-trisphosphate-mediated intracellular Ca2+ elevation, cellular proliferation, and secretion of VEGF-A (41). We found that ANG II produced an increase in intracellular Ca2+ that was greater in TSC2-deficient TRI102 cells compared with TSC2-rescued TRI103 cells and attenuated by the AT1R antagonist valsartan exclusively in TRI102 cells (Fig. 4, A and B). TRI102 cells also released VEGF-A in response to ANG II treatment, whereas TRI103 cells did not (Fig. 4D). We also observed reduced VEGF-A release in TRI102 cells treated with RAD-001, a finding that is consistent with another report (14) using other TSC cell models. These data support a model in which VEGF-A production is driven by increased mTORC1 activity in TSC-null cells and secretion is induced by ANG II stimulation of AT1Rs. In addition, we found a significant increase in cell proliferation with ANG II treatment exclusively in TRI102 cells, which was also blocked by valsartan, suggesting that proliferation of angiomyolipoma cells was an AT1R-mediated phenomenon (Fig. 4E). These in vitro experiments support a role for AT1R-mediated signaling in renal angiomyolipoma that may contribute to tumorigenesis. This AT1R-mediated effect may also help explain spindle cell proliferation in lymphangioleiomyomatosis (LAM).
Fig. 4.
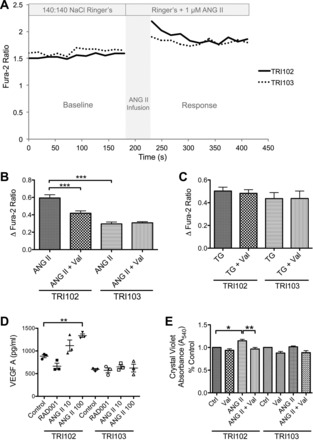
Intracellular Ca2+ measurements, VEGF-A release, and proliferation in response to ANG II in angiomyolipoma cells. A: representative tracings of intracellular Ca2+ concentration ([Ca2+]i) responses to ANG II (1 μM) in TRI102 and TRI103 cells. B: measurements of changes in [Ca2+]i (calculated as the maximum fura-2 ratio value after treatment minus the average baseline ratio value) in the presence or absence of the ARB valsartan (Val; 1 μM). Values are expressed as means ± SE. ***P < 0.001. C: measurements of changes in [Ca2+]i in response to thapsigargin (TG; 1 μM). Inhibition of endoplasmic reticulum (ER) Ca2+-ATPase produced equivalent Ca2+ responses in TRI102 and TRI103 cells that were not affected by valsartan, demonstrating the specificity of the ANG II effect. D: VEGF-A levels were measured by ELISA in conditioned media from TRI102 and TRI103 cells that were seeded at equal density, cultured to near confluence, serum deprived, and treated for 24 h with or without the mammalian target of rapamycin (mTOR) complex 1 (mTORC1) inhibitor RAD-001 (20 nM) or ANG II (10 or 100 nM). Values are expressed as means ± SEM. **P < 0.01. E: cell number quantitation was performed by crystal violet assay on TRI102 and TRI103 cells in the presence or absence of ANG II (100 nM), valsartan (1 μM), or the combination for 48 h. Bars represent means ± SEM. *P < 0.05; **P < 0.01.
Angiomyolipoma ultrastructural analysis supports vascular origin.
Vascular abnormalities associated with TSC include aneurysms in angiomyolipomas (55), the aorta (48), and the brain (6). Microscopic, histochemical, and morphological observations of angiomyolipomas are consistent with a vascular cell of origin. Using electron microscopy, we noted that angiomyolipoma cells, especially spindle and epithelioid cells, produced an extracellular matrix that appeared to be basal lamina (Fig. 5A). This is an important finding because endothelial cells and pericytes produce such structures in the vasculature.
Fig. 5.
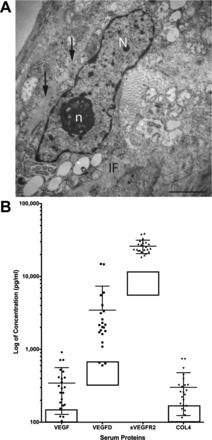
Image of a renal angiomyolipoma cell with basal lamina and serum biomarkers in patients with TSC and renal angiomyolipomas. A: scanning electron microscopy image of an angiomyolipoma cell from a patient with TSC. Note the basal lamina (black arrows). N, nucleus; n, nucleolus; IF, intermediate filaments. Bar = 2 μm. B: serum biomarkers from patients with TSC. Solid circles are individual patients (n = 25), and boxes represent the normal range in unaffected individuals. sVEGFR, soluble VEGF receptor (VEGFR); COL4, collagen type IV.
TSC patients display elevated markers, supporting vascular origin.
Because pericytes can express VEGF-A, VEGF-D, sVEGFR1, sVEGFR2, and collagen type IV, we examined these serum biomarkers in a group of 25 adult patients with TSC and renal angiomyolipomas. We identified a marked increase in circulating concentrations of collagen type IV, sVEGFR2, VEGF-A, and VEGF-D (Fig. 5B). Another study (8) by our group demonstrated that collagen type IV was reduced in TSC patients treated with an mTORC1 inhibitor, suggesting that the tumor is the source of this elevated biomarker. To clarify whether these observations reflected a likely pericyte origin of angiomyolipomas or simply robust angiogenesis in tumors of nonvascular origin, we further characterized the cellular components of angiomyolipomas.
Angiomyolipoma tissue expresses pericyte markers and cells display pericyte signaling.
Although not unique to pericytes, the AT1R is found in pericytes from various tissues (25, 32). We performed immunohistochemistry for additional pericyte markers on TSC-associated angiomyolipomas. Although there are no exclusive or universal pericyte markers, α-SMA and PDGFR-β are frequently used. Pericyte and vascular smooth muscle PDGFR-β activity is critical for vasculogenesis and angiogenesis (53), and both PDGF-BB- and PDGFR-β-null mice die at late gestation from widespread microvascular bleeding (34) caused by a severe reduction of vascular smooth muscle cells and pericytes (38). We confirmed that, whereas the neovasculature displayed intense staining, angiomyolipoma cells did not express the endothelial marker CD31 (Fig. 6, A and B) but did express much more PDGFR-β than vascular smooth muscle (Fig. 6C). A similar staining pattern was observed for the pericyte marker desmin (Fig. 6E), and α-SMA, a recognized marker of pericytes and smooth muscle and a known marker of angiomyolipomas, strongly stained both the tumor and vascular smooth muscle. In addition to PDGFR-β, we found that human angiomyolipomas displayed strong staining for VEGFR2 (Fig. 6D), which is a marker for endothelial cells and pericytes. We performed in vitro experiments to test whether PDGF-mediated signaling was evident in angiomyolipoma cells. We found that PDGF-BB treatment caused rapid phosphorylation of Akt (Fig. 7), a well-characterized downstream target of PDGFR-β activation (56). Notably, TRI102 cells displayed enhanced Akt activation compared with TRI103 cells. This finding is consistent with work from another group who demonstrated sensitivity of human TSC-deficient angiomyolipoma and murine TSC-deficient sarcoma cell models to PDGFR antagonists (2, 11, 21). In contrast to our results, another group has shown diminished PDGFR-β levels with mTOR activation, but in TSC-null mouse embryonic fibroblasts (56).
Fig. 6.
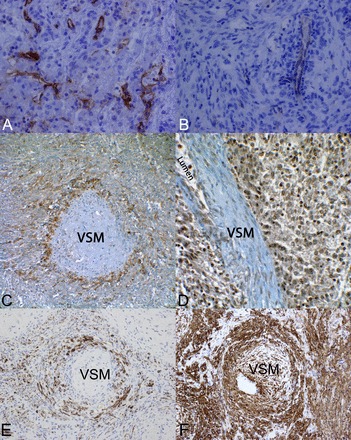
Immunohistochemical evidence of pericyte origin of renal angiomyolipomas. A: the endothelial cell marker CD31 in an epithelioid angiomyolipoma from a patient with TSC (×400 magnification). B: CD31 staining in a spindle cell predominant angiomyolipoma from a patient with TSC (×400 magnification). C: immunohistochemical staining of an angiomyolipoma for PDGF receptor (PDGFR)-β. The section revealed a tangential cut through a blood vessel wall such that the center is vascular smooth muscle (VSM), which was not stained, but the surrounding pericytes stained strongly positive for PDGFR-β. Angiomyolipoma surrounding the vessel also stained positive for PDGFR-β (×400 magnification). D: immunohistochemical staining for VEGFR2. This section was slightly deeper and revealed the vessel lumen. VSM cells did not stain, but the surrounding endothelial, pericyte, and angiomyolipoma cells all exhibited robust staining for VEGFR2 (×400 magnification). E: immunohistochemical staining of an angiomyolipoma for desmin. The section revealed a tangential cut through a blood vessel wall with a similar staining pattern as that of PDGFR-β. F: immunohistochemical staining of an angiomyolipoma for α-smooth muscle actin (α-SMA). VSM and the surrounding pericytes/tumor areas were strongly positive. Four separate TSC-associated angiomyolipomas were analyzed.
Fig. 7.
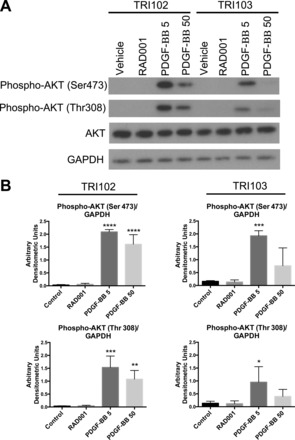
Functional evidence of pericyte origin of renal angiomyolipomas. A: Western blot of phosphorylated (Ser473 and Thr308) and nonphosphorylated Akt in TRI102 and TRI103 cells after 1 h of treatment with PDGF-BB (5 or 50 ng/ml) or RAD-001 (20 nM). Results are representative of three separate experiments. B: densitometric analysis of immunoblots in A. *P < 0.05, **P < 0.01, ***P < 0.001, and ****P < .0001 compared with control.
ANG II contributes to angiomyolipoma smooth muscle-like characteristics.
The spindle cell morphology and expression of smooth muscle actin contribute to the smooth muscle cell appearance of some of the cellular components of angiomyolipomas. Because ANG II causes pericyte contraction, we posited that ANG II exposure would enhance the smooth muscle-like characteristics of angiomyolipoma cells. To explore this possibility, we exposed angiomyolipoma cells in culture to ANG II. This stimulus resulted in an upregulation of α-SMA and H-caldesmon, a smooth muscle marker that has been detected in human angiomyolipoma tissue (33), in TRI102 cells, whereas levels in TRI103 cells were unchanged (Fig. 8).
Fig. 8.
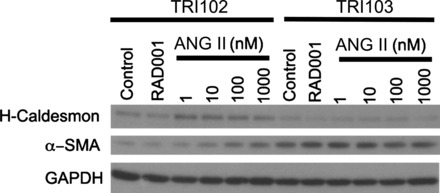
ANG II promotes expression of VSM markers in cultured human renal angiomyolipoma cells. Western blots of H-caldesmon and α-SMA in TRI102 and TRI103 cells after 24 h of treatment with ANG II (1–1,000 nM) or RAD-001 (20 nM) are shown. Results are representative of four separate experiments.
Endoplasmic reticulum stress contributes to the angiomyolipoma adipocyte-like appearance.
This evidence for pericyte lineage and characteristics of angiomyolipomas begs the question of why or how do angiomyolipomas acquire adipose and melanocytic characteristics? To test whether the fatty component of angiomyolipomas is of adipocyte origin, we performed immunohistochemistry for S100 on angiomyolipomas from biopsy and nephrectomy specimens of patients with TSC and on tissues from non-TSC patients. Lipoblasts, adipocyte tissue, and even a myxoid liposarcoma exhibited both cytoplasmic and nuclear staining with an antibody to S100 (Fig. 9, A and B) (51), whereas fat-containing hepatocytes with nonalcoholic fatty liver disease as well as angiomyolipomas did not display this positive staining (Fig. 9, C and D).
Fig. 9.
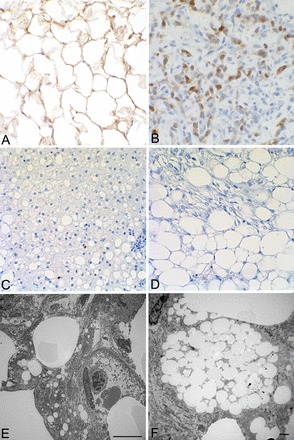
Immunohistochemical staining for S100 (A–D) and electron microscopy (E and F). A–D: adipose tissue (A) and myxoid liposarcoma without visible fat (B) both stained with S100, whereas nonalcoholic fatty liver disease (C) and angiomyolipoma associated with TSC (D) did not. E and F: cells of an angiomyolipoma appeared to have accumulated lipid droplets (E; bar = 10 μm) rather than differentiating into mature fat and thus have a similar appearance to lipoblasts (F; bar = 3 μm) while lacking the lipoblast lineage.
The adipose-like tissue in angiomyolipomas appears to be the result of lipid droplet accumulation as determined by electron microscopy (Fig. 9, E and F). The deregulation of the mTORC1 pathway and associated changes in translation result in increased activity of the lipid-generating transcription factor sterol regulatory element-binding protein (SREBP)1c (36) as well as inducing endoplasmic reticulum (ER) stress and the unfolded protein response (43) and increasing production of the rough ER (49). We found that TRI102 cells accumulated lipids to a greater degree than TRI103 cells (Fig. 10A). With the use of MG-132 to induce ER stress, as we have previously demonstrated (49), lipid accumulation was visibly enhanced in a genetically determined manner (Fig. 10B).
Fig. 10.
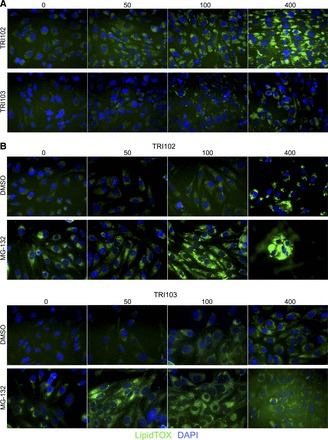
ER stress enhances lipid droplet accumulation in cultured human renal angiomyolipoma cells. A: fluorescence imaging of lipid droplet accumulation in TRI102 and TRI103 cells. TRI102 and TRI103 cells were treated with culture media supplemented with 0, 50, 100, or 400 μM Na-oleate for 24 h. Lipid droplet accumulation was evaluated by staining cells with LipidTOX (green), which labels neutral lipid droplets. Nuclei were labeled with 4′,6-diamidino-2-phenylindole (DAPI; blue). Lipid droplet accumulation was greater in TRI102 cells. Displayed images are from the same experiment. Image acquisition settings were constant for each experiment. Results are representative of four separate experiments. B: cells were treated with culture media supplemented with 0, 50, 100, or 400 μM Na-oleate including either the proteasome inhibitor MG-132 (500 nM) or DMSO for 4 h. Lipid droplet accumulation was visibly enhanced by MG-132. Displayed images are from the same experiment. Image acquisition settings were constant for each experiment. Results are representative of two separate experiments.
mTORC1-driven MITF signaling contributes to melanocyte marker expression in angiomyolipomas.
Heightened mTORC1 activity is associated with increased activity of MITF transcription factors [transcription factor E (TFE)3 and TFEB] in angiomyolipoma cells (37). MITF transcription factor activity is known to increase MART-1/MelanA and HMB-45. GPNMB is another downstream target of these MITF transcription factors (27) that was first cloned from a melanoma cell line and is expressed in many such lines. GPNMB is a transmembrane protein reported to play a role in osteoblast and osteoclast differentiation as well as cancer cell metastasis (46). Angiomyolipoma tissues from patients with TSC expressed significant amounts of GPNMB (Fig. 11). This staining appeared to be most robust in epithelioid cells (Fig. 11, B and D) and strong in adipocyte-like cells (Fig. 11A), whereas most spindle-shaped cells did not show expression (Fig. 11, C and D). Translocation (TFE+) renal cell carcinoma, the most common form of pediatric renal cell carcinoma, characterized by cells with an epithelioid and polygonal appearance, is known to produce melanocyte markers driven by aberrant MITF transcription factor activity (20). As a positive control, we observed robust GPNMB expression in translocation renal cell carcinoma, and very little staining was observed in normal kidney tissue (Fig. 11, E and F).
Fig. 11.
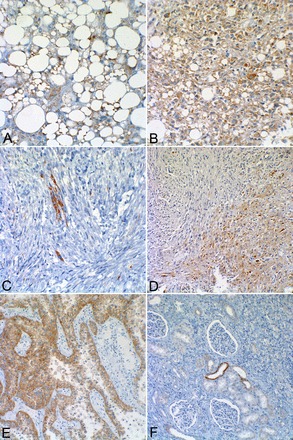
Angiomyolipoma staining for glycoprotein nonmetastatic B (GPNMB). A: adipocyte-like angiomyolipoma cells displayed immunohistochemical staining for GPNMB (×200 magnification). B: epithelioid angiomyolipoma cells with strong GPNMB staining (×200 magnification). C: spindle angiomyolipoma cells showing scattered positive cells, whereas most showed little or no staining (×200 magnification). D: field with both spindle and epithelioid angiomyolipoma cells. Note that much stronger staining was seen in epithelioid cells (bottom right) compared with spindle-shaped cells (top left) (×100 magnification). E: translocation renal cell carcinoma showing very strong histochemical staining for GPNMB (×100 magnification). Note the significantly stronger staining of the renal cell carcinoma compared with the angiomyolipoma in A–D. F: a normal kidney showing mostly no staining for GPNMB, although two distal tubules exhibited positive staining (×200 magnification).
DISCUSSION
Our data suggest that ANG II signaling is integral to the development and cellular phenotype of angiomyolipomas and that modifying this signaling pathway by AT1R blockade or ACE inhibition represents a candidate approach for preventive therapy. In a defined subpopulation of TSC patients with polycystic kidney disease, we observed that antihypertensive therapy targeting ANG II signaling correlated with a reduced angiomyolipoma burden. There is no evidence in the published literature to suggest that polycystic kidney disease would preclude angiomyolipoma formation in those patients, and coexistence of renal cysts and angiomyolipomas has been documented (45). Because this is a retrospective observation, no causality can be inferred. However, given this correlation between antihypertensive therapy targeting ANG II signaling and the reduced tumor burden in this TSC patient subpopulation, we posit that ANG II may play a role in angiomyolipoma pathogenesis. We recognize that polycystic kidney disease could enhance renin-angiotensin-aldosterone system activity in these patients compared with TSC patients with only angiomyolipomas due to compression of the renal vasculature. However, this would not preclude relevance to the latter group because the threshold for an effect of ANG II is not known, and autocrine ANG II signaling [as observed in TSC-affected LAM cells (52)] could also be a factor. We submit that the findings from TSC2-PKD1 contiguous gene syndrome patients and TSC patient tissue, combined with the in vitro ANG II data, provide a rationale for more extensive examination of the role of angiotensin signaling in TSC renal angiomyolipoma tumorigenesis. Taken together, these data also support the investigation of ACE inhibitors or ARBs in angiomyolipoma prevention trials for patients with TSC.
Here, we report the first evidence supporting a pericyte origin of renal angiomyolipomas. The ultrastructural analysis and immunohistochemical and biochemical expression of pericyte-associated proteins by angiomyolipomas support the assertion that angiomyolipomas may arise from pericytes. The combined expression pattern is consistent with pericytes, but not mature vascular smooth muscle or endothelial cells. A previous study of human angiomyolipomas demonstrated expression of neural/glial antigen 2 proteoglycan, a marker for various incompletely differentiated precursor cells, which consistently labels pericytes, adding support to the present findings (37, 44).
Our findings also suggest that angiomyolipoma aneurysm formation in TSC patients might be reduced by treatment with ARBs as occurs in both patients with and animal models of Marfan syndrome (13, 24). ANG II promotes the migration of retinal microvascular pericytes (42). An attractive hypothesis is that abnormal ANG II-induced angiomyolipoma cell migration may contribute to vascular instability and increase aneurysm formation in a similar fashion to decreased pericyte recruitment. Interestingly, autocrine VEGF-A signaling in pericytes has been shown to disrupt PDGFR-β-mediated pericyte recruitment to endothelial cells (38), a contributing factor to vessel destabilization (23). This provides one possible explanation for the propensity of angiomyolipomas to develop aneurysms that lead to vascular hemorrhage. In addition, pericyte origin may help explain why the vascular markers VEGF-A, VEGF-D, and collagen type IV correlate with angiomyolipoma burden and therapeutic responses in TSC patients, who do not exhibit dramatic ongoing angiogenesis (9).
Our findings suggest a novel model for the variable cellular phenotypes (smooth muscle, fat, and epithelioid) that characterize angiomyolipomas, despite their clonal nature (Fig. 12). ANG II and transforming growth factor-β have been reported to facilitate pericyte transition to a smooth muscle-like phenotype, including increased α-SMA expression and the ability to contract (39). The renal microenvironment, specifically the local production of ANG II, could drive the cellular smooth muscle phenotype in angiomyolipoma. As ACE is also produced by the lungs, these findings may also have relevance to LAM, a pulmonary disorder characterized by the proliferation of smooth muscle-like cells that occurs as a frequent manifestation of TSC and as a rare sporadic disease, often in association with renal angiomyolipoma. In fact, our findings are consistent with previous work that found evidence for a functioning RAS in LAM cells (52). Interestingly, the other components (fat and epithelioid) also express AT1Rs. Why or how these cells are phenotypically different from smooth muscle-like cells is not certain but may result from additional epigenetic or renal microenvironmental influences, such as ER stress, or possibly through other abnormal signaling that can affect pericyte differentiation such as the Notch pathway, which is also aberrantly active in angiomyolipomas (3, 31).
Fig. 12.

Model linking mTOR dysregulation to acquired angiomyolipoma cellular phenotypes. This model illustrates how loss of mTOR regulation in the pericyte would produce the vascular, smooth muscle-like, and adipose-like cells found in angiomyolipomas and may also explain the melanocyte-like phenotypic changes as well as the epithelioid variant. Italics indicate findings supported by the published work. Nonitalicized points are directly supported by evidence from the present study. MITF, microphthalmia-associated transcription factor; HMB-45, human melanoma black-45; SREBP1c, sterol regulatory element-binding protein 1c; ATII, ANG II type 2 receptor.
Histologically, the fatty component of angiomyolipomas can appear indistinguishable from adipose tissue using hematoxylin and eosin staining. Adipocyte lineages express S100 (4), and S100 is used to help identify tumors that originate from adipocytes (15). Intrigued by a report in which angiomyolipomas did not stain with antibody to S100 (50), we postulated that the metabolic effects caused by TSC gene mutations result in pericyte lipid accumulation as seen in hepatocytes in nonalcoholic fatty liver disease. Such accumulation is also seen in another organ-specific pericyte, the hepatic stellate cell (47), and may be due to ER stress. Angiomyolipomas have previously been shown to exhibit ER stress (43, 49), which results in the cleavage and activation of the ubiquitous SREBP1c transcription factor (19), leading to lipogenesis. The renal microenvironment may enhance this process, promoting the adipocyte-like phenotype that characterizes angiomyolipomas.
As a result of the unfolded protein response, SREBP1c is activated by cleavage (16, 29), presumably to make more ER. This also requires more ribosomes, which may explain why the epithelioid phenotype contains the prominent nucleolus, where ribosomes are made. Finally, expression of the melanocyte markers HMB-45, MART-1/MelanA, and GPNMB in angiomyolipomas can also be explained in terms of the genetic defect and not limited to a neural crest lineage hypothesis (40). The differential expression pattern of GPNMB in epithelioid and adipocyte-like versus spindle cells in angiomyolipomas observed in the present study may be explained by differential regulation of MITF-driven melanocyte markers (26), potentially through microenvironmental factors such as ER stress.
GRANTS
This work was supported by a Rothberg Courage Award from the Tuberous Sclerosis Alliance (to J. J. Bissler), a Fellowship Award from the Tuberous Sclerosis Alliance (to B. J. Siroky), and the Wales Gene Park (to J. R. Sampson).
DISCLOSURES
No conflicts of interest, financial or otherwise, are declared by the author(s).
AUTHOR CONTRIBUTIONS
Author contributions: B.J.S., B.P.D., R.J.R., P.D.B., J.R.S., and J.J.B. conception and design of research; B.J.S., H.Y., R.J.R., A.R.H., T.R., Z.T., M.A.B., J.D., J.R.S., and J.J.B. performed experiments; B.J.S., H.Y., R.J.R., A.R.H., T.R., Z.T., M.A.B., J.D., J.R.S., and J.J.B. analyzed data; B.J.S., H.Y., B.P.D., R.J.R., A.R.H., P.D.B., J.R.S., and J.J.B. interpreted results of experiments; B.J.S., M.A.B., and J.J.B. prepared figures; B.J.S. and J.J.B. drafted manuscript; B.J.S., H.Y., B.P.D., P.D.B., J.R.S., and J.J.B. edited and revised manuscript; B.J.S., H.Y., B.P.D., P.D.B., J.R.S., and J.J.B. approved final version of manuscript.
ACKNOWLEDGMENTS
The authors thank Dr. Elizabeth P. Henske (Brigham and Womens Hospital) and Dr. Nancy Kleene (University of Cincinnati) for helpful discussions and Dr. Dave Bridges (University of Tennessee Health Science Center) for critiquing this manuscript.
REFERENCES
- 1.Allt G, Lawrenson JG. Pericytes: cell biology and pathology. Cells Tissues Organs 169: 1–11, 2001. [DOI] [PubMed] [Google Scholar]
- 2.Arbiser JL, Brat D, Hunter S, D'Armiento J, Henske EP, Arbiser ZK, Bai X, Goldberg G, Cohen C, Weiss SW. Tuberous sclerosis-associated lesions of the kidney, brain, and skin are angiogenic neoplasms. J Am Acad Dermatol 46: 376–380, 2002. [DOI] [PubMed] [Google Scholar]
- 3.Armulik A, Genove G, Betsholtz C. Pericytes: developmental, physiological, and pathological perspectives, problems, and promises. Dev Cell 21: 193–215, 2011. [DOI] [PubMed] [Google Scholar]
- 4.Atanassova P. Immunohistochemical expression of S-100 protein in human embryonal fat cells. Cells Tissues Organs 169: 355–360, 2001. [DOI] [PubMed] [Google Scholar]
- 5.Barnard M, Lajoie G. Angiomyolipoma: immunohistochemical and ultrastructural study of 14 cases. Ultrastruct Pathol 25: 21–29, 2001. [DOI] [PubMed] [Google Scholar]
- 6.Beltramello A, Puppini G, Bricolo A, Andreis IA, el-Dalati G, Longa L, Polidoro S, Zavarise G, Marradi P. Does the tuberous sclerosis complex include intracranial aneurysms? A case report with a review of the literature. Pediatr Radiol 29: 206–211, 1999. [DOI] [PubMed] [Google Scholar]
- 7.Bissler JJ, Kingswood JC. Renal angiomyolipomata. Kidney Int 66: 924–934, 2004. [DOI] [PubMed] [Google Scholar]
- 8.Bissler JJ, Kingswood JC, Radzikowska E, Zonnenberg BA, Frost M, Belousova E, Sauter M, Nonomura N, Brakemeier S, de Vries PJ, Whittemore VH, Chen D, Sahmoud T, Shah G, Lincy J, Lebwohl D, Budde K. Everolimus for angiomyolipoma associated with tuberous sclerosis complex or sporadic lymphangioleiomyomatosis (EXIST-2): a multicentre, randomised, double-blind, placebo-controlled trial. Lancet 381: 817–824, 2013. [DOI] [PubMed] [Google Scholar]
- 9.Bissler JJ, Kingswood JC, Radzikowska E, Zonnenberg BA, Frost M, Belousova E, Sauter M, Nonomura N, Brakemeier S, de Vries PJ, Whittemore VH, Chen D, Sahmoud T, Shah G, Gray D, Lebwohl D, Budde K. Everolimus for angiomyolipoma associated with tuberous sclerosis complex. Lancet. In press. [DOI] [PubMed] [Google Scholar]
- 10.Bissler JJ, McCormack FX, Young LR, Elwing JM, Chuck G, Leonard JM, Schmithorst VJ, Laor T, Brody AS, Bean J, Salisbury S, Franz DN. Sirolimus for angiomyolipoma in tuberous sclerosis complex or lymphangioleiomyomatosis. N Engl J Med 358: 140–151, 2008. [DOI] [PMC free article] [PubMed] [Google Scholar]
- 11.Boivin B, Zhang S, Arbiser JL, Zhang ZY, Tonks NK. A modified cysteinyl-labeling assay reveals reversible oxidation of protein tyrosine phosphatases in angiomyolipoma cells. Proc Natl Acad Sci USA 105: 9959–9964, 2008. [DOI] [PMC free article] [PubMed] [Google Scholar]
- 12.Bonetti F, Pea M, Martignoni G, Doglioni C, Zamboni G, Capelli P, Rimondi P, Andrion A. Clear cell (“sugar”) tumor of the lung is a lesion strictly related to angiomyolipoma–the concept of a family of lesions characterized by the presence of the perivascular epithelioid cells (PEC). Pathology 26: 230–236, 1994. [DOI] [PubMed] [Google Scholar]
- 13.Brooke BS, Habashi JP, Judge DP, Patel N, Loeys B, Dietz HC., 3rd Angiotensin II blockade and aortic-root dilation in Marfan's syndrome. N Engl J Med 358: 2787–2795, 2008. [DOI] [PMC free article] [PubMed] [Google Scholar]
- 14.Brugarolas JB, Vazquez F, Reddy A, Sellers WR, Kaelin WG., Jr TSC2 regulates VEGF through mTOR-dependent and -independent pathways. Cancer Cell 4: 147–158, 2003. [DOI] [PubMed] [Google Scholar]
- 15.Coffin CM, Lowichik A, Putnam A. Lipoblastoma (LPB): a clinicopathologic and immunohistochemical analysis of 59 cases. Am J Surg Pathol 33: 1705–1712, 2009. [DOI] [PubMed] [Google Scholar]
- 16.Colgan SM, Tang D, Werstuck GH, Austin RC. Endoplasmic reticulum stress causes the activation of sterol regulatory element binding protein-2. Int J Biochem Cell Biol 39: 1843–1851, 2007. [DOI] [PubMed] [Google Scholar]
- 17.Diaz-Flores L, Gutierrez R, Madrid JF, Varela H, Valladares F, Acosta E, Martin-Vasallo P, Diaz-Flores L., Jr Pericytes. Morphofunction, interactions and pathology in a quiescent and activated mesenchymal cell niche. Histol Histopathol 24: 909–969, 2009. [DOI] [PubMed] [Google Scholar]
- 18.Dixon BP, Hulbert JC, Bissler JJ. Tuberous sclerosis complex renal disease. Nephron Exp Nephrol 118: e15–e20, 2011. [DOI] [PMC free article] [PubMed] [Google Scholar]
- 19.Ferre P, Foufelle F. Hepatic steatosis: a role for de novo lipogenesis and the transcription factor SREBP-1c. Diabetes Obes Metab 12, Suppl 2: 83–92. [DOI] [PubMed] [Google Scholar]
- 20.Geller JI, Argani P, Adeniran A, Hampton E, De Marzo A, Hicks J, Collins MH. Translocation renal cell carcinoma: lack of negative impact due to lymph node spread. Cancer 112: 1607–1616, 2008. [DOI] [PubMed] [Google Scholar]
- 21.Govindarajan B, Willoughby L, Band H, Curatolo AS, Veledar E, Chen S, Bonner MY, Abel MG, Moses MA, Arbiser JL. Cooperative benefit for the combination of rapamycin and imatinib in tuberous sclerosis complex neoplasia. Vasc Cell 4: 11, 2012. [DOI] [PMC free article] [PubMed] [Google Scholar]
- 22.Green AJ, Sepp T, Yates JR. Clonality of tuberous sclerosis harmatomas shown by non-random X-chromosome inactivation. Hum Genet 97: 240–243, 1996. [DOI] [PubMed] [Google Scholar]
- 23.Greenberg JI, Shields DJ, Barillas SG, Acevedo LM, Murphy E, Huang J, Scheppke L, Stockmann C, Johnson RS, Angle N, Cheresh DA. A role for VEGF as a negative regulator of pericyte function and vessel maturation. Nature 456: 809–813, 2008. [DOI] [PMC free article] [PubMed] [Google Scholar]
- 24.Habashi JP, Judge DP, Holm TM, Cohn RD, Loeys BL, Cooper TK, Myers L, Klein EC, Liu G, Calvi C, Podowski M, Neptune ER, Halushka MK, Bedja D, Gabrielson K, Rifkin DB, Carta L, Ramirez F, Huso DL, Dietz HC. Losartan, an AT1 antagonist, prevents aortic aneurysm in a mouse model of Marfan syndrome. Science 312: 117–121, 2006. [DOI] [PMC free article] [PubMed] [Google Scholar]
- 25.Harata T, Ando H, Iwase A, Nagasaka T, Mizutani S, Kikkawa F. Localization of angiotensin II, the AT1 receptor, angiotensin-converting enzyme, aminopeptidase A, adipocyte-derived leucine aminopeptidase, and vascular endothelial growth factor in the human ovary throughout the menstrual cycle. Fertil Steril 86: 433–439, 2006. [DOI] [PubMed] [Google Scholar]
- 26.Hoashi T, Sato S, Yamaguchi Y, Passeron T, Tamaki K, Hearing VJ. Glycoprotein nonmetastatic melanoma protein b, a melanocytic cell marker, is a melanosome-specific and proteolytically released protein. FASEB J 24: 1616–1629, 2010. [DOI] [PMC free article] [PubMed] [Google Scholar]
- 27.Hong SB, Oh H, Valera VA, Baba M, Schmidt LS, Linehan WM. Inactivation of the FLCN tumor suppressor gene induces TFE3 transcriptional activity by increasing its nuclear localization. PLOS ONE 5: e15793. [DOI] [PMC free article] [PubMed] [Google Scholar]
- 28.Hornick JL, Fletcher CD. PEComa: what do we know so far? Histopathology 48: 75–82, 2006. [DOI] [PubMed] [Google Scholar]
- 29.Kammoun HL, Chabanon H, Hainault I, Luquet S, Magnan C, Koike T, Ferre P, Foufelle F. GRP78 expression inhibits insulin and ER stress-induced SREBP-1c activation and reduces hepatic steatosis in mice. J Clin Invest 119: 1201–1215, 2009. [DOI] [PMC free article] [PubMed] [Google Scholar]
- 30.Karbowniczek M, Yu J, Henske EP. Renal angiomyolipomas from patients with sporadic lymphangiomyomatosis contain both neoplastic and non-neoplastic vascular structures. Am J Pathol 162: 491–500, 2003. [DOI] [PMC free article] [PubMed] [Google Scholar]
- 31.Karbowniczek M, Zitserman D, Khabibullin D, Hartman T, Yu J, Morrison T, Nicolas E, Squillace R, Roegiers F, Henske EP. The evolutionarily conserved TSC/Rheb pathway activates Notch in tuberous sclerosis complex and Drosophila external sensory organ development. J Clin Invest 120: 93–102, 2010. [DOI] [PMC free article] [PubMed] [Google Scholar]
- 32.Kawamura H, Kobayashi M, Li Q, Yamanishi S, Katsumura K, Minami M, Wu DM, Puro DG. Effects of angiotensin II on the pericyte-containing microvasculature of the rat retina. J Physiol 561: 671–683, 2004. [DOI] [PMC free article] [PubMed] [Google Scholar]
- 33.Kufer V, Schwab SA, Buttner M, Agaimy A, Uder M, Amann K. Incidental monotypic (fat-poor) renal angiomyolipoma diagnosed by core needle biopsy. Case Rep Med 2012: 906924, 2012. [DOI] [PMC free article] [PubMed] [Google Scholar]
- 34.Leveen P, Pekny M, Gebre-Medhin S, Swolin B, Larsson E, Betsholtz C. Mice deficient for PDGF B show renal, cardiovascular, and hematological abnormalities. Genes Dev 8: 1875–1887, 1994. [DOI] [PubMed] [Google Scholar]
- 35.Levy C, Khaled M, Fisher DE. MITF: master regulator of melanocyte development and melanoma oncogene. Trends Mol Med 12: 406–414, 2006. [DOI] [PubMed] [Google Scholar]
- 36.Li S, Brown MS, Goldstein JL. Bifurcation of insulin signaling pathway in rat liver: mTORC1 required for stimulation of lipogenesis, but not inhibition of gluconeogenesis. Proc Natl Acad Sci USA 107: 3441–3446, 2010. [DOI] [PMC free article] [PubMed] [Google Scholar]
- 37.Lim SD, Stallcup W, Lefkove B, Govindarajan B, Au KS, Northrup H, Lang D, Fisher DE, Patel A, Amin MB, Arbiser JL. Expression of the neural stem cell markers NG2 and L1 in human angiomyolipoma: are angiomyolipomas neoplasms of stem cells? Mol Med 13: 160–165, 2007. [DOI] [PMC free article] [PubMed] [Google Scholar]
- 38.Lindahl P, Johansson BR, Leveen P, Betsholtz C. Pericyte loss and microaneurysm formation in PDGF-B-deficient mice. Science 277: 242–245, 1997. [DOI] [PubMed] [Google Scholar]
- 39.Matsugi T, Chen Q, Anderson DR. Contractile responses of cultured bovine retinal pericytes to angiotensin II. Arch Ophthalmol 115: 1281–1285, 1997. [DOI] [PubMed] [Google Scholar]
- 40.Matsumoto Y, Horiba K, Usuki J, Chu SC, Ferrans VJ, Moss J. Markers of cell proliferation and expression of melanosomal antigen in lymphangioleiomyomatosis. Am J Respir Cell Mol Biol 21: 327–336, 1999. [DOI] [PubMed] [Google Scholar]
- 41.Mehta PK, Griendling KK. Angiotensin II cell signaling: physiological and pathological effects in the cardiovascular system. Am J Physiol Cell Physiol 292: C82–C97, 2007. [DOI] [PubMed] [Google Scholar]
- 42.Nadal JA, Scicli GM, Carbini LA, Scicli AG. Angiotensin II stimulates migration of retinal microvascular pericytes: involvement of TGF-β and PDGF-BB. Am J Physiol Heart Circ Physiol 282: H739–H748, 2002. [DOI] [PubMed] [Google Scholar]
- 43.Ozcan U, Ozcan L, Yilmaz E, Duvel K, Sahin M, Manning BD, Hotamisligil GS. Loss of the tuberous sclerosis complex tumor suppressors triggers the unfolded protein response to regulate insulin signaling and apoptosis. Mol Cell 29: 541–551, 2008. [DOI] [PMC free article] [PubMed] [Google Scholar]
- 44.Ozerdem U, Grako KA, Dahlin-Huppe K, Monosov E, Stallcup WB. NG2 proteoglycan is expressed exclusively by mural cells during vascular morphogenesis. Dev Dyn 222: 218–227, 2001. [DOI] [PubMed] [Google Scholar]
- 45.Sampson JR, Maheshwar MM, Aspinwall R, Thompson P, Cheadle JP, Ravine D, Roy S, Haan E, Berstein J, Harris PC. Renal cystic disease in tuberous sclerosis: role of the polycystic kidney disease 1 gene. Am J Hum Genet 61: 843–851, 1997. [DOI] [PMC free article] [PubMed] [Google Scholar]
- 46.Selim AA. Osteoactivin bioinformatic analysis: prediction of novel functions, structural features, and modes of action. Med Sci Monit 15: MT19–MT33, 2009. [PubMed] [Google Scholar]
- 47.Senoo H. Structure and function of hepatic stellate cells. Med Electron Microsc 37: 3–15, 2004. [DOI] [PubMed] [Google Scholar]
- 48.Shepherd CW, Gomez MR, Lie JT, Crowson CS. Causes of death in patients with tuberous sclerosis. Mayo Clin Proc 66: 792–796, 1991. [DOI] [PubMed] [Google Scholar]
- 49.Siroky BJ, Yin H, Babcock JT, Lu L, Hellmann AR, Dixon BP, Quilliam LA, Bissler JJ. Human TSC-associated renal angiomyolipoma cells are hypersensitive to ER stress. Am J Physiol Renal Physiol 303: F831–F844, 2012. [DOI] [PMC free article] [PubMed] [Google Scholar]
- 50.Stone CH, Lee MW, Amin MB, Yaziji H, Gown AM, Ro JY, Tetu B, Paraf F, Zarbo RJ. Renal angiomyolipoma: further immunophenotypic characterization of an expanding morphologic spectrum. Arch Pathol Lab Med 125: 751–758, 2001. [DOI] [PubMed] [Google Scholar]
- 51.Turner MS, Goldsmith JD. Best practices in diagnostic immunohistochemistry: spindle cell neoplasms of the gastrointestinal tract. Arch Pathol Lab Med 133: 1370–1374, 2009. [DOI] [PubMed] [Google Scholar]
- 52.Valencia JC, Pacheco-Rodriguez G, Carmona AK, Xavier J, Bruneval P, Riemenschneider WK, Ikeda Y, Yu ZX, Ferrans VJ, Moss J. Tissue-specific renin-angiotensin system in pulmonary lymphangioleiomyomatosis. Am J Respir Cell Mol Biol 35: 40–47, 2006. [DOI] [PMC free article] [PubMed] [Google Scholar]
- 53.Wiens KM, Lee HL, Shimada H, Metcalf AE, Chao MY, Lien CL. Platelet-derived growth factor receptor beta is critical for zebrafish intersegmental vessel formation. PLOS ONE 5: e11324. [DOI] [PMC free article] [PubMed] [Google Scholar]
- 54.Wu CF, Chiang WC, Lai CF, Chang FC, Chen YT, Chou YH, Wu TH, Linn GR, Ling H, Wu KD, Tsai TJ, Chen YM, Duffield JS, Lin SL. Transforming growth factor β-1 stimulates profibrotic epithelial signaling to activate pericyte-myofibroblast transition in obstructive kidney fibrosis. Am J Pathol 182: 118–131, 2013. [DOI] [PMC free article] [PubMed] [Google Scholar]
- 55.Yamakado K, Tanaka N, Nakagawa T, Kobayashi S, Yanagawa M, Takeda K. Renal angiomyolipoma: relationships between tumor size, aneurysm formation, and rupture. Radiology 225: 78–82, 2002. [DOI] [PubMed] [Google Scholar]
- 56.Zhang H, Cicchetti G, Onda H, Koon HB, Asrican K, Bajraszewski N, Vazquez F, Carpenter CL, Kwiatkowski DJ. Loss of Tsc1/Tsc2 activates mTOR and disrupts PI3K-Akt signaling through downregulation of PDGFR. J Clin Invest 112: 1223–1233, 2003. [DOI] [PMC free article] [PubMed] [Google Scholar]


