Significance
Reputational concern is one reason people perform behaviors that are good for society but have little benefit for individuals (e.g., energy efficiency, donation, recycling, voting). In order for a behavior to influence reputations, it must be observable. However, many strategies for encouraging these behaviors involve communicating privately and impersonally (e.g., mail, email, social media) with little or no observability. We report a large-scale field experiment (N = 770,946) examining a technique for harnessing the benefits of observability when encouraging these behaviors privately. Get-out-the-vote letters become substantially more effective when they say, “We may call you after the election to ask about your voting experience.” This technique can be widely used to encourage society-benefiting behaviors.
Keywords: public goods, reputation, observability, get-out-the-vote, field experiment
Abstract
People contribute more to public goods when their contributions are made more observable to others. We report an intervention that subtly increases the observability of public goods contributions when people are solicited privately and impersonally (e.g., mail, email, social media). This intervention is tested in a large-scale field experiment (n = 770,946) in which people are encouraged to vote through get-out-the-vote letters. We vary whether the letters include the message, “We may call you after the election to ask about your voting experience.” Increasing the perceived observability of whether people vote by including that message increased the impact of the get-out-the-vote letters by more than the entire effect of a typical get-out-the-vote letter. This technique for increasing perceived observability can be replicated whenever public goods solicitations are made in private.
How can we increase contributions to public goods—to get donors to give more to charity, citizens to vote, households to consume less energy, drivers to carpool, and patients to take all of their antibiotics? One of the best ways is to make contributions more observable (1, 2), as demonstrated by a large body of laboratory experiments (3–9) and a growing body of field experiments (for a review, see ref. 2) in a variety of settings, including energy conservation (10), blood donations (11), national park contributions (12), and voting (13).
Observability increases contributions to public goods such as voting or charitable giving because observability allows contributions to affect reputations. Individuals who are observed to have contributed can be held in good standing and rewarded in subsequent relationships, either when others are more likely to engage them in a relationship in the first place (this is called partner choice; e.g., refs. 14 and 15) or when others are more cooperative with them during an existing relationship (this is called indirect reciprocity; e.g., refs. 16–21). And, individuals who are observed to not contribute can be held in poor standing.
Even subtle cues of observability can increase contributions. In fact, observability can affect contributions when the reputational consequences of one’s choice have been entirely eliminated (22, 23). An example is eyespots: simply displaying a picture of a face or an abstraction resembling a face increases contributions (24, 25). Such effects imply that the psychology governing our reputations operates at the intuitive level (24)—that is, people do not necessarily deliberate over the reputational gains of every cooperative action, and instead rely on heuristics. Such an intuitive psychology might develop if the heuristics usually work (26, 27). For example, if seeing something that looks like a face is usually an accurate indication that someone is watching, then it may pay to give more whenever in the presence of something that looks like a face, even though a clever researcher may exploit this heuristic to induce people into giving a little more in an experiment. Moreover, there are reputational gains to cooperating without deliberating about the decision. Namely, people are perceived as being more trustworthy when cooperation is the automatic behavior. This, too, can lead people to rely more on cues and heuristics (28).
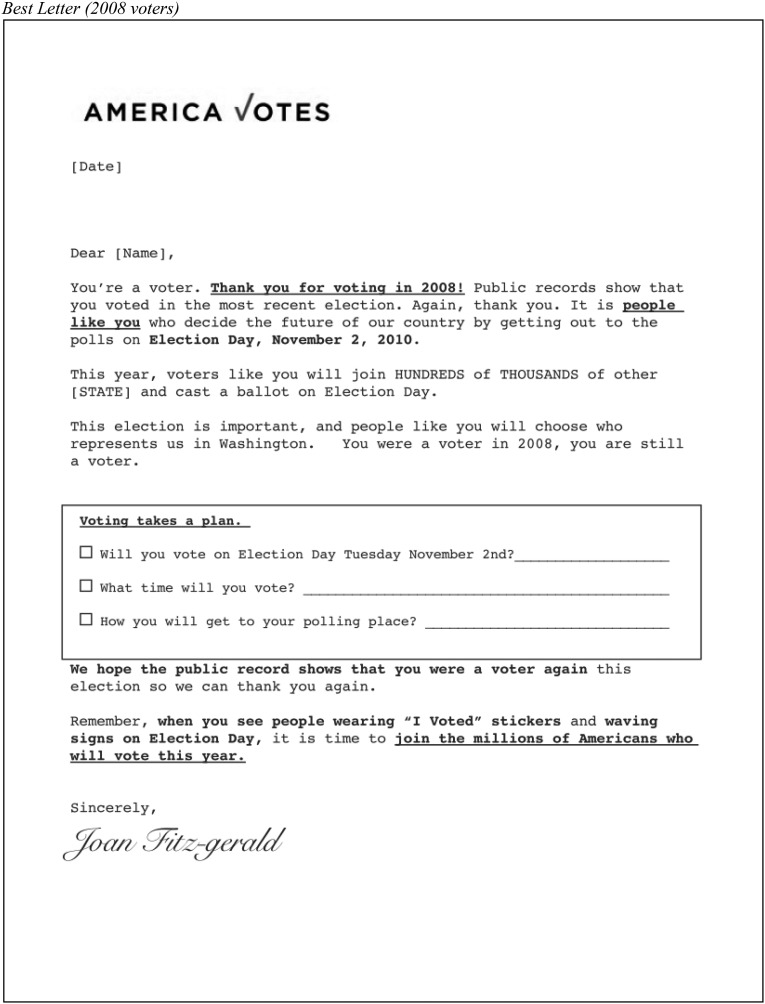
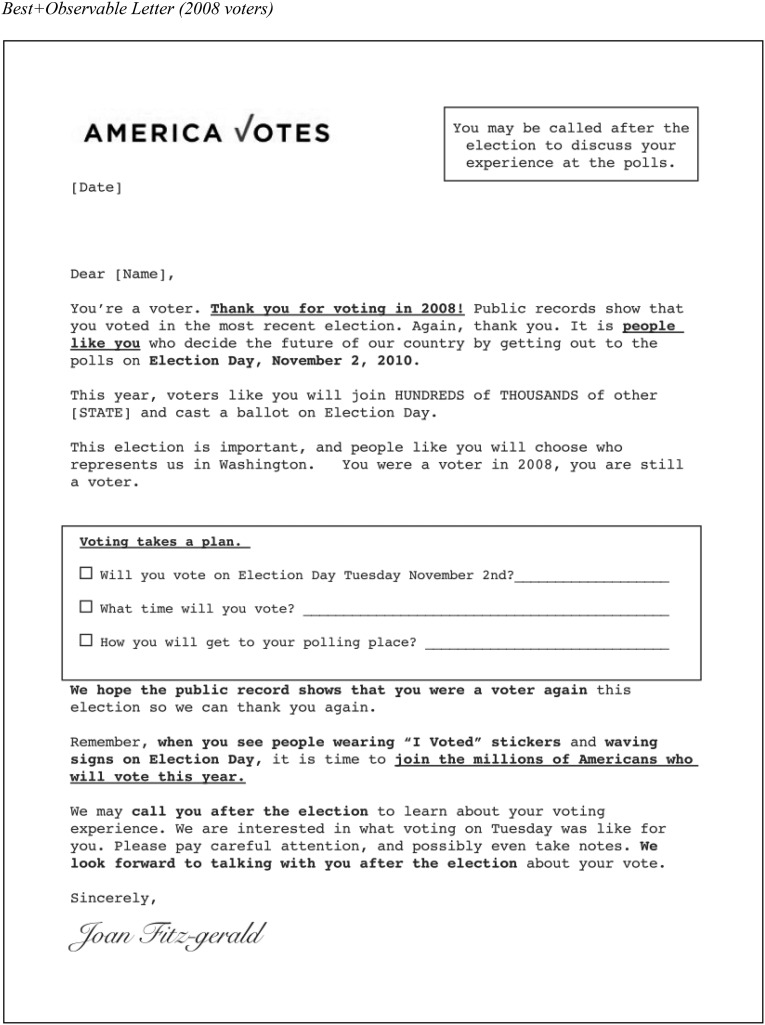
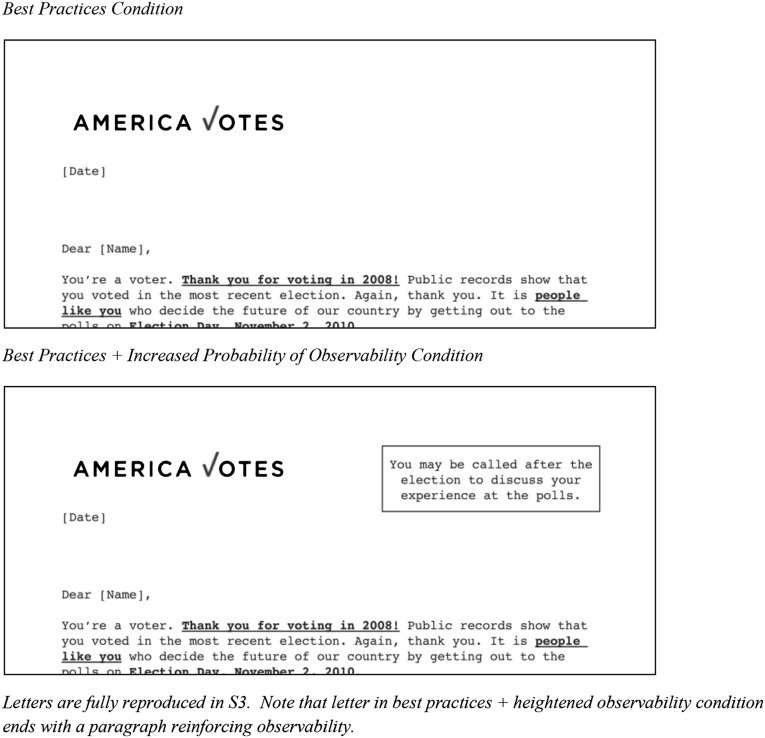
In this paper, we report the results of a large field experiment in which we subtly increased perceived observability to motivate contributions to a real-world public good: voting. The experiment involved sending get-out-the-vote (GOTV) letters to citizens before the 2010 General Election (total n = 770,946). There were three conditions. Those assigned to the best practices condition (“Best”; n = 346,929) were mailed a GOTV letter containing several messaging elements that have been shown to increase turnout (see Fig. S1 for complete reproduction of all letters and Tables S1 and S2 for balance checks across treatments). Those assigned to the best practices-plus-increased probability of observability condition (“Best plus Observable”; n = 347,054) were sent a GOTV letter that was identical to the one sent to those in the Best condition with two exceptions. First, at the top right corner of the page, these letters included the message, “You may be called after the election to discuss your experience at the polls.” Second, a paragraph was also added at the end of the GOTV letter reinforcing this message. See Fig. 1. Those assigned to the control received no GOTV letter (n = 76,963).
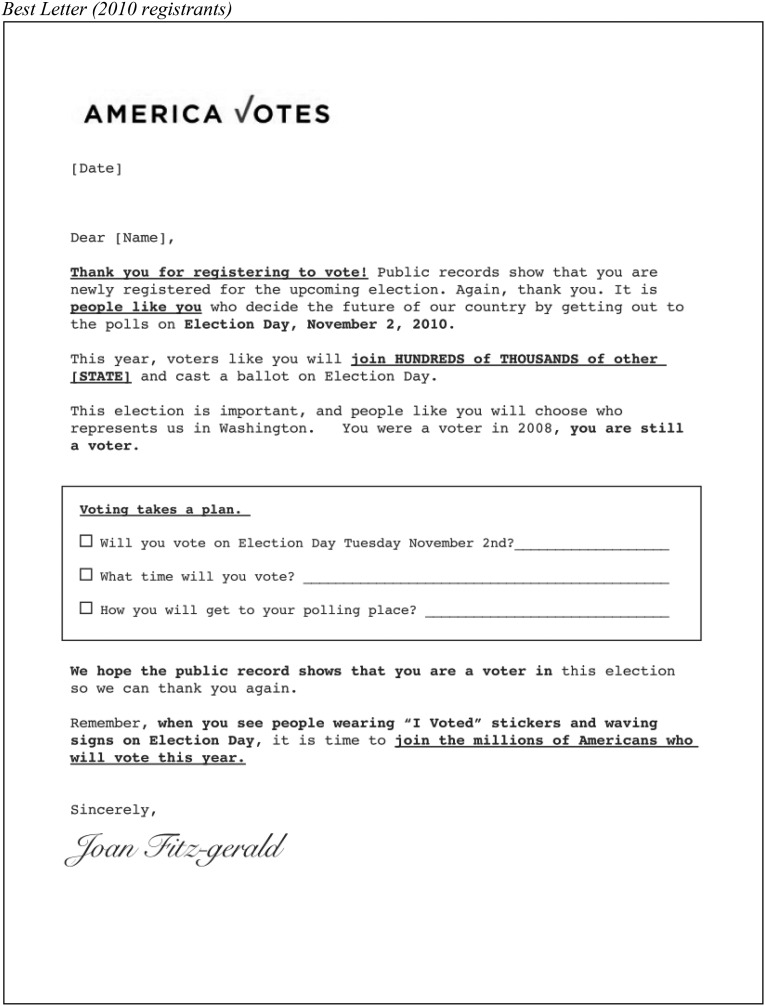
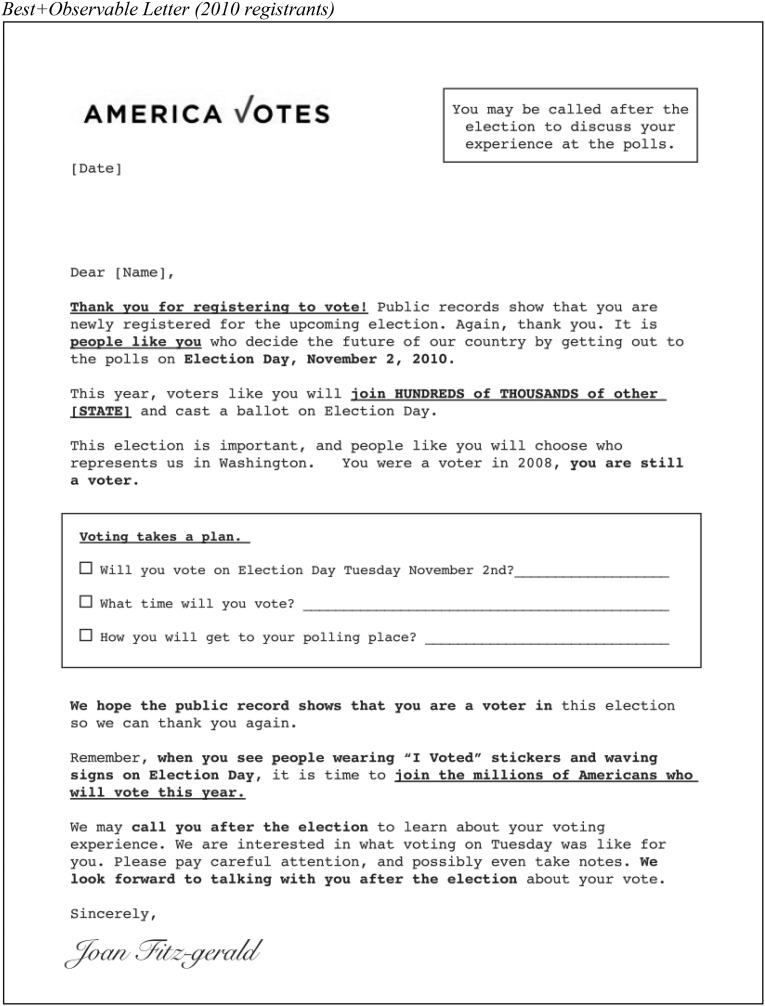
Fig. S1.
Full letters.
Table S1.
Balance check across demographics
| Treatment group | % Female | % Democrat | % African American | 2008 primary turnout | 2006 general turnout | Average age* |
| Control | 59.78% | 55.14% | 15.28% | 32.04% | 80.66% | 43.34 |
| (n = 76,963) | 46,008 | 42,437 | 11,760 | 24,659 | 62,078 | 76,498 |
| Nonobservable | 59.67% | 55.02% | 15.59% | 31.96% | 80.69% | 43.24 |
| (n = 346,929) | 207,013 | 190,880 | 54,086 | 110,879 | 279,937 | 344,874 |
| Observable | 59.72% | 55.09% | 15.55% | 32.10% | 80.69% | 43.29 |
| (n = 347,054) | 207,261 | 191,192 | 53,967 | 111,404 | 280,038 | 344,899 |
Multinomial logistic regression: LR chi2(12) = 8.96, P = 0.7063.
Age was missing for a small percentage of the observations.
Table S2.
Balance check across congressional districts
| District | Control | Best | Best plus observable | Total |
| AZ 5 | 3,076 | 13,879 | 13,906 | 30,861 |
| 3.82% | 3.83% | 3.83% | 3.83% | |
| CA 11 | 2,801 | 12,459 | 12,485 | 27,745 |
| 3.48% | 3.44% | 3.44% | 3.44% | |
| FL 22 | 3,489 | 16,233 | 16,230 | 35,952 |
| 4.34% | 4.48% | 4.47% | 4.46% | |
| IA 3 | 3,325 | 14,378 | 14,354 | 32,057 |
| 4.13% | 3.97% | 3.96% | 3.98% | |
| IL 10 | 2,524 | 11,322 | 11,309 | 25,155 |
| 3.14% | 3.12% | 3.12% | 3.12% | |
| IL 14 | 2,374 | 10,808 | 10,807 | 23,989 |
| 2.95% | 2.98% | 2.98% | 2.98% | |
| IL 17 | 2,339 | 10,713 | 10,744 | 23,796 |
| 2.91% | 2.95% | 2.96% | 2.95% | |
| IN 9 | 3,204 | 14,767 | 14,762 | 32,733 |
| 3.98% | 4.07% | 4.07% | 4.06% | |
| MA 10 | 3,506 | 15,642 | 15,662 | 34,810 |
| 4.36% | 4.31% | 4.32% | 4.32% | |
| MD 1 | 3,221 | 14,424 | 14,427 | 32,072 |
| 4.00% | 3.98% | 3.98% | 3.98% | |
| MI 7 | 2,349 | 10,244 | 10,247 | 22,840 |
| 2.92% | 2.83% | 2.83% | 2.83% | |
| MI 9 | 2,841 | 12,955 | 12,965 | 28,761 |
| 3.53% | 3.57% | 3.57% | 3.57% | |
| MN 1 | 3,662 | 16,599 | 16,622 | 36,883 |
| 4.55% | 4.58% | 4.58% | 4.58% | |
| NC 8 | 3,418 | 15,713 | 15,717 | 34,848 |
| 4.25% | 4.33% | 4.33% | 4.32% | |
| ND 1 | 1,294 | 5,805 | 5,783 | 12,882 |
| 1.61% | 1.60% | 1.59% | 1.60% | |
| NY 19 | 2,877 | 12,982 | 12,978 | 28,837 |
| 3.58% | 3.58% | 3.58% | 3.58% | |
| NY 23 | 1,699 | 7,835 | 7,827 | 17,361 |
| 2.11% | 2.16% | 2.16% | 2.15% | |
| NY 24 | 2,888 | 13,361 | 13,374 | 29,623 |
| 3.59% | 3.69% | 3.69% | 3.68% | |
| OH 15 | 4,235 | 19,019 | 19,035 | 42,289 |
| 5.26% | 5.25% | 5.25% | 5.25% | |
| OH 18 | 3,485 | 15,735 | 15,770 | 34,990 |
| 4.33% | 4.34% | 4.35% | 4.34% | |
| PA 10 | 2,932 | 13,307 | 13,304 | 29,543 |
| 3.64% | 3.67% | 3.67% | 3.67% | |
| PA 11 | 1,782 | 8,123 | 8,113 | 18,018 |
| 2.21% | 2.24% | 2.24% | 2.24% | |
| PA 12 | 1,676 | 7,378 | 7,372 | 16,426 |
| 2.08% | 2.03% | 2.03% | 2.04% | |
| PA 15 | 2,258 | 9,797 | 9,802 | 21,857 |
| 2.81% | 2.70% | 2.70% | 2.71% | |
| PA 3 | 2,068 | 9,461 | 9,473 | 21,002 |
| 2.57% | 2.61% | 2.61% | 2.61% | |
| PA 7 | 2,941 | 12,926 | 12,930 | 28,797 |
| 3.65% | 3.57% | 3.56% | 3.57% | |
| SD 1 | 3,192 | 14,325 | 14,317 | 31,834 |
| 3.97% | 3.95% | 3.95% | 3.95% | |
| WI 7 | 2,761 | 12,474 | 12,476 | 27,711 |
| 3.43% | 3.44% | 3.44% | 3.44% | |
| WI 8 | 2,252 | 9,907 | 9,925 | 22,084 |
| 2.80% | 2.73% | 2.74% | 2.74% | |
| Did not vote in 2008 | 16,048 | 72,314 | 72,359 | 160,721 |
| 19.94% | 19.94% | 19.95% | 19.95% | |
| Voted in 2008 | 64,421 | 290,257 | 290,357 | 645,035 |
| 80.06% | 80.06% | 80.05% | 80.05% | |
| Total | 80,469 | 362,571 | 362,716 | 805,756 |
LR chi2(58) = 25.91; Pr = 1.000.
Fig. 1.
Treatment letters.
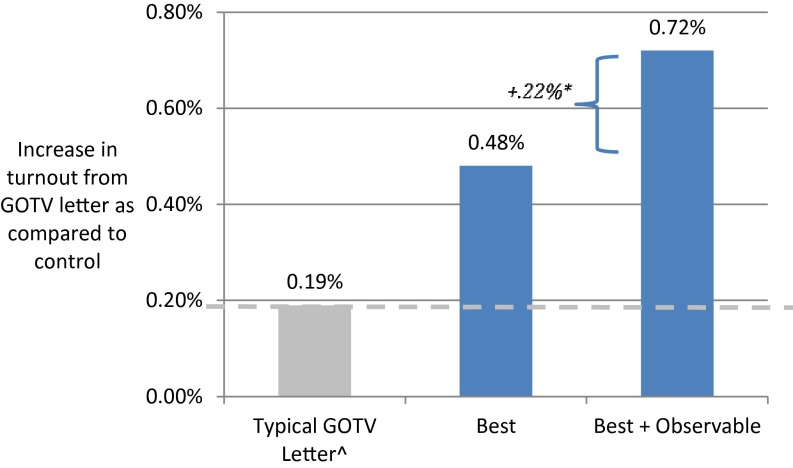
The outcome measure of interest is voter turnout. Those assigned to the Best condition voted at meaningfully higher rates than those assigned to control (41.36% vs. 40.88%, z = 2.52, P = 0.012). All analyses control for preexperiment stratifications, although results hold without these controls. The GOTV letter sent to those in the Best condition increased turnout by 0.48 percentage points. Metaanalyses of 79 experiments examining the impact of typical nonpartisan GOTV letters show that the average treatment effect is 0.194 percentage points (29). This means that the GOTV letter sent to those in the Best condition was more than twice as effective as the typical GOTV letter [F(1,770915) = 2.37, P = 0.12]. As described in Methods, one reason this GOTV letter may have been especially potent is that it already contained several elements highlighting the observability of whether one votes. The content of the GOTV letter sent to those in the Best-plus-Observable condition amplified the suggested observability above and beyond what was suggested in the letter sent to those in the Best condition. At $0.34 per letter, the letter sent to those in the Best condition cost $71 per net vote.
The GOTV letter sent to those assigned to the Best-plus-Observable condition increased turnout by 0.72 percentage points compared with the control group (41.60% vs. 40.88%, z = 3.80, P < 0.001). This GOTV letter was more effective than that sent to those in the Best condition (41.60% vs. 41.36%, z = 2.13, P = 0.033). That is, adding observability to the already-effective GOTV letter sent to those in the Best condition increased the impact of the GOTV letter by 0.22 percentage points—a 51% improvement that is larger than the average impact of the typical GOTV letter. The GOTV letter sent to those in the Best-plus-Observable condition was more than three times as effective as the typical GOTV letter [F(1,770915) = 7.95, P < 0.01]. The GOTV letter sent to those in the Best-plus-Observable condition cost $47 per net vote—less than one-third of the $175 per net vote generated from the typical GOTV letter (29). See Fig. 2.
Fig. 2.
Adding observability to a GOTV letter increases impact more than the average impact of a typical GOTV letter. ^From metaanalysis of 79 randomized experiments of typical GOTV letters (29); turnout in the control group was 40.88%; *P < 0.05; Best and Best-plus-Observable bars represent comparison to this experiment’s control group, whereas typical GOTV letter bar represents comparison to control groups included in the metaanalysis.
Why does the prospect of a follow-up call increase voting? As with most studies of observability, we cannot rule out that people consciously responded to the intervention—that they deliberated on the benefits of voting and evaluated them as greater in the Best-plus-Observable condition. However, the fact that the future call was uncertain, and that if it did happen it would entail a conversation with a total stranger, suggests this is unlikely. Instead, it seems more plausible that the intervention acted on a nonconscious level, as in the eyespot studies (24, 25). For example, the prospect of a follow-up might have activated feelings of accountability (30) or served as a reminder of future social interactions in which voting might be discussed (e.g., mental simulation).
We also cannot rule out that factors not directly related to public goods contributed to the intervention’s success. In particular, the intervention might motivate one to vote simply to avoid disappointing or confronting a concerned party. Or people may vote to avoid the unpleasant experience of having to lie—to claim that one voted when one did not (31). If so, the intervention may work in additional settings. For example, a counselor or advisor may be able to motivate students to follow through on their assignments and studying by scheduling weekly meetings.
We speculate that repeated attempts to increase people’s perceptions of observability by suggesting the prospect of a follow-up contact will become decreasingly effective if follow-up contacts are not made. The intervention will lose credibility, and so it will not heighten perceptions of the reputation consequences of contributing. Therefore, we suggest that this intervention will be most effective when the chance of follow-up is credible (e.g., because a follow-up survey or in-person interaction is already planned).
Our study makes three contributions. The first is practical. Many solicitations for contributions are made privately—for example, by mail, over email, or by posting on social media platforms such as Facebook and Twitter. These account for a large portion of fundraising: direct mail fundraising accounts for roughly 20% of all charitable donations, and online fundraising accounts for another 7% and is rapidly growing (32). Candidates and political groups regularly encourage constituents to vote using these same private communications media. Thus, for many practitioners, our results provide a practical, inexpensive, and effective strategy for increasing observability when soliciting public goods contributions via private communication.
Second, our results add to the field evidence that public goods contributions can be increased by making contributions more observable—even by merely suggesting that there may be magnified observability. Finally, our results provide additional evidence that voting can be increased by interventions that might affect reputations (e.g., refs. 13 and 33–37).
Methods
The GOTV letters were sent from an independent 501(c)(4) organization that was likely unfamiliar to recipients, America Votes. America Votes selected the experiment universe based on three criteria using data provided by the political data vendor Catalist, LLC (38). First, individuals had to reside in 1 of 29 targeted battleground congressional districts chosen based on the organization’s political objectives and expectation that the elections would be close. Second, only one individual per household could be included. Third, using predictive models developed by Catalist, individuals had to be predicted to be politically “progressive” and to have a low-to-moderate propensity to vote in the 2010 General Election. This resulted in a population that was 60% female, 15% African American, and averaged 43 y of age. The experiment universe included 645,035 individuals who voted in the 2008 General Election and 160,721 individuals who did not vote in the 2008 General Election but who had registered to vote in the 2010 General Election. Before being randomly assigned to one of the three conditions, the experiment universe was stratified by whether individuals voted in the 2008 election, and by their congressional district.
The GOTV letters emphasized the descriptive social norm that many others would vote (33). They also reinforced the civic identity by highlighting that “people like you” will vote (36). Another messaging element in the GOTV letters involved a callout box in which targets were to write their voting plans, reflecting work on the power of implementation intentions on turnout and other health behaviors (34, 39). The GOTV letters also expressed gratitude for the targets’ past political actions, and a hope that public records would show that targets will have voted in the upcoming 2010 election (35). For those who had voted in the 2008 General Election, the letter thanked them for voting in 2008, and for those who had not voted in the 2008 General Election but had registered to vote in the 2010 General Election, it thanked them for registering. This was the only difference in the messaging content between those who had voted in 2008 and those who had not. Note that this GOTV letter already indicates to voters that their behavior is observable. This indication could mute any effect of adding an explicit suggestion that whether people vote may be observable.
Voter turnout data were collected by Catalist, LLC, from publicly reported administrative records. Turnout data were missing for one district, MA-10, which has been excluded from all analyses. We administered a survey to a subsample of targets 2 mo after the election, but it is not relevant to this manuscript. All analyses use logistic regression controlling for preexperiment strata: dummies for congressional districts, and 2008 vote history.
Acknowledgments
We thank America Votes, Analyst Institute, and Catalist, LLC, for collaboration and data.
Footnotes
The authors declare no conflict of interest.
This article is a PNAS Direct Submission.
Data deposition: The data and analysis code have been deposited in the Open Science Framework’s archive, https://osf.io/thxj5.
This article contains supporting information online at www.pnas.org/lookup/suppl/doi:10.1073/pnas.1524899113/-/DCSupplemental.
References
- 1.Rand DG, Yoeli E, Hoffman M. Harnessing reciprocity to promote cooperation and the provisioning of public goods. Policy Insights Behav Brain Sci. 2014;1(1):263–269. [Google Scholar]
- 2.Kraft-Todd GT, Norton MI, Rand DG. 2015 The selfishness of selfless people: Harnessing the theory of self-concept maintenance to increase charitable giving. Available at ssrn.com/abstract=2568869. Accessed April 3, 2016.
- 3.Andreoni J, Petrie R. Public goods experiments without confidentiality: A glimpse into fund-raising. J Public Econ. 2004;88:1605–1623. [Google Scholar]
- 4.List JA, Berrens RP, Bohara AK, Kerkvliet J. Examining the role of social isolation on stated preferences. Am Econ Rev. 2004;94:741–752. [Google Scholar]
- 5.Rege M, Telle K. The impact of social approval and framing on cooperation in public good situations. J Public Econ. 2004;88:1625–1644. [Google Scholar]
- 6.Tadelis S. 2007 The power of shame and the rationality of trust. Available at papers.ssrn.com/sol3/papers.cfm?abstract_id=1006169. Accessed April 3, 2016.
- 7.Andreoni J, Bernheim BD. Social image and the 50-50 norm: A theoretical and experimental analysis of audience effects. Econometrica. 2009;77:1607–1636. [Google Scholar]
- 8.Linardi S, McConnell MA. 2008 Volunteering and image concerns. Available at people.hss.caltech.edu/∼slinardi/papers/Volunteer_Jan08.pdf. Accessed April 3, 2016.
- 9.Jacquet J, Hauert C, Traulsen A, Milinski M. Shame and honour drive cooperation. Biol Lett. 2011;11:rsbl20110367. doi: 10.1098/rsbl.2011.0367. [DOI] [PMC free article] [PubMed] [Google Scholar]
- 10.Yoeli E, Hoffman M, Rand DG, Nowak MA. Powering up with indirect reciprocity in a large-scale field experiment. Proc Natl Acad Sci USA. 2013;110(Suppl 2):10424–10429. doi: 10.1073/pnas.1301210110. [DOI] [PMC free article] [PubMed] [Google Scholar]
- 11.Lacetera N, Macis M. Social image concerns and prosocial behavior: Field evidence from a nonlinear incentive scheme. J Econ Behav Organ. 2010;76:225–237. [Google Scholar]
- 12.Bandiera O, Barankay I, Rasul I. Social preferences and the response to incentives: Evidence from personnel data. Q J Econ. 2005;120:917–962. [Google Scholar]
- 13.Gerber AS, Green DP, Larimer CW. Social pressure and voter turnout: Evidence from a large-scale field experiment. Am Polit Sci Rev. 2008;102(01):33–48. [Google Scholar]
- 14.Glazer A, Konrad KA. A signaling explanation for charity. Am Econ Rev. 1996;86:1019–1028. [Google Scholar]
- 15.Gintis H, Smith EA, Bowles S. Costly signaling and cooperation. J Theor Biol. 2001;213(1):103–119. doi: 10.1006/jtbi.2001.2406. [DOI] [PubMed] [Google Scholar]
- 16.Milinski M, Semmann D, Krambeck H-J. Reputation helps solve the “tragedy of the commons.”. Nature. 2002;415(6870):424–426. doi: 10.1038/415424a. [DOI] [PubMed] [Google Scholar]
- 17.Panchanathan K, Boyd R. Indirect reciprocity can stabilize cooperation without the second-order free rider problem. Nature. 2004;432(7016):499–502. doi: 10.1038/nature02978. [DOI] [PubMed] [Google Scholar]
- 18.Nowak MA, Sigmund K. Evolution of indirect reciprocity. Nature. 2005;437(7063):1291–1298. doi: 10.1038/nature04131. [DOI] [PubMed] [Google Scholar]
- 19.Rand DG, Dreber A, Ellingsen T, Fudenberg D, Nowak MA. Positive interactions promote public cooperation. Science. 2009;325(5945):1272–1275. doi: 10.1126/science.1177418. [DOI] [PMC free article] [PubMed] [Google Scholar]
- 20.Balafoutas L, Nikiforakis N, Rockenbach B. Direct and indirect punishment among strangers in the field. Proc Natl Acad Sci USA. 2014;111(45):15924–15927. doi: 10.1073/pnas.1413170111. [DOI] [PMC free article] [PubMed] [Google Scholar]
- 21.McNamara JM, Doodson P. Reputation can enhance or suppress cooperation through positive feedback. Nat Commun. 2015;6:6134. doi: 10.1038/ncomms7134. [DOI] [PubMed] [Google Scholar]
- 22.Dana J, Cain DM, Dawes RM. What you don’t know won’t hurt me: Costly (but quiet) exit in dictator games. Organ Behav Hum Decis Process. 2006;100:193–201. [Google Scholar]
- 23.Cain DM, Dana J, Newman GE. Giving versus giving in. Acad Management Ann. 2014;8:505–533. [Google Scholar]
- 24.Haley KJ, Fessler DMT. Nobody’s watching? Evol Hum Behav. 2005;26:245–256. [Google Scholar]
- 25.Bateson M, Nettle D, Roberts G. Cues of being watched enhance cooperation in a real-world setting. Biol Lett. 2006;2(3):412–414. doi: 10.1098/rsbl.2006.0509. [DOI] [PMC free article] [PubMed] [Google Scholar]
- 26.Bear A, Rand DG. Intuition, deliberation, and the evolution of cooperation. Proc Natl Acad Sci USA. 2016;113(4):936–941. doi: 10.1073/pnas.1517780113. [DOI] [PMC free article] [PubMed] [Google Scholar]
- 27.Rand DG, et al. Social heuristics shape intuitive cooperation. Nat Commun. 2014;5:3677. doi: 10.1038/ncomms4677. [DOI] [PubMed] [Google Scholar]
- 28.Hoffman M, Yoeli E, Nowak MA. Cooperate without looking: Why we care what people think and not just what they do. Proc Natl Acad Sci USA. 2015;112(6):1727–1732. doi: 10.1073/pnas.1417904112. [DOI] [PMC free article] [PubMed] [Google Scholar]
- 29.Green DP, McGrath MC, Aronow PM. Field experiments and the study of voter turnout. J Elections Public Opin Parties. 2013;23:27–48. [Google Scholar]
- 30.Lerner JS, Tetlock PE. Accounting for the effects of accountability. Psychol Bull. 1999;125(2):255–275. doi: 10.1037/0033-2909.125.2.255. [DOI] [PubMed] [Google Scholar]
- 31.DellaVigna S, List JA, Malmendier U, Rao G. 2014 doi: 10.1093/qje/qjr050. Voting to tell others. National Bureau of Economic Research Working paper 19832. Available at www.nber.org/papers/w19832. [DOI] [PubMed]
- 32.MacLaughlin S. Charitable Giving Report: How Nonprofit Fundraising Performed in 2012. Blackbaud; Charleston, SC: 2013. pp. 1–19. [Google Scholar]
- 33.Gerber AS, Rogers T. Descriptive social norms and motivation to vote: Everybody’s voting and so should you. J Polit. 2009;71(01):178–191. [Google Scholar]
- 34.Nickerson DW, Rogers T. Do you have a voting plan?: Implementation intentions, voter turnout, and organic plan making. Psychol Sci. 2010;21(2):194–199. doi: 10.1177/0956797609359326. [DOI] [PubMed] [Google Scholar]
- 35.Panagopoulos C. Thank you for voting: Gratitude expression and voter mobilization. J Polit. 2011;73:707–717. [Google Scholar]
- 36.Bryan CJ, Walton GM, Rogers T, Dweck CS. Motivating voter turnout by invoking the self. Proc Natl Acad Sci USA. 2011;108(31):12653–12656. doi: 10.1073/pnas.1103343108. [DOI] [PMC free article] [PubMed] [Google Scholar]
- 37.Bond RM, et al. A 61-million-person experiment in social influence and political mobilization. Nature. 2012;489(7415):295–298. doi: 10.1038/nature11421. [DOI] [PMC free article] [PubMed] [Google Scholar]
- 38.Ansolabehere S, Hersh E. 2010. The Quality of Voter Registration Records: A State-by-State Analysis. Report, Caltech/MIT Voting Technology Project (California Institute of Technology, Pasadena, CA; Massachusetts Institute of Technology, Cambridge, MA)
- 39.Milkman KL, Beshears J, Choi JJ, Laibson D, Madrian BC. Using implementation intentions prompts to enhance influenza vaccination rates. Proc Natl Acad Sci USA. 2011;108(26):10415–10420. doi: 10.1073/pnas.1103170108. [DOI] [PMC free article] [PubMed] [Google Scholar]


