Significance
Dysregulated nuclear trafficking of oncoproteins contributes to cancer. Here, we study the trafficking of eukaryotic translation initiation factor 4E (eIF4E) in acute myeloid leukemia (AML), where eIF4E is highly elevated and accumulates in the nucleus. Nuclear eIF4E promotes export of networks of transcripts encoding oncoproteins. During clinical responses to eIF4E-targeted therapy in patients who have AML, the distribution of eIF4E becomes almost entirely cytoplasmic. At relapse, eIF4E is again mainly nuclear. Our studies provide a molecular understanding for eIF4E trafficking, through association with importin 8. We provide a molecular basis for importin 8 selectivity for certain forms of eIF4E and demonstrate the relevance of its nuclear localization to its oncogenic potential, thereby positioning the importin 8–eIF4E interaction as a novel therapeutic target.
Keywords: eIF4E, importin 8, nuclear import, m7G cap
Abstract
Regulation of nuclear-cytoplasmic trafficking of oncoproteins is critical for growth homeostasis. Dysregulated trafficking contributes to malignancy, whereas understanding the process can reveal unique therapeutic opportunities. Here, we focus on eukaryotic translation initiation factor 4E (eIF4E), a prooncogenic protein highly elevated in many cancers, including acute myeloid leukemia (AML). Typically, eIF4E is localized to both the nucleus and cytoplasm, where it acts in export and translation of specific methyl 7-guanosine (m7G)–capped mRNAs, respectively. Nuclear accumulation of eIF4E in patients who have AML is correlated with increased eIF4E-dependent export of transcripts encoding oncoproteins. The subcellular localization of eIF4E closely correlates with patients’ responses. During clinical responses to the m7G-cap competitor ribavirin, eIF4E is mainly cytoplasmic. At relapse, eIF4E reaccumulates in the nucleus, leading to elevated eIF4E-dependent mRNA export. We have identified importin 8 as a factor that directly imports eIF4E into the nucleus. We found that importin 8 is highly elevated in untreated patients with AML, leading to eIF4E nuclear accumulation. Importin 8 only imports cap-free eIF4E. Cap-dependent changes to the structure of eIF4E underpin this selectivity. Indeed, m7G cap analogs or ribavirin prevents nuclear entry of eIF4E, which mirrors the trafficking phenotypes observed in patients with AML. Our studies also suggest that nuclear entry is important for the prooncogenic activity of eIF4E, at least in this context. These findings position nuclear trafficking of eIF4E as a critical step in its regulation and position the importin 8–eIF4E complex as a novel therapeutic target.
Control of nuclear trafficking is critical for regulation of proliferation and survival. Here, we reveal a mechanism for the trafficking of the eukaryotic translation initiation factor 4E (eIF4E), which is elevated in an estimated 30% of cancers (1). In mice, eIF4E overexpression alone is sufficient to drive development of a variety of cancers (2). eIF4E acts in the nuclear export and translation of specific mRNAs (3, 4). In fact, eIF4E enhances the export of over 3,500 mRNAs, many of which encode oncoproteins (3, 5–7). In this way, eIF4E modulates gene expression through increasing cytoplasmic levels of transcripts via enhanced export and, in some cases, increasing the number of ribosomes associated with these transcripts in the cytoplasm. Although different elements in the target transcripts are required for the mRNA export or translation function of eIF4E, both require the methyl 7-guanosine (m7G) cap on the 5′ end of the mRNA. Several lines of evidence indicate that the mRNA export activity of eIF4E contributes to its oncogenic potential (5–8). Thus, understanding the mechanisms that underlie its nuclear-cytoplasmic trafficking is important.
eIF4E is not only elevated but also accumulates in the nucleus of some cancers, including subsets of acute myeloid leukemia (AML) and some lymphomas (8–10). AML is a highly aggressive malignancy with poor overall survival (11–13). For these cancer subtypes, the vast majority of eIF4E is found in the nucleus, correlating with highly elevated eIF4E-dependent mRNA export (9, 10, 14). Accordingly, eIF4E activity was targeted in two AML clinical trials using ribavirin, which acts as a cap competitor (9, 14). In these trials, ribavirin treatment impaired eIF4E activity in patients who had AML, which correlated with clinical responses, including some remissions. In vitro, eIF4E binds ribavirin under physiological solution conditions (15–18). In cell culture, ribavirin inhibits eIF4E activity, as observed by several groups (19–21). Indeed, cell growth is no longer inhibited by ribavirin in cells pretreated with RNAi to eIF4E (21).
eIF4E localization is altered by treatment with m7G cap analogs or ribavirin. Specifically, m7G cap and ribavirin lead to cytoplasmic enrichment and nuclear depletion of eIF4E in treated cell lines and patients (15, 22, 23). In patients, eIF4E relocalization to the cytoplasm correlates with clinical responses (9, 14). At relapse, eIF4E redistributes to the nucleus, correlating with a loss of the eIF4E–ribavirin interaction due to either ribavirin glucuronidation or impaired cellular uptake of ribavirin (14, 18). These clinical observations highlight the importance of identifying the molecular mechanisms that underpin eIF4E nuclear trafficking. However, there is no molecular understanding of this process. For instance, eIF4E lacks a classical nuclear localization signal (c-NLS) or a proline-tyrosine (PY)-NLS (24). Here, we identify importin 8 as a direct mediator of eIF4E nuclear import. Further, eIF4E nuclear entry is regulated by a competition between m7G cap and importin 8 binding. Our findings provide insights into the control of eIF4E activity through modulation of its subcellular localization.
Results
eIF4E Is an Importin 8 Cargo.
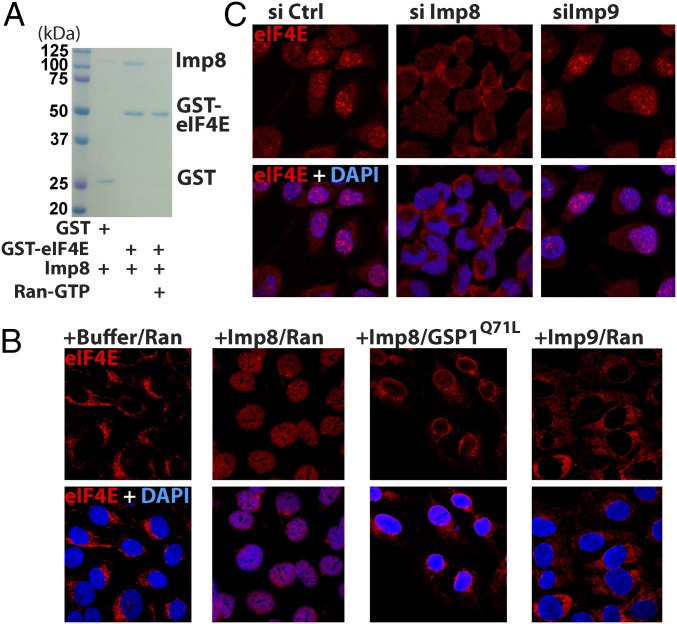
To elucidate mechanisms for its nuclear entry, we examined the ability of GST-eIF4E to bind a panel of import karyopherins (importins), including importins 4, 5, 7, 8, and 9; importin-α; and Kapβ2. All of these bacterially produced and purified importins are active because they all bind a form of yeast Ran•GTP (guanosine triphosphate) [Glutathione S-transferase (GST)-GSP1] with mutations and deletions (GST-GSP1 1–179, Q71L) that stabilize the GTP-bound state (25) (Fig. S1A). Of the importins tested, only importin 8 bound eIF4E (Fig. 1A and Fig. S1B). We observed that excess human wild-type Ran•GTP released importin 8 from its eIF4E cargo (Fig. 1A) a feature common to importin–cargo interactions (26). Thus, eIF4E is a potential cargo for importin 8.
Fig. S1.
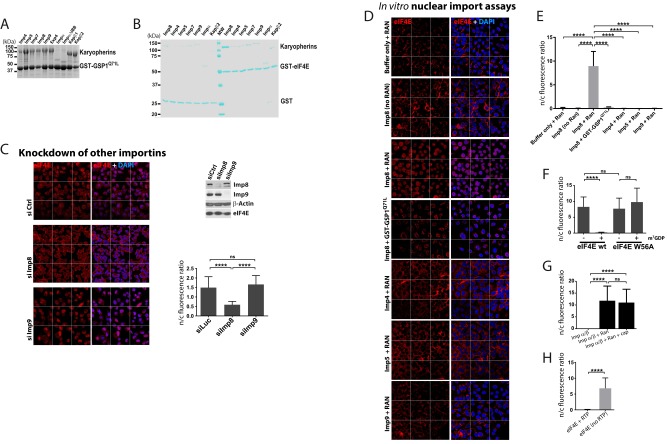
GST pull-down and in vitro nuclear import assays monitoring multiple karyopherins. (A) Activity of each karyopherin used in this study was verified by GST-GSP1 pull-down and visualized by Coomassie Blue (details are provided in SI Materials and Methods). (B) Direct interactions between different importins and eIF4E were examined by GST pull-down assay. The protein bands were visualized by Coomassie Blue staining after SDS/PAGE. The strongest target by far is importin 8 (Imp8). (C) Effects of knockdown of indicated importins on eIF4E localization in intact U2OS cells were investigated. Cells were stained with eIF4E antibody and DAPI as a nuclear marker. RNAi control or knockdown of given importins was tested as indicated. (Top right) Western blot analysis confirmed knockdown and that there were no effects on eIF4E levels. (Bottom right) Quantification is shown. (D) In vitro nuclear import assays using purified GST-eIF4E in digitonin-permeabilized U2OS cells in buffer (including transport cofactors, such as GTP, etc.) in the presence of importin 8 under various conditions and in the presence of other importins. For both C and D, confocal micrographs were single sections through the plane of the cells with a magnification of 63×. The confocal microscope collected nine fields (“tiles”) simultaneously and automatically reassembles these tiles to give a larger field. The grid depicts the borders for these tiles. Quantifications for confocal images are shown for Fig. S1D (E) and for Fig. 4 H (F) and G (G) and 5B (H). ****P < 0.0001. ns, not significant.
Fig. 1.
eIF4E is an importin 8 cargo. (A) GST pull-down assay for importin 8 and eIF4E-GST visualized by Coomassie Blue staining. (B) In vitro nuclear import assays using purified GST-eIF4E in digitonin-permeabilized U2OS cells as shown. Additional experiments and quantitations are shown in Fig. S1 D and E. (C) Confocal micrographs monitoring endogenous eIF4E localization as a function of importin 8 knockdown (si Imp8) and importin 9 knockdown (si Imp9) versus control (si Ctrl). Western blots confirm knockdown with no effect on eIF4E levels in Figs. S1C and S3H. Each confocal micrograph is a single section through the plane of the cell with a magnification of 63× and no digital zoom.
We carried out in vitro nuclear import assays (27) to establish whether the importin 8–eIF4E interaction was functional (Fig. 1B and Fig. S1 C–E). Import of GST-eIF4E was monitored in permeabilized U2OS cells using immunofluorescence in conjunction with confocal laser microscopy. Nuclear import of eIF4E was quantified using standard procedures (Fig. S1E). We used a GST antibody to detect exogenous eIF4E specifically. Import assays were performed using a buffer with a mixture of cofactors required for karyopherin-dependent nuclear import (Materials and Methods). In the presence of this buffer, GST-eIF4E remained in the cytoplasm, whereas addition of importin 8 led to its nuclear entry (Fig. 1B and Fig. S1E). GST-GSP1 addition impaired importin 8-mediated entry of eIF4E (Fig. 1B and Fig. S1E). Similarly, eIF4E did not enter the nucleus in the absence of wild-type human Ran (Fig. S1 D and E). Thus, importin 8 imports eIF4E into the nucleus in vitro in a Ran-dependent fashion.
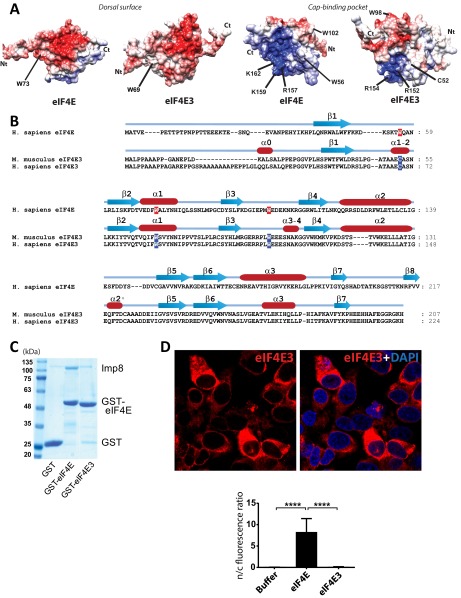
Consistent with our above GST pull-down assays, addition of purified importins that did not bind eIF4E-GST (e.g., importins 4, 5, 9) did not import eIF4E into the nucleus (Fig. 1B and Fig. S1 D and E). Further, we tested if another member of the eIF4E family, eIF4E3, was also a cargo. eIF4E3 was examined because it has a similar overall fold to eIF4E but a different charge distribution (28). Importantly, eIF4E3 was neither imported by nor bound to importin 8 (Fig. S2). Thus, the effects of importin 8 are not generalizable to the eIF4E family, and, similarly, not all importins import eIF4E.
Fig. S2.
eIF4E3 is not an importin 8 cargo. (A) Comparison of the surface charge distribution on the dorsal surface (Left) and cap-binding pocket (Right) of eIF4E and eIF4E3 in their apo form (PDB codes 2GPQ and 4B6V, respectively) (28, 30). Key residues are displayed. (B) Sequence alignment of human eIF4E and mouse eIF4E3, which differ by only six residues within the folded portion. Secondary structure elements are also shown. (C) GST pull-down assay using GST-eIF4E or GST-eIF4E3 as bait protein and importin 8 as prey. Clearly, importin 8 does not bind to eIF4E3 over the GST background. (D) In vitro nuclear import assays with GST-eIF4E3 demonstrated no nuclear entry upon addition of importin 8 compared with eIF4E (Fig. 1B). Confocal micrographs were single sections through the plane of the cells with a magnification of 63×. (Bottom) Quantification is shown. ****P < 0.0001.
Next, we assessed the role of importin 8 in eIF4E import in U2OS cells. Note that in intact cells, eIF4E forms nuclear bodies as well as being present in the nucleoplasm and cytoplasm (5, 7, 23). Levels of nuclear eIF4E are unchanged in importin 9 knockdown cells relative to controls (Fig. 1C and Fig. S1C). However, importin 8 knockdown reduced nuclear levels by threefold without altering eIF4E protein levels (Fig. 1C and Fig. S1C). The knockdowns of importin 8 and importin 9 were validated by Western blot (Fig. S1C). In summary, importin 8 mediates eIF4E nuclear entry in vitro and in intact cells.
Importin 8 Affects eIF4E-Dependent mRNA Export.
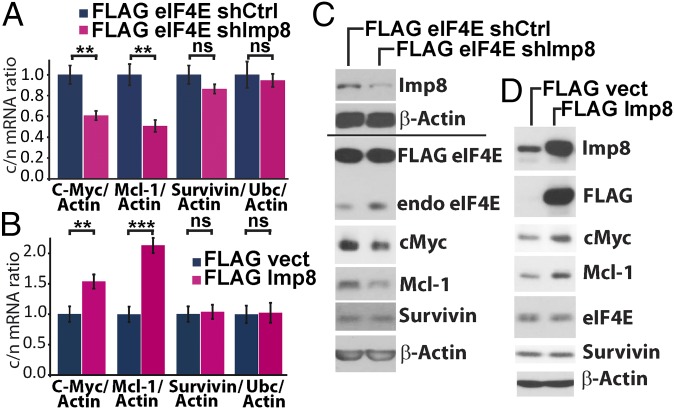
We examined whether modulating nuclear entry of eIF4E has an impact on its mRNA export activity. To assess this effect, cells were fractionated into nuclear and cytoplasmic components and mRNA levels in each fraction were examined using quantitative PCR (qPCR) (Fig. 2A). Fractionation quality was assessed using U6snRNA and tRNAlys for nuclear and cytoplasmic fractions, respectively (Fig. S3C, Top). Importantly, importin 8 knockdown, and thus cytoplasmic retention of eIF4E, led to nuclear accumulation of endogenous eIF4E mRNA export targets, such as c-Myc and Mcl-1, without altering their total mRNA levels (Fig. 2A and Fig. S3D, Top). Concomitantly, c-Myc and Mcl-1 protein levels were reduced, consistent with their lowered mRNA export (Fig. 2C). Importin 8 knockdown did not affect eIF4E protein levels or mRNA export of negative controls, such as survivin and β-actin. As a specificity control, we examined the effects of importin 9 knockdown (Fig. S3 E–H). In contrast to importin 8, importin 9 knockdown did not impair eIF4E-dependent mRNA export or reduce protein levels of eIF4E targets. Interestingly, importin 9 knockdown led to cell death, where we postulate increased Mcl-1 levels were a compensatory mechanism unrelated to mRNA export. Thus, reduction in importin 8 specifically impairs eIF4E-dependent mRNA export through inhibition of eIF4E nuclear entry.
Fig. 2.
eIF4E nuclear trafficking affects its mRNA export activity. Effects of importin 8 (Imp8) knockdown on target mRNA export (A) and protein levels (C) in eIF4E-overexpressing (FLAG eIF4E) cells. Short hairpin control (shCtrl) indicates RNAi control, and c/n indicates the cytoplasmic-to-nuclear ratio. The c/n of tested mRNAs is shown. Results for endogenous eIF4E (endo eIF4E) upon importin 8 knockdown are shown in Fig. S3 A and B. Effects of importin 8 overexpression in the presence of endogenous eIF4E at the mRNA export (B) and protein levels (D) relative to vector controls (FLAG vect). Total mRNAs levels are unchanged (Fig. S3D), and fractionation controls are shown in Fig. S3C. Data are the mean ± SD. **P < 0.01; ***P < 0.001. ns, not significant.
Fig. S3.
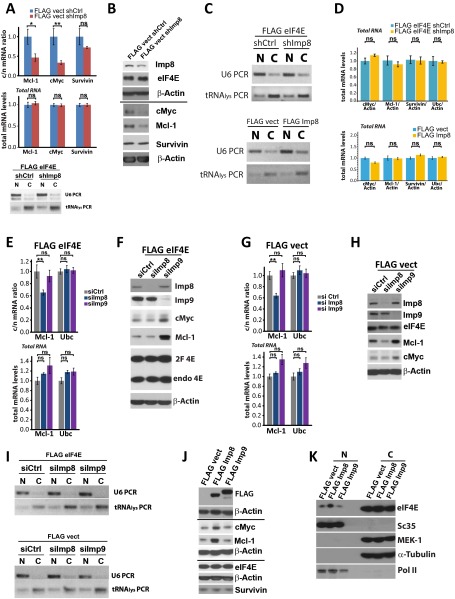
Effects of importins on the nuclear export activity of eIF4E. (A) Importin 8 knockdown (shImp8) in cells with endogenous levels of eIF4E (FLAG vector cells) reduces the mRNA export of eIF4E target mRNAs, but not negative controls (Top), with no changes to total mRNA levels (Middle). (Bottom) Cytoplasmic-to-nuclear ratio (c/n) of mRNA was obtained using fractionation and qPCR for the indicated mRNAs. For fractionation controls, we monitored U6snRNA for the nucleus, and tRNA lysine for the cytoplasm. N and C indicate nuclear and cytoplasmic fractions, respectively. (B) Consistently, importin 8 knockdown leads to reduced protein levels of eIF4E mRNA export targets but not eIF4E or negative controls, such as survivin and β-actin. (C) Fractionation controls for mRNA export assays in Fig. 2. (D) Total mRNA levels (Fig. 2) did not change upon knockdown or overexpression of importin 8. (E) mRNA export assays (Top) and total mRNA levels (Bottom) on indicated RNAs upon siRNA knockdown of importin 8 or importin 9 in the presence of overexpressed eIF4E (FLAG eIF4E). (F) Western blot analysis indicating eIF4E export targets were reduced by importin 8 knockdown in eIF4E-overexpressing cells but not by importin 9 compared with control knockdowns in the presence of eIF4E overexpression. (G and H) As in E and F, but in the vector control (FLAG vect) cells, where the effects on endogenous eIF4E can be monitored. Similarly, knockdown of importin 8 affects mRNA export and protein production of targets, but not importin 9. In E–H , it is demonstrated that importin 8 modulates the effects of both exogenous and endogenous eIF4E. (I) Fractionation controls for E and G. U6snRNA is a marker for the nucleus, and tRNA lysine is a marker for the cytoplasm. (J) Western blot demonstrating that importin 9 overexpression does not increase levels of eIF4E target RNAs, consistent with its inability to bind or import eIF4E (Fig. S1 B and D). (K) Fractionation analysis of importin 8-overexpressing cells demonstrating that eIF4E is more nuclear upon importin 8 overexpression relative to vector or importin 9-overexpressing cells. α-Tubulin and MEK-1 are fractionation controls for the cytoplasm, and Sc35 and Pol II are fractionation controls for the nucleus.
Conversely, importin 8 overexpression stimulated eIF4E-dependent mRNA export of Mcl-1 and c-Myc mRNAs, but not negative controls (e.g., survivin, ubiquitin) (Fig. 2 B and Fig. S3D, Bottom). This increased export corresponded to elevated c-Myc and Mcl-1 protein levels. In contrast, importin 9 overexpression did not alter the levels of eIF4E targets (Fig. S3J). Consistently, importin 8 overexpression led to increased levels of nuclear eIF4E (Fig. S3K). Thus, importin 8 promotes eIF4E-dependent mRNA export activity by promoting its reentry into the nucleus, a prerequisite for its export activity.
The Transformation Activity of eIF4E Is Related to Its Nuclear Localization.
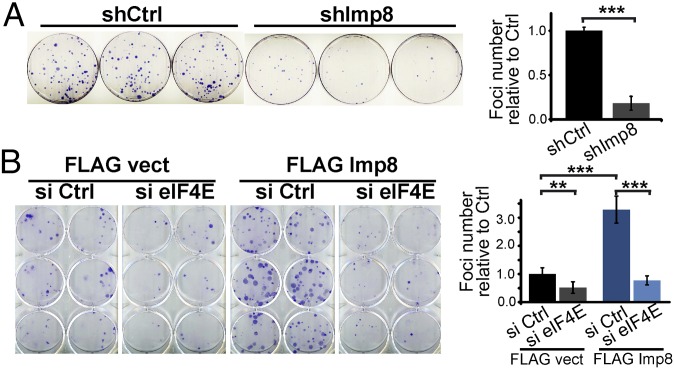
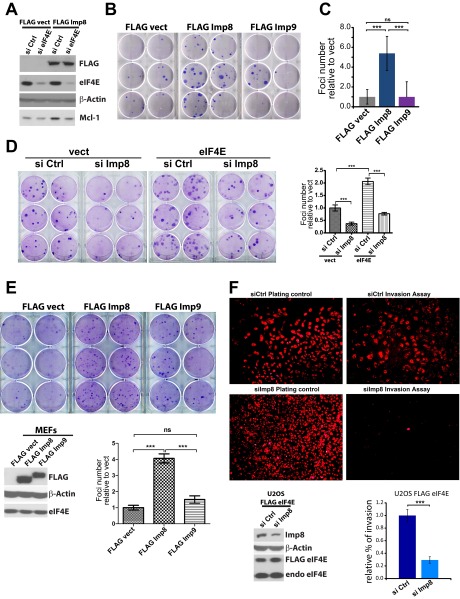
Given the close ties between eIF4E-dependent mRNA export and its oncogenic potential (6, 7), we monitored the relevance of increased nuclear eIF4E trafficking to this activity (Fig. 3A). We measured loss of contact inhibition using an anchorage-dependent foci formation assay as a function of modulating eIF4E localization using either U2OS cells or immortalized, but not transformed, fibroblasts (Fig. 3 and Fig. S4 A–E). First, we found that in eIF4E-overexpressing cells, importin 8 knockdown reduces foci number by about fivefold relative to RNAi controls in U2OS cells and approximately threefold effects in mouse embryonic fibroblasts (Fig. 3A and Fig. S4D). Western blots confirm importin 8 knockdown and no change to eIF4E levels (Fig. 2C). These observations suggest that lower levels of nuclear eIF4E reduced its prooncogenic activity. Conversely, importin 8 overexpression led to an over threefold increase of foci number relative to vector in U2OS cells and to an approximately fourfold increase in fibroblasts (Fig. 3B and Fig. S4E). Further, RNAi knockdown of eIF4E in importin 8-overexpressing cells completely impaired the foci formation activity of importin 8 (Fig. 3B). Importantly, eIF4E knockdown did not alter the levels of the importin 8-FLAG construct (Fig. S4A). Finally, importin 9 overexpression did not modulate the number of foci relative to vector (Fig. S4 B, C, and E); thus, this transformation activity is not universal for all importins. We also examined the relevance of nuclear entry to the invasion activity of eIF4E in Matrigel assays (Fig. S4F). Importin 8 knockdown reduced eIF4E-mediated invasion by approximately threefold relative to RNAi controls in U2OS cells. Taken together, these findings suggest that its nuclear localization increased the foci formation and invasion activities of eIF4E.
Fig. 3.
Importin 8 transformation activity is eIF4E-dependent. Foci assays in U2OS cells as a function of importin 8 shRNA knockdown (A, shImp8) or importin 8 overexpression (B, FLAG Imp8). shCtrl and FLAG vect indicate corresponding controls. (Right) Foci numbers relative to controls are quantified. Data are the mean ± SD. **P < 0.01; ***P < 0.001. Western blots for FLAG Imp8 and eIF4E expression are shown in Fig. S4A.
Fig. S4.
Importin 8 effects are specific. (A) Western blot analysis showing eIF4E knockdown with no change to FLAG Imp8 expression (Fig. 3B). (B) Foci formation assays in U2OS cells show that overexpression of importin 8 (FLAG Imp8) leads to transformation, whereas overexpression of importin 9 (FLAG Imp9) has no effect relative to the vector (FLAG vect) controls. (C) Foci number relative to vector controls reporting mean and SD. (D) Foci formation assays in mouse embryonic fibroblasts (MEFs) overexpressing eIF4E or vector controls as a function of siRNA knockdown of importin 8. (E) Foci formation assays in MEFs overexpressing importin 8 (Imp8) or importin 9 (Imp 9). Western blot confirms overexpression and no effect on eIF4E. (F) Invasion assays in U2OS cells overexpressing eIF4E with control or importin 8 siRNAs. Plating controls are also shown. Images were collected by inverted fluorescence microscope using objective 10×. Western blot confirms knockdown of Imp 8 with no effect on eIF4E. Bar graphs show quantification with the mean ± SD. ***P < 0.001.
Effects of Adding an NLS to eIF4E.
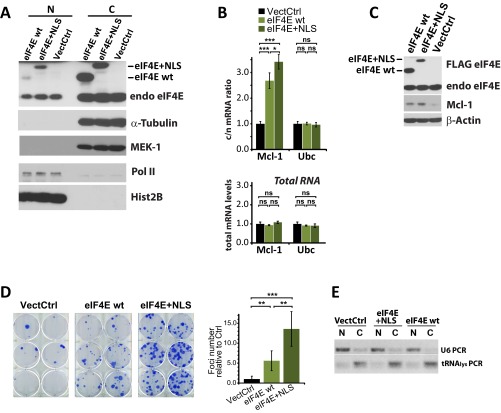
Given these findings, we assessed the effects of the addition of a c-NLS to eIF4E (29). The eIF4E+NLS protein is more nuclear than wild-type protein but still retains substantial cytoplasmic localization, suggesting it is associated with a strong nuclear export signal, as we observed previously (Fig. S5A). This observation also suggests that eIF4E+NLS still transits between compartments but likely with a reduced cytoplasmic dwell time due to faster cycling into the nucleus. Overexpression of eIF4E+NLS led to increased eIF4E-dependent mRNA export as well as increased levels of the corresponding proteins relative to wild-type eIF4E or vector controls (Fig. S5 B and C). Further, eIF4E+NLS expression yielded over twofold more foci than wild-type eIF4E and over 13-fold more than vector controls (Fig. S5D). We note that eIF4E+NLS levels were consistently lower than levels for wild-type protein, likely leading to an underestimation of its effects on mRNA export and transformation. Together, these studies suggest that increased nuclear trafficking of eIF4E via an NLS or by importin 8 overexpression increases its oncogenic potential.
Fig. S5.
Effects of the addition of an NLS on eIF4E. (A) Fractionation analysis indicates that the eIF4E+NLS had increased nuclear levels relative to wild-type eIF4E (eIF4E wt). N and C indicate nuclear and cytoplasmic fractions, respectively. Tubulin and MEK-1 are fractionation controls for the cytoplasm, and Pol II and Hist2B (histone 2B) are fractionation controls for the nucleus. Note that eIF4E+NLS is expressed at lower levels than wild-type eIF4E (C). We note that confocal microscopy indicates there is more nuclear eIF4E than fractionation methods. These findings are similar to the findings by Lejbkowicz et al. (4), where eIF4E was more nuclear by confocal microscopy relative to fractionation results. There is an impression of less cytoplasmic eIF4E because it is distributed throughout the cytoplasm, as was quantified by Lejbkowicz et al. (4), but this observation did not completely account for the observed differences. This finding is true using many different antibodies, fixation conditions, etc. As suggested by Lejbkowicz et al. (4), it seems possible that eIF4E is released during the fractionation process (despite the fractionation controls indicating the fractions are intact), leading to an underestimation of the amount of nuclear eIF4E by this method. Under these circumstances, microscopy appears a more reliable method to assess the subcellular distribution of eIF4E. (B) mRNA export assays indicate that eIF4E+NLS increases export over wild type but only modestly, likely because of its reduced overall expression (C). (C) Western blot analysis indicates that eIF4E mRNA export targets are elevated in eIF4E+NLS relative to vector controls and wild-type eIF4E. Actin is provided as a loading control. (D) Anchorage-dependent foci assays for vector controls (VectCtrl), eIF4E wt, or eIF4E+NLS. Results are the foci number relative to vector controls reporting the mean and SD. (E) Fractionation controls for B. U6snRNA is a marker for the nucleus, and tRNA lysine is a marker for the cytoplasm. *P < 0.05; **P < 0.01; ***P < 0.001.
Molecular Basis of the Importin 8–eIF4E Interaction.
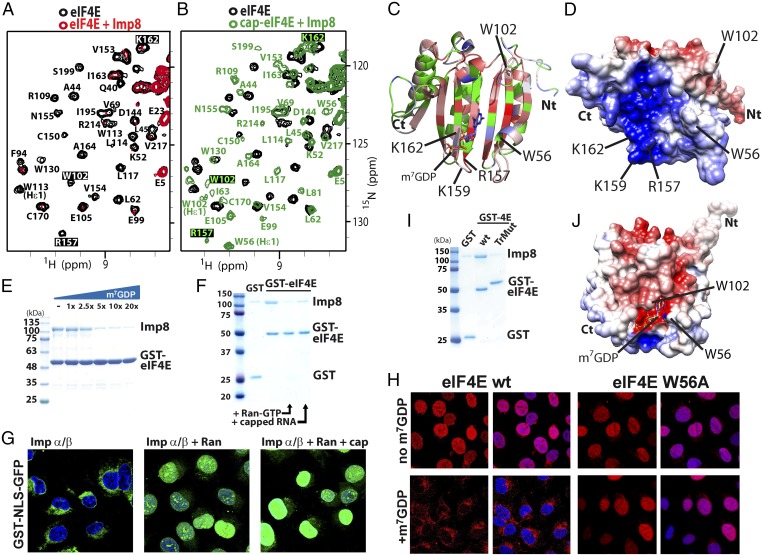
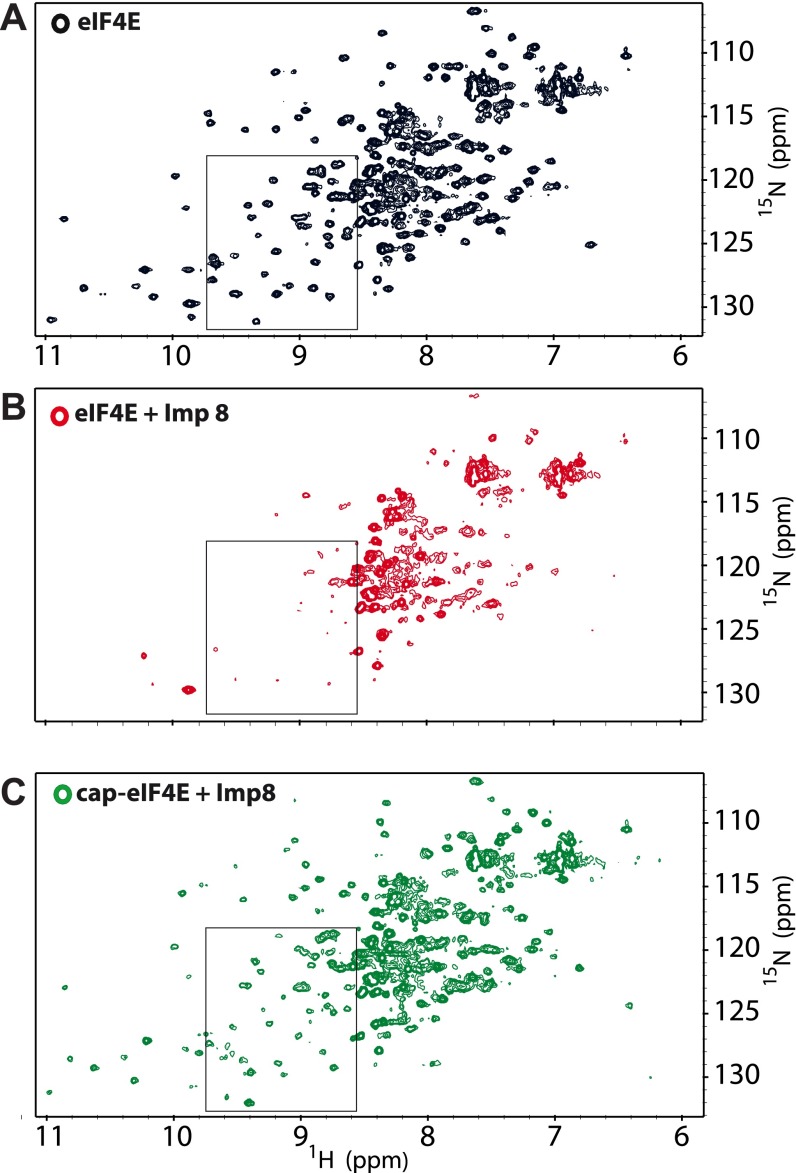
We used NMR methods to determine the molecular basis for the importin 8–eIF4E interaction. We monitored the 1H-15N HSQC (heteronuclear single quantum coherence) spectra of 15N-labeled eIF4E as a function of importin 8 addition. We observed extensive signal broadening for eIF4E resonances (Fig. 4A and Fig. S6 A and B), which occurred because of the slower tumbling of the eIF4E–importin 8 complex (145 kDa) compared with eIF4E (25 kDa). Residues in the structured region of eIF4E (26–217) were affected even at low molar ratios of importin 8 to eIF4E (e.g., at 0.03125:1), consistent with an estimated off-rate of ∼100 s−1 and a Kd in the low micromolar range (assuming diffusion limited on-rates). In contrast, the flexible N terminus of eIF4E is visible even at twofold excess importin 8, indicating that this region is not involved in binding (Fig. S6B).
Fig. 4.
Importin 8 binding to eIF4E is sensitive to m7G cap addition. 1H-15N HSQC spectra of eIF4E (black) upon addition of twofold molar excess unlabeled importin 8 (A, red), or subsequent addition of 20-fold molar excess m7GDP cap (B, green). Assignments are shown for the backbone HN and the Trp indoles Hε1. The full HSQC spectra are shown in Fig. S6. (C) Changes in cross-peak intensities are mapped onto the apo-eIF4E structure [Protein Data Bank (PDB) ID code 2GPQ] (30). Residues are color-coded according to intensity changes of the cross-peaks based on a color ramp ranging from blue (no change), to white (medium change), to red (largest change) at a molar ratio for eIF4E/importin 8 of 1:0.25. Overlapping or unassigned residues are green. Key cap-binding residues are shown, and the m7GDP cap is depicted with lines, according to the cap-bound eIF4E structure (PDB ID code 3AM7). For clarity, only the structured region is shown, residues 26–217. (D) Electrostatic surface representation of apo-eIF4E (same orientation as in C). Acidic (negatively charged) and basic (positively charged) regions are in red and blue, respectively. Effect of increasing concentration of the m7GDP cap (one- to 20-fold) (E) and twofold molar excess m7G-capped RNA (F) on the association of importin 8 to GST-eIF4E by GST pull-down assay. (G) Import assay with GST-NLS-GFP in the presence of importin α/β2, Ran, or 50 μM m7G cap as indicated. DAPI is in blue. (H) In vitro nuclear import assays for eIF4E wild type (Left) and cap-binding mutant W56A (Right) ± 50 μM m7GDP cap analog (eIF4E in red and DAPI in blue). (I) GST pull-down assay with eIF4E-GST or eIF4E-TrMut-GST. (J) Surface charge distribution within the cap-binding pocket of m7GDP-bound eIF4E (PDB ID code 3AM7). Key residues and the m7GDP cap are shown. (Magnification: G and H, 63× with no additional zoom.) Quantitations for confocal images are shown in Fig. S1 F and G.
Fig. S6.
Effect of the m7GDP cap analog on the eIF4E–importin 8 complex studied by NMR spectroscopy. 1H-15N HSQC spectra of eIF4E free (A) in the presence of twofold molar excess importin 8, without (B) and additionally with excess (20-fold) m7GDP cap analog (C). Boxes represent the sections of the HSQC spectra shown in Fig. 4 A and B.
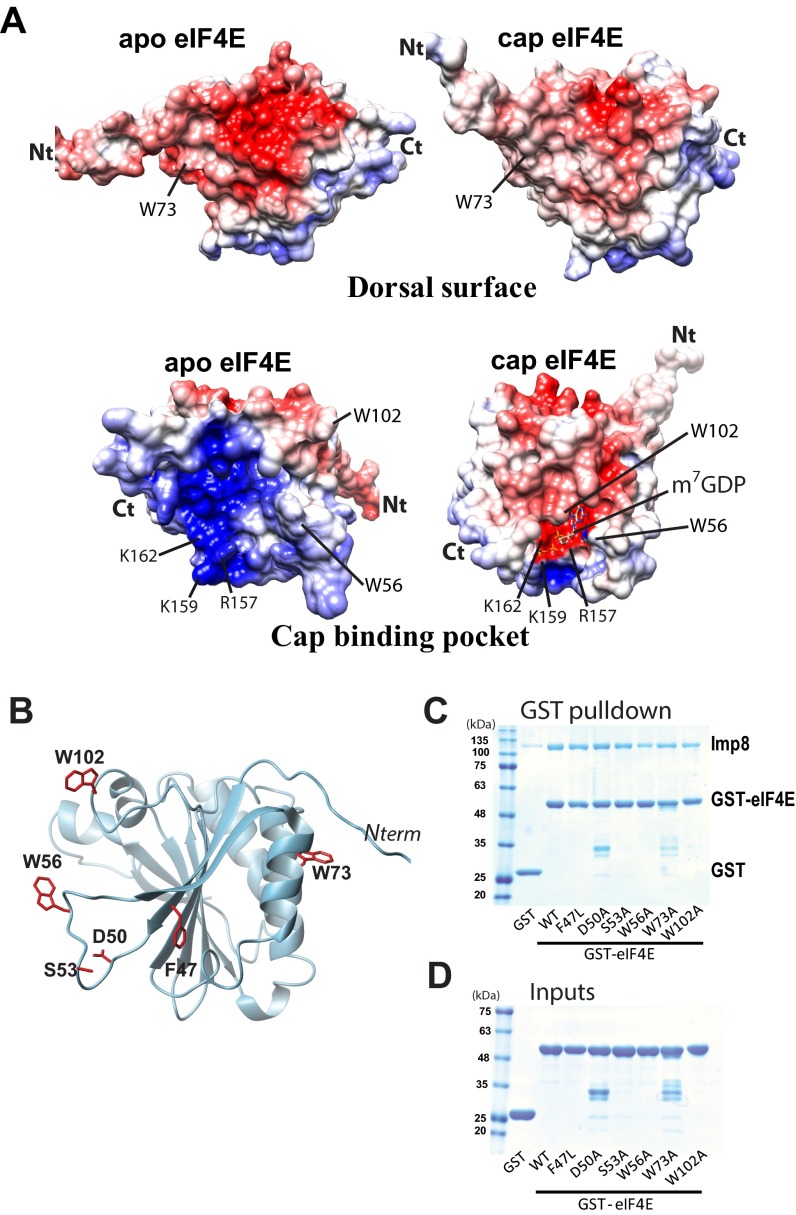
Our HSQC analysis indicated that regions in and around the cap-binding site were likely directly involved in the importin 8 interaction (Fig. 4C). The m7G cap-binding site can be roughly divided into two regions: (i) residues W56 and W102, which bind the m7G moiety of the cap (1, 30), and (ii) residues R157, K159, and K162, which form a positively charged patch to bind the phosphate moieties of the cap (1, 31) (Fig. 4D and Fig. S7A). Analysis of intensity changes of eIF4E upon importin 8 addition revealed that the most affected residues were generally located around this positively charged patch, with minor affects distributed throughout the structure (Fig. 4C).
Fig. S7.
eIF4E-binding surface for importin 8. (A) Comparison of the surface charge distribution on the dorsal surface (Top) and cap-binding pocket (Bottom) of apo- and cap-bound forms of eIF4E (PDB ID codes 2GPQ and 3AM7, respectively). Key residues used for recognition with ligands and partners are also shown. Acidic (negatively charged) and basic (positively charged) regions are in red and blue, respectively. (B–D) We examined the ability of mutants with known functions (cap-binding, dorsal surface recognition, etc.) to bind importin 8. Each mutant (displayed in B) was subjected to GST pull-down assay (C). (D) Inputs for GST and GST-tagged eIF4E (WT and mutants) are shown. Ct, C terminus; Nt, N terminus.
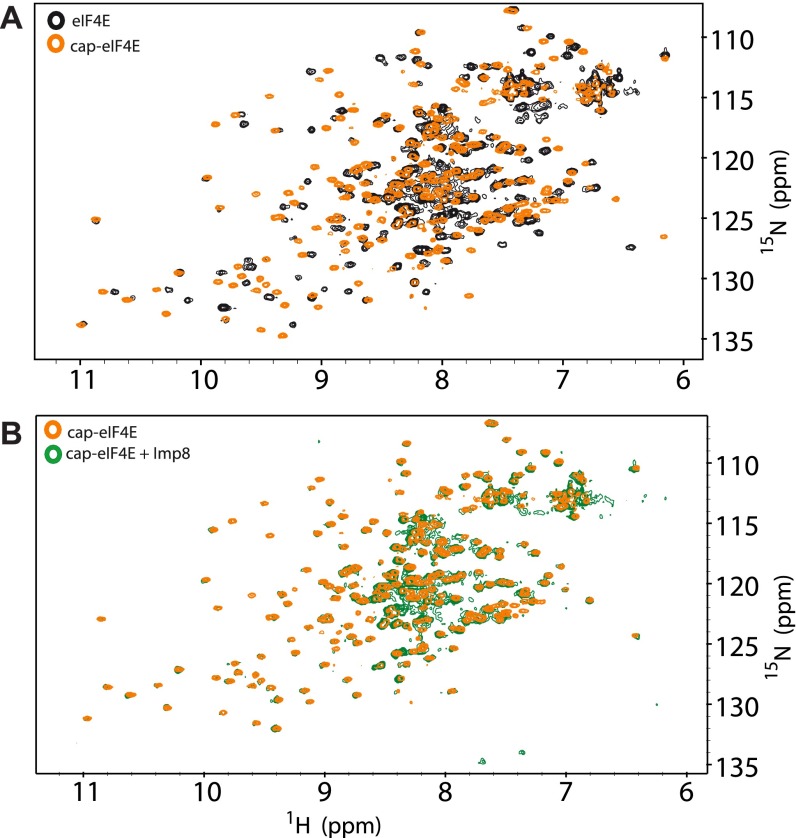
Given that our NMR data pointed to the cap-binding site as a key part of the interaction surface of eIF4E, we assessed whether importin 8 also associated with cap-bound forms of eIF4E. Note that our above GST pull-down and NMR experiments used apo-eIF4E. Strikingly, we observed that addition of a m7G cap analog (m7GDP) to a preformed complex of 15N-labeled eIF4E and unlabeled importin 8 led to reappearance of resonances in the HSQC for eIF4E, but now in cap-bound positions (Fig. 4 A vs. B and Figs. S6C and S8). Thus, addition of the m7G cap analog substantially reduced the affinity of eIF4E for importin 8. We confirmed this observation using a GST pull-down assay, where the eIF4E–importin 8 complex dissembled upon addition of excess m7GDP (Fig. 4E). We also found that addition of m7G-capped mRNA, which better reflects the in vivo ligand, reduced importin 8 binding to eIF4E (Fig. 4F). Thus, excess m7G-capped RNA or m7G cap analog prevents direct binding of eIF4E to importin 8.
Fig. S8.
Effect of the m7GDP cap analog on the eIF4E–importin 8 complex studied by NMR spectroscopy. 1H-15N HSQC spectra of eIF4E in the presence or absence of excess m7GDP cap (20-fold) (A) and m7GDP cap-eIF4E with or without a twofold molar ratio of importin 8 (B).
These findings led us to investigate whether cap binding altered the nuclear import of eIF4E. Indeed, the presence of excess m7G cap analog severely impaired eIF4E nuclear entry by over 50-fold (Fig. 4H and Fig. S1F), presumably by disrupting the eIF4E–importin 8 complex, consistent with our NMR and pull-down studies. Importantly, m7G cap addition did not impair entry of the eIF4E W56A cap-binding mutant (Fig. 4H and Fig. S1F) as expected, given the 50-fold reduction in affinity of this mutant for the m7G cap (6). Next, we examined the effects of m7G cap addition on an importin α/β cargo by monitoring trafficking of the GST-NLS-GFP cargo (31). Import assays carried out in the presence or absence of m7G cap showed no difference in GST-NLS-GFP distribution, with GST-NLS-GFP located primarily in the nucleus (Fig. 4G and Fig. S1G). From the above studies, we conclude that importin 8 only imports apo-eIF4E. Further, m7G cap specifically impairs import of eIF4E, but not of cargoes using other import pathways.
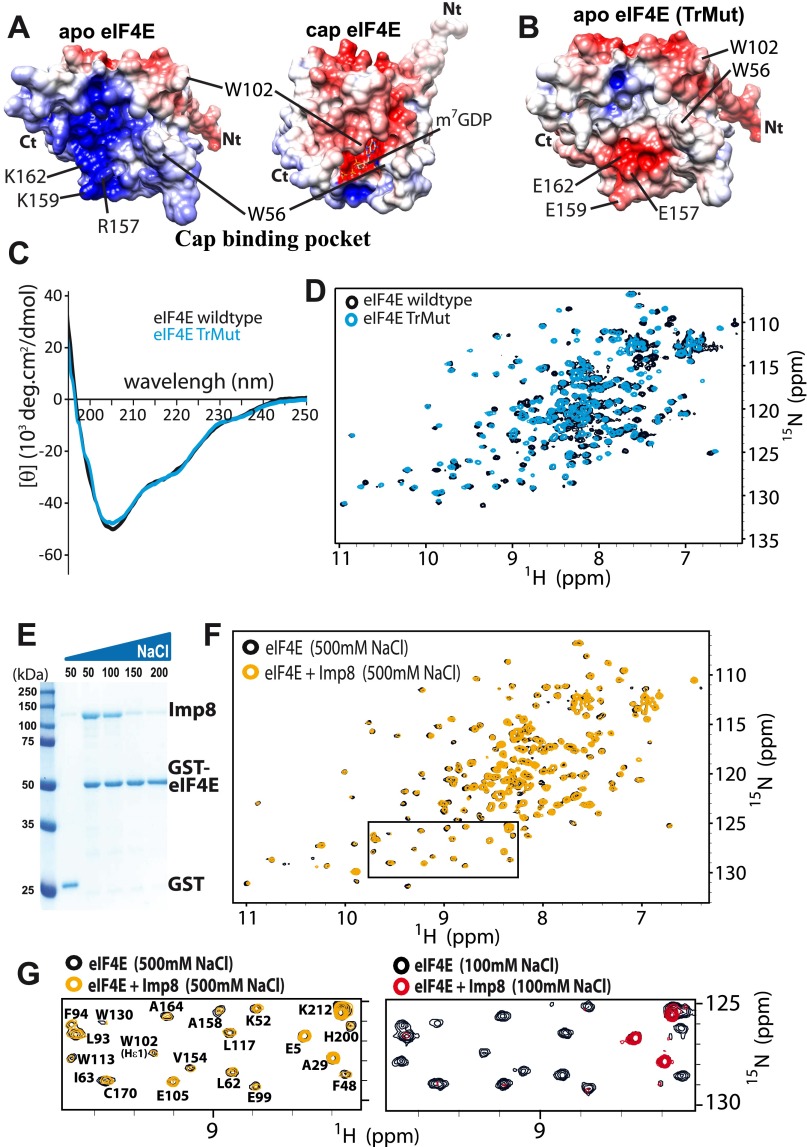
Inspection of the charge distribution on apo- and cap-bound eIF4E structures reveals that the large positively charged patch in apo-eIF4E centered around residues R157, K159, and K162 is no longer present in the cap-bound form (Fig. 4 D and J). This change occurs because m7G cap binding leads to closure of the W56 and W102 loops with concomitant reduction of the positive charge due to the presence of the cap analog phosphates (30). Consistently, our NMR data indicated that residues at this positively charged surface were significantly perturbed even at low molar importin 8/eIF4E ratios (Fig. 4C). To examine the relevance of this surface for importin 8 binding, we generated a triple mutant (TrMut) whereby R157, K159, and K162 were mutated to glutamates to imbue this surface with a negative charge (Fig. S9 A and B). NMR and CD studies indicated the TrMut was folded (Fig. S9 C and D). GST pull-down experiments showed that the TrMut had a marked reduction in affinity for importin 8 relative to wild-type eIF4E (Fig. 4I). Thus, mutation of the positive surface in the cap-binding site substantially reduces the affinity of eIF4E for importin 8. We note that mutation of W56 did not alter binding to importin 8 or nuclear trafficking of eIF4E (Fig. 4H, Right and Figs. S1F and S7 B–D). These observations indicate that the positive patch within the cap-binding site is specifically required for importin 8 trafficking, and not the cap-binding site as a whole.
Fig. S9.
Association of eIF4E with importin 8 is driven by electrostatic forces. (A) Comparison of the surface charge distribution in the cap-binding pocket of apo- and cap-bound forms of eIF4E (PDB ID codes 2GPQ and 3AM7, respectively). Key residues used for recognition with ligands and partners are shown. Acidic (negatively charged) and basic (positively charged) regions are in red and blue, respectively. (B) Surface charge distribution of the TrMut demonstrates similarity to the cap-bound form of eIF4E in terms of charge. Comparison of the far-UV CD spectra (C) and 1H-15N HSQC spectra (D) of the eIF4E wild type (black) and eIF4E TrMut (cyan) demonstrating that the mutations have not altered the overall structure for TrMut. (E) Effect of increasing concentration of NaCl (50–200 mM) on the association of importin 8 to GST-eIF4E by GST pull-down assay. (F) Overlay of 1H-15N HSQC spectra of the eIF4E in the absence (black) or presence (orange) of importin 8 in phosphate buffer containing 500 mM NaCl. The interaction is clearly lost at high salt. Note that the other HSQC spectra shown were collected at 100 mM NaCl. (G) Enlarged section of the HSQC spectra shown in F (rectangle) is compared with the same section of HSQCs in Fig. S6 A and B.
Mutation of the positive patch suggested that the interaction of eIF4E with importin 8 was electrostatically based. Thus, we examined the salt sensitivity of the interaction using NMR and pull-down assays with wild-type proteins (Fig. S9 E and F). As expected, increasing NaCl from 100 to 500 mM impaired complex formation. Taken together with the TrMut, these studies strongly suggest that a negative patch on importin 8 interacts with the positive patch in the vacant cap-binding site. However, our HSQC data also indicate that residues throughout the eIF4E structure were perturbed by importin 8, suggesting that importin 8 contacts additional surfaces on eIF4E (Fig. 4C and Fig. S6B). Thus, although importin 8 requires the positive patch for binding, its contacts are likely not restricted to this region.
Clinical Relevance of the Importin 8–eIF4E Interaction.
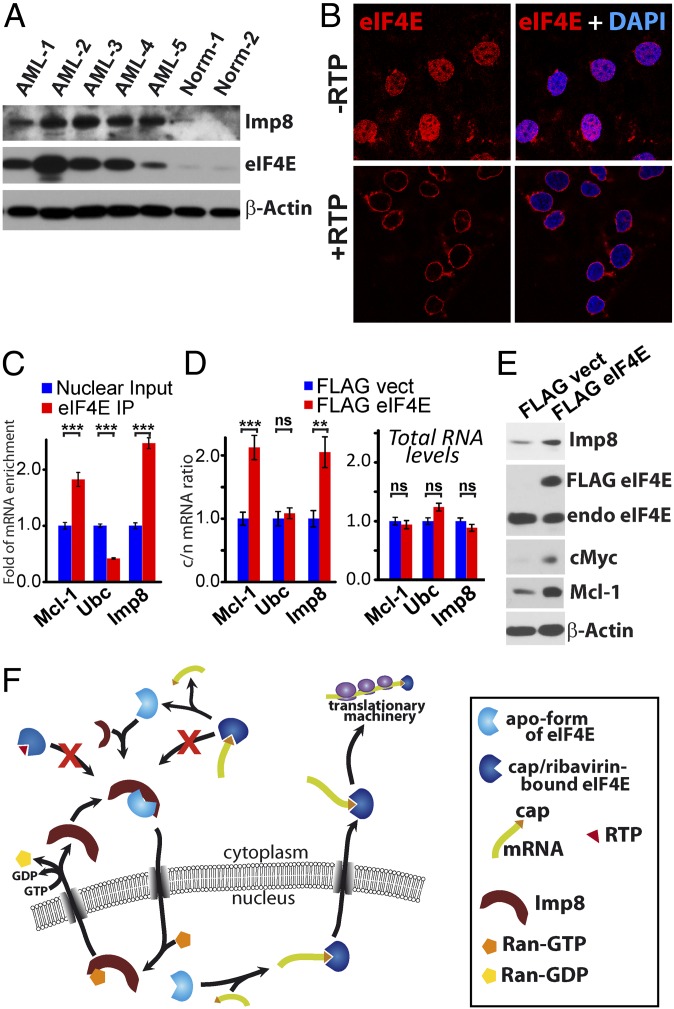
Given the nuclear enrichment of eIF4E in M4/M5 AML (Fig. S10), we investigated if importin 8 levels were also dysregulated here (Fig. 5A). We observed highly elevated importin 8 protein levels in these AML specimens compared with healthy volunteers. Actin was used as a loading control. These findings suggest that eIF4E might drive its own nuclear accumulation in these AML subtypes (see next section).
Fig. S10.
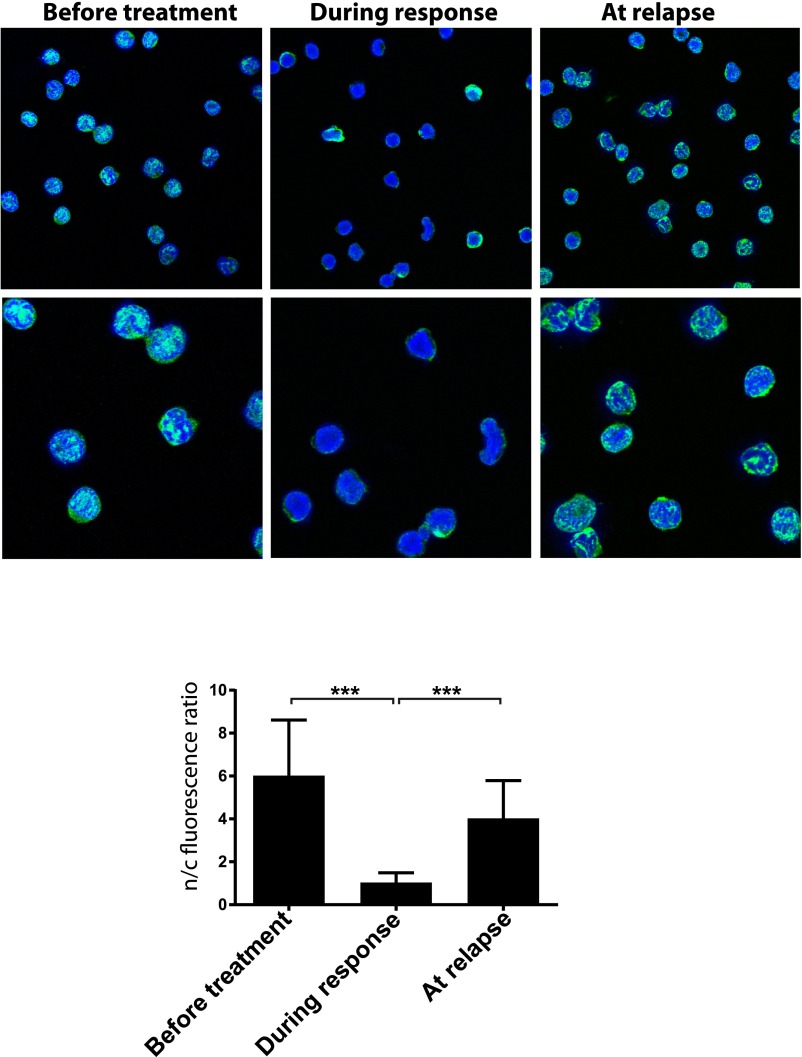
eIF4E localization is dysregulated in leukemia. eIF4E localization (green) in leukemia blasts cells isolated from a patient with AML treated with ribavirin [patient 6 in our ribavirin monotherapy trial (9)]. Confocal micrographs of patient 6 samples taken before treatment, during response, and at relapse. DAPI, a nuclear marker, is in blue. Micrographs are single sections through the plane of the cells. [Magnification: 100× (Top) with an additional 3× digital zoom (Bottom)]. Quantification of nuclear to cytoplasmic intensity ratio for eIF4E is shown in bar graph form. ***P < 0.001.
Fig. 5.
Importin 8 is elevated in AML and is an eIF4E mRNA export target. (A) Importin 8 protein levels in patients with M4/M5 AML by Western blot. Numbers refer to different patients, and normal (Norm) refers to specimens from two different healthy volunteers. Actin is a loading control. (B) Nuclear import assays using wild-type eIF4E-GST (red) as a function of treatment with RTP at 50 μM, a clinically achievable concentration (9). DAPI is in blue. Confocal micrographs represent single sections through the plane of the cells with a magnification of 63× and no additional zoom. Quantification is shown in Fig. S1H. (C) Fold mRNA enrichment relative to nuclear input in eIF4E IPs from U2OS nuclear lysates as indicated. (D, Left) RNA export assay showing the mRNA c/n for importin 8 mRNAs. (D, Right) Total mRNA levels for Ubc, importin 8, and Mcl-1 do not change upon eIF4E overexpression. Data are the mean ± SD. **P < 0.01; ***P < 0.001. ns, not significant. (E) Western blot analysis indicates that eIF4E overexpression increases importin 8 levels. (F) Model for eIF4E import cycle. Details are provided in the main text.
The cytoplasmic accumulation of eIF4E upon cap addition (Fig. 4H, Left) was reminiscent of observations in patients and cell lines treated with ribavirin (9, 14, 15, 23) (Fig. S10). Further, NMR analysis indicated that both the active metabolite of ribavirin, ribavirin 5′-triphosphate (RTP), and m7G cap binding lead to similar conformational changes to eIF4E and that the phosphates of RTP also bind R157, K159, and K162 (17). Consistently, we observe that RTP also inhibits nuclear import of eIF4E in vitro by over 50-fold, similar to the m7G cap (Fig. 5B and Fig. S1H). Thus, similar to the cap, RTP impairs importin 8 binding, preventing nuclear entry of eIF4E, and thereby providing a molecular basis for the cytoplasmic accumulation observed in responding patients.
Importin 8 Is an eIF4E mRNA Export Target.
Given the elevated levels of importin 8 in patients with AML who have high eIF4E, we examined whether importin 8 is an eIF4E mRNA export target. First, we carried out immunoprecipitations (IPs) of endogenous eIF4E from the nuclear fraction of U2OS cells and monitored bound RNAs using qPCR. Importin 8 mRNAs were enriched in the eIF4E IPs (Fig. 5C). Negative control mRNAs did not immunoprecipitate (e.g., Ubc). We also observed that importin 8 mRNA export and protein levels were elevated upon eIF4E overexpression (Fig. 5 D and E). Note that 4ESE RNA export elements are found in the 3′ UTRs of target mRNAs (5, 7) and, consistently, modulation of eIF4E did not alter the expression of the importin 8-FLAG construct generated from cDNA in our above foci assays (Fig. S4A). Thus, eIF4E elevates importin 8 protein levels through increased mRNA export. Future studies will determine if importin 8 mRNAs are also translation targets of eIF4E.
Discussion
We identified apo-eIF4E, but not eIF4E complexed to cap analogs, RTP, or m7G-capped RNAs, as an importin 8 cargo (Fig. 5F). A positively charged patch on apo-eIF4E at the unoccupied cap-binding site is important for binding importin 8. These observations have significant functional implications. For instance, eIF4E that is associated with actively translating mRNAs is not a cargo. Importin 8 may also sequester eIF4E from target RNAs in the cytoplasm as a means of translational control; this possibility is an important area of future study. Another ramification is that eIF4E–mRNA export complexes would not be reimported into the nucleus until after the cargo release step, reducing futile mRNA export cycles in this way. This cap-dependent switch also provides a molecular explanation for the cytoplasmic accumulation of eIF4E in patients responding to ribavirin and in cell lines treated with ribavirin or cap analogs. Specifically, RTP prevents importin 8 binding to eIF4E, leading to its cytoplasmic retention as observed in patients responding to ribavirin. However, at relapse, when ribavirin is either glucuronidated or not transported into the cell (14, 18), eIF4E is once again an importin 8 cargo and thereby accumulates in the nuclei of leukemic cells. This accumulation leads to elevated eIF4E-dependent mRNA export and is correlated with disease progression. Further, the nuclear accumulation of eIF4E in AML, coupled to its elevated mRNA export activity, suggests that cytoplasmic dwell times must be short for newly exported eIF4E-RNPs relative to the time required to form export-ready eIF4E–mRNA complexes in the nucleus. This possibility is consistent with eIF4E-dependent changes to the nuclear pore complex, which specifically enhance cytoplasmic release of eIF4E-RNA cargoes (6). Finally, our studies suggest a link between the nuclear trafficking of eIF4E and its oncogenic potential.
Aside from eIF4E, Argonaute, SMADs (SMA- and MAD-related proteins), and SRP19 (signal recognition peptide 19) have been reported as importin 8 cargoes (32–34). Unfortunately, no common features emerged after sequence analysis of these cargoes; however, our results suggest there is a strong electrostatic component. This possibility is consistent with our previous observation that the NLS for Kap108 (yeast importin 8) cargoes maps to disordered basic regions (35–38), although our findings here suggest that these surfaces can also be within folded domains. The principles for molecular recognition will likely become more evident once importin 8 cargo structures are determined.
Although importin 8 is the only direct mediator of eIF4E nuclear entry identified to date, it is entirely possible that other karyopherins may be found in the future to traffic eIF4E. Potential binding partners may indirectly modulate eIF4E nuclear localization, such as the hematopoietically expressed proline-rich homeodomain protein (PRH/Hex), which, when overexpressed, leads to cytoplasmic accumulation of eIF4E (39). Indeed, Hex overexpression impairs the transformation potential of eIF4E, which is linked to inhibition of its nuclear entry (39). Hex, which directly binds eIF4E, may compete with importin 8 for eIF4E, providing a molecular basis for the observed cytoplasmic phenotype. It is likely that other direct binding partners also play roles in eIF4E trafficking, particularly any that modulate cap binding or associate with the positive patch recognized by importin 8. In this way, concentrations and affinities of eIF4E partners will have an impact on importin 8 binding and subsequent eIF4E nuclear trafficking. Thus, it is important to note when considering our findings that importin 8 transcripts themselves are nuclear export targets of eIF4E. However, eIF4E does not abnormally accumulate in the nuclei of all high-eIF4E cancer cells. In this way, nuclear import of eIF4E is likely regulated in a multifactorial and context-dependent manner. In conclusion, these studies provide a molecular basis for nuclear import of eIF4E and an understanding of how ligand binding modulates this process in cells and patients.
Materials and Methods
The eIF4E (pET-15b or pGEX-6p1) and importin 8 (pGEX-4T3) were purified from BL21(DE3) cells. Karyopherin binding assays were conducted in 20 mM Hepes (pH 7.4), 110 mM potassium acetate, 2 mM magnesium acetate, 0.005% Nonidet P-40, 1 mM EGTA, and 20 mM DTT. NMR spectra were acquired at 600 MHz on a Varian INOVA or Bruker Avance III HD spectrometer at 20 °C. Data were processed and analyzed with NMRPipe (40) and Sparky (41) software. PyMOL (42) and Chimera (43) were used for structure rendering. The calculation and analyses of the electrostatic potentials were performed using PDB2PQR (44) and APBS (45). Standard methods for cell culture and transfections were used, as described by Culjkovic et al. (5). The fractionation protocol was followed as described (3, 6). For anchorage-dependent foci assays, 500 cells were seeded per 10-cm plate for 14 d (6) and then stained with Giemsa (Sigma). For nuclear import assays, we used in vitro nuclear import assays as described by Cassany and Gerace (27). Further information is provided in SI Materials and Methods.
For all patients in this study, written informed consent was obtained in accordance with the Declaration of Helsinki. This study received institutional review board (all sites) and Health Canada approval.
SI Materials and Methods
Constructs.
For protein overexpression and purification, the following constructs were used: pGEXTEV [modified pGEX4T3 (GE Healthcare) with TEV site) for yeast Ran GTPase GSP1 (residues 1–179, Q71L) and importins 4, 5, 7, 8, 9, and 11 as well as Impα, Kapβ1, and Kapβ2 (25); pGEX-20T (a derivative of pGEX2T; Amersham Pharmacia Biotech) for mouse eIF4E protein; and pET-15b for human eIF4E, mouse eIF4E3, and Ran proteins. The eIF4E mutants were generated by performing site-directed mutagenesis and verified by DNA sequencing. Importin 8 shRNA plasmid (sc-75336-SH; Santa Cruz Biotechnology) and control shRNA plasmids (sc-108060 A, sc-108065 B, and sc-108066 C; Santa Cruz Biotechnology) were used in cell culture. Predesigned siRNAs were all from Integrated DNA Technologies: HSC.RNAI.N001190995.12.1 (human importin 8), HSC.RNAI.N018085.12.1 (human importin 9), and MMC.RNAI.N001081113.12.9 (mouse importin 8). For generating stable cell lines, 3Flag-pcDNA-importin 8, 3Flag-pcDNA-importin 9, and 2Flag-pcDNA, and MSCV-eIF4E plasmids, as well as eIF4E+NLS plasmids, were used, respectively, as described previously (6, 29). The GST-NLS-GFP construct was described by Rosorius et al. (31).
Antibodies and Materials.
Antibodies used were rabbit polyclonal anti-importin 8 (LifeSpan BioSciences); mouse monoclonal anti-eIF4E and SC-35 (BD Transduction Laboratories); goat polyclonal anti-GST (GE Health Sciences); rabbit polyclonal anti–Mcl-1 (S-19), mouse monoclonal anti–c-Myc (9E10), goat polyclonal anti-NBS1 (C-19), rabbit polyclonal anti-Pol II (N20), mouse monoclonal anti–MEK-1 (H-8), rabbit polyclonal importin 5/Karyopherin β3 (H-300), and mouse monoclonal anti-survivin (C-6) (all from Santa Cruz Biotechnology); mouse monoclonal anti–β-actin, mouse monoclonal anti–α-tubulin, and anti-Flag (M2) (all from Sigma); rabbit polyclonal anti-importin 9 (Novus); rabbit polyclonal anti-Histone 2B (BioVision); and anti-rabbit and mouse-HRP, anti-rabbit AF488, anti-mouse Texas Red, and anti-goat Cy3 (all from Jackson Laboratories). RTP was obtained from Toronto Research Chemicals, and its quality was verified using NMR. The cap analog m7GDP was obtained from Sigma and New England Biolabs and was also validated by NMR.
Recombinant Protein Expression and Purification.
Human importin 8 was overexpressed in the BL21(DE3) strain of Escherichia coli with an N-terminal GST-tag. When the OD at 600 nm of the bacterial culture reached 1.0, recombinant importin 8 expression was induced with 0.5 mM isopropyl-β-d-thiogalatopyranoside (IPTG) and allowed to grow at 20 °C overnight. The cells were harvested and resuspended in TB buffer [50 mM Tris (pH 7.5), 200 mM NaCl, 10% (vol/vol) glycerol, 1 mM EGTA, 2 mM DTT] supplemented with protease inhibitors (Roche). The cells were lysed using an EmulsiFlex-C5 homogenizer (Avestin) and supernatant of the lysate added to glutathione Sepharose 4B (GE Healthcare) for affinity purification. After extensive washing, the bound GST-importin 8 was cleaved with TEV protease. Importin 8 was then eluted and loaded onto a Mono Q HP (GE Healthcare) column, followed by gel filtration chromatography (Superdex-200 column; Amersham Biosciences) in 50 mM Tris (pH 7.5), 100 mM NaCl, 10% (vol/vol) glycerol, and 2 mM DTT. For NMR studies, importin 8 was concentrated to 8–10 mg/mL and extensively dialyzed against the NMR buffer. The other importin proteins were expressed as GST fusions in E. coli BL21(DE3) cells and purified by affinity chromatography. The GST was removed with TEV protease, followed by ion exchange chromatography and size exclusion, as previously reported (25).
All mouse GST-eIF4E, GST-eIF4E mutants, and GST-eIF4E3 used in this study were induced in E. coli BL21(DE3) cells with 0.5 mM IPTG at an OD of 0.8. Note that mouse and human eIF4E only differ by four amino acids, which occur in noncritical regions of the protein. Cells were cultured at 20 °C for 18 h, harvested by centrifugation, and frozen at −20 °C. Cells were then lysed by sonication in 20 mL/L of cold lysis buffer (PBS supplemented with 350 mM NaCl, 2 mM DTT, 1 mg/mL lysozyme, complete EDTA-free protease inhibitor pill) and clarified by centrifugation at 50,000 × g (30 min at 4 °C). The lysate was bound with preequilibrated glutathione beads for 1 h by rotating at 4 °C, washed, and eluted with PBS buffer containing 50 mM reduced glutathione. The protein was further purified with ion exchange chromatography (mono Q HP column) and gel filtration chromatography (Superdex-200 column). The 15N-labeled human eIF4E and mouse eIF4E3 were isotopically enriched by growing BL21(DE3) cells in M9 minimal media containing 1 g of 15N ammonium chloride and 6 g of glucose. The culture was induced with 0.5 mM IPTG at 30 °C for 18 h. The harvested cells were lysed by sonication in phosphate buffer containing 300 mM NaCl, 10 mM imidazole, 0.5% Nonidet P-40, 7 mM β-mercaptoethanol, 0.5 mM PMSF, 1 mg/mL lysozyme, and a complete EDTA-free protease inhibitor pill, and cleared lysate was loaded onto nickel-nitrilotriacetic acid (Ni-NTA) agarose beads. The protein was eluted with 500 mM imidazole in PBS containing 1 mM DTT. The N-terminal histidine tag was cleaved with thrombin added to overnight dialysis solution. The protein was purified by gel filtration chromatography (Superdex-200).
Human Ran protein was induced with 0.5 mM IPTG and allowed to grow at 20 °C for 18 h. The cells were harvested and resuspended in 20 mL/L of cold lysis buffer [20 mM Tris (pH 8.0), 100 mM NaCl, 10% (vol/vol) glycerol, 1 mM β-mercaptoethanol, 1 mg/mL lysozyme, protease inhibitors]. After sonication, the cleared lysate was purified by affinity chromatography using Ni-NTA beads, and the protein, eluted with 500 mM imidazole, was further separated using gel filtration chromatography (Superdex-75 column; Amersham Biosciences). Purity of protein preparations was always verified by SDS/PAGE.
The yeast Ran GTPase GSP1 (residues 1–179, Q71L) (25) was expressed in E. coli BL21(DE3) cells (grown to an OD of 0.6–0.8 and then induced with 0.5 mM IPTG at 25 °C for 12 h). The cells were lysed using an EmulsiFlex-C5 homogenizer (Avestin) in buffer containing 50 mM Hepes (pH 7.4), 200 mM NaCl, 2 mM magnesium acetate, 10% (vol/vol) glycerol, 2 mM DTT, and protease inhibitors. GST-GSP1 was purified by affinity chromatography (glutathione-Sepharose; GE Life Sciences), and eluted in buffer containing 20 mM Hepes (pH 7.4), 50 mM NaCl, 4 mM magnesium acetate, 0.1 mM GTP, 10% (vol/vol) glycerol, and 2 mM DTT supplemented with 20 mM reduced glutathione. GST-GSP1 was further purified using cation exchange chromatography (HiTrap SP HP; GE Life Sciences).
Binding Assays.
GST and GST-eIF4E (wild-type and mutant) proteins were immobilized on glutathione Sepharose 4B (GE Healthcare) at 10 nmol of protein per milliliter of beads in PBS supplemented with 1 mM DTT. For each binding reaction, 15 μL of GST or GST fusion proteins was incubated with 36 μg of purified importin 8 in 400 μL of binding buffer [20 mM Hepes (pH 7.4), 110 mM potassium acetate, 2 mM magnesium acetate, 0.005% Nonidet P-40, 1 mM EGTA, 20 mM DTT] and mixed by rotation for 1 h at 4 °C. Unbound protein was removed by washing four times with binding buffer, and bound proteins were eluted with hot Laemmli sample buffer. The eluted protein complexes were then separated by SDS/PAGE and stained with Coomassie Brilliant Blue. In additional competition experiments, Ran-GTP (at a fivefold molar excess with the different importins) or m7GDP was added individually to the binding buffer, along with importin 8 during the incubation step.
For the in vitro binding assay with GST-GSP1, ∼60 μg of purified karyopherin was added to ∼30 μg of immobilized GST-GSP1 on glutathione-Sepharose beads in a total volume of 200 μL with buffer containing 20 mM Hepes (pH 7.5), 110 mM potassium acetate, 2 mM magnesium acetate, 1 mM EGTA, and 15% (vol/vol) glycerol, and rotated at 4 °C for 60 min. After extensive washing with buffer, the bound proteins were separated by SDS/PAGE and visualized using Coomassie staining.
Cell Culture and Transfection.
U2OS cells (American Type Culture Collection) were maintained in 5% CO2 at 37 °C in DMEM (Gibco BRL) supplemented with 10% FBS and 1% penicillin-streptomycin (Invitrogen). Transfections for stable cell lines were performed using Trans IT-LT1 Transfection Reagent (Mirus) as specified by the manufacturer, and selected in puromycin-containing medium (10 μg/mL) for short hairpin importin 8 or G418 (1 mg/mL) for eIF4E, importin 8, and importin 9 stable overexpressing cell lines. For importin 8 and 9 knockdown, U2OS cells were transfected with Lipofectamine 2000 and 40 nM siRNA duplex according to the manufacturer’s instructions. Cells were analyzed 72 h after transfection. The eIF4E-overexpressing mouse embryonic fibroblasts were described by Culjkovic et al. (46).
Fractionation and Export Assay.
The fractionation protocol was followed as previously described (3). About 3 × 10⁷ cells were collected and washed twice in ice-cold PBS (300 × g for 3–5 min) and then resuspended with slow pipetting in 1 mL of lysis buffer B [10 mM Tris (pH 8.4), 140 mM NaCl, 1.5 mM MgCl2, 0.5% Nonidet P-40, 1 mM DTT, 100 U/mL RNase inhibitors]. The lysate was centrifuged at 1,000 × g for 3 min at 4 °C, and supernatant (cytoplasmic fraction) was transferred into a fresh microtube. The pellet (nuclear fraction) was resuspended in 1 mL of lysis buffer B and transferred to a round-bottomed polypropylene tube, and 1/10 volume (100 μL) of detergent stock [3.3% (wt/vol) sodium deoxycholate, 6.6% (vol/vol) Tween 40 in DEPC H2O] was added with slow vortexing (to prevent the nuclei from clumping) and incubated on ice for 5 min. The suspension was transferred to a microtube and centrifuged at 1,000 × g for 3 min at 4 °C. Supernatant (postnuclear fraction) was transferred to a fresh tube (and subsequently combined with cytoplasmic fraction), and the pellet-nuclear fraction was rinsed in 1 mL of lysis buffer B and centrifuged at 1,000 × g for 3 min at 4 °C. The nuclei present in the pellet were resuspended in 100 μL of lysis buffer B and sonicated. The RNA was extracted from the different fractions by adding TRIzol reagent (Invitrogen) and processed according to the manufacturer’s instructions. DNase-treated RNA samples (TurboDNase; Ambion) were reverse-transcribed using MMLV (Moloney Murine Leukemia Virus) reverse transcriptase (Invitrogen). Quantitative RT-PCR (qPCR) analyses were performed using SensiFast SYBR low Rox mix (FroggaBio) in a Life Technologies ViiA 7 thermal cycler using the relative standard curve method (Applied Biosystems User Bulletin no. 2). A list of primers used in this study (F indicates forward, R indicates reverse), categorized by name and sequence, is shown below:
cMycF: TCAAGAGGCGAACACACAACG
cMycR: TGGACGGACAGGATGTATGCTG
Mcl1F: ACTTCTCACTTCCGCTTCCTTCCA
Mcl1R: TTTGAGGCCAAACATTGCCAGTCG
SurvivinF: TCTGTCAGCCCAACCTTCACATCT
SurvivinR: TGTAACAATCCACCCTGCAGCTCT
UbcF: ATTTGGGTCGCGGTTCTTG
UbcR: TGCCTTGACATTCTCGATGGT
ActinBF: GCATGGAGTCCTGTGGCATCCACG
ActinBR: GGTGTAACGCAACTAAGTCATAG
U6F:CGCTTCGGCAGCACATATAC
U6R: AAAATATGGAACGCTTCACGA
tRNALF: GCCCGGATAGCTCAGTCGGT
tRNALR2: CGCCCAACGTGGGGCTCTCG
Imp8F: CATGATGCCTCTCCTGCATAA
Imp8R: CTTCTCCTGCATCTCCACATAG
Anchorage-Dependent Foci.
A total of 500 cells were seeded per 10-cm plate, or 100 cells per well in six-well plates for 14 d, and then stained with Giemsa (Sigma–Aldrich). Foci were counted manually. For siRNA eIF4E or importin 8 experiments shown in Fig. 3B and Fig. S4D, cells were plated for the foci assay 96 h after treatment with siRNAs and control siRNAs. Knockdown was confirmed by Western blot for eIF4E or importin 8 both at the start of the experiment and 10 d later ensuring the knockdown was retained during the time course of the experiment.
In Vitro Fluoroblok Migration and Invasion Assay.
Fluoroblok invasion assays were performed according to the manufacturer’s instructions (Corning). Briefly, Fluoroblok 24-well inserts with an 8-μm pore size PET (Polyethylene Terephthalate) membrane (catalog no. 351152; Corning) were precoated with 1 μg/μL Matrigel matrix basement membrane (catalog no. 356237; BD Biosciences) diluted in serum-free media for 24 h at 37 °C. Cells were harvested, centrifuged, rinsed three times with serum-free media, and suspended at a density of 1 × 10⁵ cells per 300 μL in culture media containing 0.5% FBS. Cells were then plated on Matrigel-coated and uncoated inserts, and 750 μL of culture media containing 10% FBS was added to the lower compartment of the chamber. Chambers were incubated at 37 °C for 48 h. After the invasion period, cells were labeled with DilC12(3) perchlorate, ultrapure (catalog no. ENZ-52206; Enzo Life Sciences) diluted at 1:2,000 in culture media for 10 min at 37 °C, followed by incubation for 15 min at 4 °C. After washing, fluorescence of invaded and migrated cells was measured at wavelengths of 549/565 nm (Excitation/Emission) on a bottom-reading fluorescent plate reader, and images were taken using an inverted fluorescence microscope to verify results. Data are expressed in the following equation, where RFU corresponds to Relative Fluorescence Units:
Immunocytochemistry.
eIF4E was detected in U2OS cells by indirect immunofluorescence, followed by confocal microscopy. The U2OS cells grown on coverslips were washed with PBS and fixed and permeabilized with 100% methanol at −20 °C for 5 min. The fixed cells were blocked with 10% FBS and 0.1% (vol/vol) Tween 20 in PBS for 1 h at room temperature (RT), and incubated with primary antibody (anti-eIF4E at 1:100 dilution) overnight in a humid chamber at 4 °C. After washing three times in PBS, the cells were incubated with anti-mouse Texas Red-conjugated antibody (1:300 dilution) to detect eIF4E antibody at RT for 1 h. The cells were washed with PBS and mounted in mounting media with DAPI (Vector Laboratories). Cells were observed using a laser scanning confocal microscope (LSM510 or LSM700; Carl Zeiss) using 405-nm and 548-nm laser lines with a 63× oil objective and no additional zoom, unless stated otherwise. Channels were detected separately, with no cross-talk between channels observed. Quantification was carried out using ImageJ software (NIH) on between 25 and 80 cells per condition as per sciencetechblog.com/2011/05/24/measuring-cell-fluorescence-using-imagej/.
Primary Patient Data.
Patient data shown in Fig. S10 are derived from patient 6 in our ribavirin monotherapy trial (9). As for all patients in this study, written informed consent was obtained in accordance with the Declaration of Helsinki. This study received institutional review board (all sites) and Health Canada approval. The ClinicalTrials.gov registry is NCT00559091. Clinical response, a blast response (an over 50% drop in leukemia blasts) in this case, was achieved as per the Cheson criteria. Details of cell sorting, blast isolation, and confocal microscopy are provided by Assouline et al. (9). Patient specimens for analysis of importin 8 levels were obtained from the Banques de Cellules Leucémiques du Québec leukemia tissue bank with institutional ethics approval. These specimens were deidentified. Blasts were obtained using flow cytometry as described (9). Normal specimens were obtained from Stem Cell Technologies.
NMR Spectroscopy.
The solution conditions used in NMR experiments were 20–50 μM eIF4E in 92% H2O/8% D2O containing 50 mM phosphate buffer (pH 7.3), 100 mM NaCl, 1 mM DTT, and 0.02% sodium azide at 20 °C. 1H-15N HSQC NMR spectra of eIF4E in complex with importin 8 and various ligands were acquired with 100 increments and 64 scans per increment. NMR experiments were acquired at 600 MHz on a Varian INOVA or Bruker Avance III HD spectrometer equipped with HCN and QCI cold probes, respectively. Data were processed and analyzed with NMRPipe (40) and Sparky (41) software.
The graphic representations of the 3D structures were rendered using PyMOL (42) and Chimera (43). The calculation and analyses of the electrostatic potentials were performed using the programs PDB2PQR (44) and APBS (45).
Nuclear Import Assays.
We used in vitro nuclear import assays as described by Cassany and Gerace (27). Briefly, U2OS cells were grown on coverslips to 80–90% confluence. Cells were washed two times in PBS and one time in Transport buffer [20 mM Hepes (pH 7.3), 110 mM potassium acetate, 2 mM magnesium acetate, 1 mM EGTA, 2 mM DTT, and a home-made protease inhibitor mixture containing the following compounds: PMSF, pepstatin A, aprotinin, leupeptin, phenanthrolene, and benzamidine] and permeabilized with digitonin (50 μg/mL) for 5 min at RT. The permeabilized cells were washed six times with ice-cold Transport buffer. The cells were incubated with import mixtures at 37 °C for 20 min in a humid chamber. Import mixtures contained an energy-regenerating system consisting of the following components: 1 mM ATP, 0.2 mM GDP, 0.2 mM GTP, 5 μM creatine phosphate, and 20 U/mL creatine phosphokinase (Sigma). The final concentrations for each protein in the mixture were 1 μM GST-eIF4E or its mutants; 1.5 μM importins 4, 5, 8, or 9; 2 μM Ran or GSP1 or 3 μM GFP-NLS; 1 μM Kapβ2; 2 μM Impα; and 2 μM Ran. When added, RTP and m7GDP concentrations were 50 μM. After washing three times with Transport buffer, cells were fixed with 4% paraformaldehyde for 10 min at RT and then washed three times with PBS to remove paraformaldehyde and permeabilized with 0.2% (vol/vol) Triton X-100 for 10 min at RT. Upon permeabilization, cells were washed four times with PBS, blocked with Blocking buffer (10% FBS and 0.1% Tween 20 in PBS) for 1 h, and incubated with anti-GST antibody (1:1,000 dilution) overnight at 4 °C in a wet chamber, followed by three washes in PBS. Cells were then incubated with Cy3-conjugated anti-goat antibody (1:200 dilution) for 1 h at RT. The cells were then washed four times with 1× PBS and mounted in mounting media with DAPI. Analysis was carried out using a laser-scanning confocal microscope (LSM510 or LSM700) exciting 405 nm and 543 nm with 63× oil objectives and 1× digital zoom. Channels were detected separately, with no cross-talk observed. Confocal micrographs represent single sections through the plane of the cell.
Acknowledgments
We thank Garen Collett for initial experiments that detected importin 8 binding to eIF4E, Sanamerjit Mann for technical assistance, and Hualin Zhong for the GST-NLS-GFP construct. We are grateful for specimens from the Banques de Cellules Leucémiques Du Québec. This research was supported by NIH Grants R01 98571 and R01 80728; Translational Research Program grants from the Leukemia and Lymphoma Society (to K.L.B.B.); NIH Grants R01 GM069909 (to Y.M.C.) and U01 GM98526 (to Y.M.C.); the University of Texas Southwestern Endowed Scholars Program (Y.M.C.); Welch Foundation Grant I-1532 (to Y.M.C.); and a Leukemia and Lymphoma Society Scholar Award (to Y.M.C.). K.L.B.B. holds a Canada Research Chair.
Footnotes
Conflict of interest statement: The authors declare no conflict of interest.
This article is a PNAS Direct Submission.
This article contains supporting information online at www.pnas.org/lookup/suppl/doi:10.1073/pnas.1524291113/-/DCSupplemental.
References
- 1.Carroll M, Borden KL. The oncogene eIF4E: Using biochemical insights to target cancer. J Interferon Cytokine Res. 2013;33(5):227–238. doi: 10.1089/jir.2012.0142. [DOI] [PMC free article] [PubMed] [Google Scholar]
- 2.Ruggero D, et al. The translation factor eIF-4E promotes tumor formation and cooperates with c-Myc in lymphomagenesis. Nat Med. 2004;10(5):484–486. doi: 10.1038/nm1042. [DOI] [PubMed] [Google Scholar]
- 3.Rousseau D, Kaspar R, Rosenwald I, Gehrke L, Sonenberg N. Translation initiation of ornithine decarboxylase and nucleocytoplasmic transport of cyclin D1 mRNA are increased in cells overexpressing eukaryotic initiation factor 4E. Proc Natl Acad Sci USA. 1996;93(3):1065–1070. doi: 10.1073/pnas.93.3.1065. [DOI] [PMC free article] [PubMed] [Google Scholar]
- 4.Lejbkowicz F, et al. A fraction of the mRNA 5′ cap-binding protein, eukaryotic initiation factor 4E, localizes to the nucleus. Proc Natl Acad Sci USA. 1992;89(20):9612–9616. doi: 10.1073/pnas.89.20.9612. [DOI] [PMC free article] [PubMed] [Google Scholar]
- 5.Culjkovic B, Topisirovic I, Skrabanek L, Ruiz-Gutierrez M, Borden KL. eIF4E is a central node of an RNA regulon that governs cellular proliferation. J Cell Biol. 2006;175(3):415–426. doi: 10.1083/jcb.200607020. [DOI] [PMC free article] [PubMed] [Google Scholar]
- 6.Culjkovic-Kraljacic B, Baguet A, Volpon L, Amri A, Borden KL. The oncogene eIF4E reprograms the nuclear pore complex to promote mRNA export and oncogenic transformation. Cell Reports. 2012;2(2):207–215. doi: 10.1016/j.celrep.2012.07.007. [DOI] [PMC free article] [PubMed] [Google Scholar]
- 7.Culjkovic B, Topisirovic I, Skrabanek L, Ruiz-Gutierrez M, Borden KL. eIF4E promotes nuclear export of cyclin D1 mRNAs via an element in the 3′UTR. J Cell Biol. 2005;169(2):245–256. doi: 10.1083/jcb.200501019. [DOI] [PMC free article] [PubMed] [Google Scholar]
- 8.Culjkovic-Kraljacic B, et al. Combinatorial targeting of nuclear export and translation of RNA inhibits aggressive B-cell lymphomas. Blood. 2016;127(7):858–868. doi: 10.1182/blood-2015-05-645069. [DOI] [PMC free article] [PubMed] [Google Scholar]
- 9.Assouline S, et al. Molecular targeting of the oncogene eIF4E in acute myeloid leukemia (AML): A proof-of-principle clinical trial with ribavirin. Blood. 2009;114(2):257–260. doi: 10.1182/blood-2009-02-205153. [DOI] [PubMed] [Google Scholar]
- 10.Topisirovic I, et al. Aberrant eukaryotic translation initiation factor 4E-dependent mRNA transport impedes hematopoietic differentiation and contributes to leukemogenesis. Mol Cell Biol. 2003;23(24):8992–9002. doi: 10.1128/MCB.23.24.8992-9002.2003. [DOI] [PMC free article] [PubMed] [Google Scholar]
- 11.Deschler B, de Witte T, Mertelsmann R, Lübbert M. Treatment decision-making for older patients with high-risk myelodysplastic syndrome or acute myeloid leukemia: Problems and approaches. Haematologica. 2006;91(11):1513–1522. [PubMed] [Google Scholar]
- 12.Deschler B, Lübbert M. Acute myeloid leukemia: Epidemiology and etiology. Cancer. 2006;107(9):2099–2107. doi: 10.1002/cncr.22233. [DOI] [PubMed] [Google Scholar]
- 13.Pulsoni A, et al. Survival of elderly patients with acute myeloid leukemia. Haematologica. 2004;89(3):296–302. [PubMed] [Google Scholar]
- 14.Assouline S, et al. A phase I trial of ribavirin and low-dose cytarabine for the treatment of relapsed and refractory acute myeloid leukemia with elevated eIF4E. Haematologica. 2015;100(1):e7–e9. doi: 10.3324/haematol.2014.111245. [DOI] [PMC free article] [PubMed] [Google Scholar]
- 15.Kentsis A, Topisirovic I, Culjkovic B, Shao L, Borden KL. Ribavirin suppresses eIF4E-mediated oncogenic transformation by physical mimicry of the 7-methyl guanosine mRNA cap. Proc Natl Acad Sci USA. 2004;101(52):18105–18110. doi: 10.1073/pnas.0406927102. [DOI] [PMC free article] [PubMed] [Google Scholar]
- 16.Kentsis A, et al. Further evidence that ribavirin interacts with eIF4E. RNA. 2005;11(12):1762–1766. doi: 10.1261/rna.2238705. [DOI] [PMC free article] [PubMed] [Google Scholar]
- 17.Volpon L, Osborne MJ, Zahreddine H, Romeo AA, Borden KL. Conformational changes induced in the eukaryotic translation initiation factor eIF4E by a clinically relevant inhibitor, ribavirin triphosphate. Biochem Biophys Res Commun. 2013;434(3):614–619. doi: 10.1016/j.bbrc.2013.03.125. [DOI] [PMC free article] [PubMed] [Google Scholar]
- 18.Zahreddine HA, et al. The sonic hedgehog factor GLI1 imparts drug resistance through inducible glucuronidation. Nature. 2014;511(7507):90–93. doi: 10.1038/nature13283. [DOI] [PMC free article] [PubMed] [Google Scholar]
- 19.Bollmann F, et al. Human inducible nitric oxide synthase (iNOS) expression depends on chromosome region maintenance 1 (CRM1)- and eukaryotic translation initiation factor 4E (elF4E)-mediated nucleocytoplasmic mRNA transport. Nitric Oxide. 2013;30:49–59. doi: 10.1016/j.niox.2013.02.083. [DOI] [PubMed] [Google Scholar]
- 20.Pettersson F, et al. Genetic and pharmacologic inhibition of eIF4E reduces breast cancer cell migration, invasion, and metastasis. Cancer Res. 2015;75(6):1102–1112. doi: 10.1158/0008-5472.CAN-14-1996. [DOI] [PubMed] [Google Scholar]
- 21.Pettersson F, et al. Ribavirin treatment effects on breast cancers overexpressing eIF4E, a biomarker with prognostic specificity for luminal B-type breast cancer. Clin Cancer Res. 2011;17(9):2874–2884. doi: 10.1158/1078-0432.CCR-10-2334. [DOI] [PMC free article] [PubMed] [Google Scholar]
- 22.Dostie J, Lejbkowicz F, Sonenberg N. Nuclear eukaryotic initiation factor 4E (eIF4E) colocalizes with splicing factors in speckles. J Cell Biol. 2000;148(2):239–247. doi: 10.1083/jcb.148.2.239. [DOI] [PMC free article] [PubMed] [Google Scholar]
- 23.Cohen N, et al. PML RING suppresses oncogenic transformation by reducing the affinity of eIF4E for mRNA. EMBO J. 2001;20(16):4547–4559. doi: 10.1093/emboj/20.16.4547. [DOI] [PMC free article] [PubMed] [Google Scholar]
- 24.Chook YM, Süel KE. Nuclear import by karyopherin-βs: Recognition and inhibition. Biochim Biophys Acta. 2011;1813(9):1593–1606. doi: 10.1016/j.bbamcr.2010.10.014. [DOI] [PMC free article] [PubMed] [Google Scholar]
- 25.Chook YM, Blobel G. Structure of the nuclear transport complex karyopherin-beta2-Ran x GppNHp. Nature. 1999;399(6733):230–237. doi: 10.1038/20375. [DOI] [PubMed] [Google Scholar]
- 26.Wente SR, Rout MP. The nuclear pore complex and nuclear transport. Cold Spring Harb Perspect Biol. 2010;2(10):a000562. doi: 10.1101/cshperspect.a000562. [DOI] [PMC free article] [PubMed] [Google Scholar]
- 27.Cassany A, Gerace L. Reconstitution of nuclear import in permeabilized cells. Methods Mol Biol. 2009;464:181–205. doi: 10.1007/978-1-60327-461-6_11. [DOI] [PMC free article] [PubMed] [Google Scholar]
- 28.Osborne MJ, et al. eIF4E3 acts as a tumor suppressor by utilizing an atypical mode of methyl-7-guanosine cap recognition. Proc Natl Acad Sci USA. 2013;110(10):3877–3882. doi: 10.1073/pnas.1216862110. [DOI] [PMC free article] [PubMed] [Google Scholar]
- 29.Topisirovic I, et al. Molecular dissection of the eukaryotic initiation factor 4E (eIF4E) export-competent RNP. EMBO J. 2009;28(8):1087–1098. doi: 10.1038/emboj.2009.53. [DOI] [PMC free article] [PubMed] [Google Scholar]
- 30.Volpon L, Osborne MJ, Topisirovic I, Siddiqui N, Borden KL. Cap-free structure of eIF4E suggests a basis for conformational regulation by its ligands. EMBO J. 2006;25(21):5138–5149. doi: 10.1038/sj.emboj.7601380. [DOI] [PMC free article] [PubMed] [Google Scholar]
- 31.Rosorius O, et al. Direct observation of nucleocytoplasmic transport by microinjection of GFP-tagged proteins in living cells. Biotechniques. 1999;27(2):350–355. doi: 10.2144/99272rr02. [DOI] [PubMed] [Google Scholar]
- 32.Dean KA, von Ahsen O, Görlich D, Fried HM. Signal recognition particle protein 19 is imported into the nucleus by importin 8 (RanBP8) and transportin. J Cell Sci. 2001;114(Pt 19):3479–3485. doi: 10.1242/jcs.114.19.3479. [DOI] [PubMed] [Google Scholar]
- 33.Weinmann L, et al. Importin 8 is a gene silencing factor that targets argonaute proteins to distinct mRNAs. Cell. 2009;136(3):496–507. doi: 10.1016/j.cell.2008.12.023. [DOI] [PubMed] [Google Scholar]
- 34.Yao X, Chen X, Cottonham C, Xu L. Preferential utilization of Imp7/8 in nuclear import of Smads. J Biol Chem. 2008;283(33):22867–22874. doi: 10.1074/jbc.M801320200. [DOI] [PMC free article] [PubMed] [Google Scholar]
- 35.Cansizoglu AE, Lee BJ, Zhang ZC, Fontoura BM, Chook YM. Structure-based design of a pathway-specific nuclear import inhibitor. Nat Struct Mol Biol. 2007;14(5):452–454. doi: 10.1038/nsmb1229. [DOI] [PMC free article] [PubMed] [Google Scholar]
- 36.Cingolani G, Petosa C, Weis K, Müller CW. Structure of importin-beta bound to the IBB domain of importin-alpha. Nature. 1999;399(6733):221–229. doi: 10.1038/20367. [DOI] [PubMed] [Google Scholar]
- 37.Kobayashi J, Matsuura Y. Structural basis for cell-cycle-dependent nuclear import mediated by the karyopherin Kap121p. J Mol Biol. 2013;425(11):1852–1868. doi: 10.1016/j.jmb.2013.02.035. [DOI] [PubMed] [Google Scholar]
- 38.Lee BJ, et al. Rules for nuclear localization sequence recognition by karyopherin beta 2. Cell. 2006;126(3):543–558. doi: 10.1016/j.cell.2006.05.049. [DOI] [PMC free article] [PubMed] [Google Scholar]
- 39.Topisirovic I, et al. The proline-rich homeodomain protein, PRH, is a tissue-specific inhibitor of eIF4E-dependent cyclin D1 mRNA transport and growth. EMBO J. 2003;22(3):689–703. doi: 10.1093/emboj/cdg069. [DOI] [PMC free article] [PubMed] [Google Scholar]
- 40.Delaglio F, et al. NMRPipe: A multidimensional spectral processing system based on UNIX pipes. J Biomol NMR. 1995;6(3):277–293. doi: 10.1007/BF00197809. [DOI] [PubMed] [Google Scholar]
- 41.Goddard TD, Kneller DG. 2003. Sparky 3 (University of California, San Francisco)
- 42.Schrödinger LLC. 2014. The PyMOL Molecular Graphics System (Schrödinger, LLC), Version 1.7.4.
- 43.Pettersen EF, et al. UCSF Chimera--a visualization system for exploratory research and analysis. J Comput Chem. 2004;25(13):1605–1612. doi: 10.1002/jcc.20084. [DOI] [PubMed] [Google Scholar]
- 44.Dolinsky TJ, Nielsen JE, McCammon JA, Baker NA. PDB2PQR: An automated pipeline for the setup of Poisson-Boltzmann electrostatics calculations. Nucleic Acids Res. 2004;32(Web Server issue):W665–W667. doi: 10.1093/nar/gkh381. [DOI] [PMC free article] [PubMed] [Google Scholar]
- 45.Baker NA, Sept D, Joseph S, Holst MJ, McCammon JA. Electrostatics of nanosystems: application to microtubules and the ribosome. Proc Natl Acad Sci USA. 2001;98(18):10037–10041. doi: 10.1073/pnas.181342398. [DOI] [PMC free article] [PubMed] [Google Scholar]
- 46.Culjkovic B, et al. The eIF4E RNA regulon promotes the Akt signaling pathway. J Cell Biol. 2008;181(1):51–63. doi: 10.1083/jcb.200707018. [DOI] [PMC free article] [PubMed] [Google Scholar]


