Significance
Carbonic anhydrases catalyze the fast interconversion of carbon dioxide and water into bicarbonate and proton. In this study, we use the method of high-pressure cryocooling to capture the gaseous carbon dioxide in crystals of carbonic anhydrase and follow the sequential structure changes as the carbon dioxide is released. These “snapshots” enable us to “slow down” and visualize the water and protein motions that form a “proton wire” as the carbon dioxide exits the enzyme’s active site. This study provides an understanding of the importance of water rearrangements within an enzyme-active site and further suggests that such a method could be generally applied to other protein-mediated reactions that use gaseous molecules.
Keywords: carbonic anhydrase II, CO2 release, intermediate states, high-pressure cryocooling
Abstract
Carbonic anhydrases are mostly zinc metalloenzymes that catalyze the reversible hydration/dehydration of CO2/HCO3−. Previously, the X-ray crystal structures of CO2-bound holo (zinc-bound) and apo (zinc-free) human carbonic anhydrase IIs (hCA IIs) were captured at high resolution. Here, we present sequential timeframe structures of holo- [T = 0 s (CO2-bound), 50 s, 3 min, 10 min, 25 min, and 1 h] and apo-hCA IIs [T = 0 s, 50 s, 3 min, and 10 min] during the “slow” release of CO2. Two active site waters, WDW (deep water) and WDW′ (this study), replace the vacated space created on CO2 release, and another water, WI (intermediate water), is seen to translocate to the proton wire position W1. In addition, on the rim of the active site pocket, a water W2′ (this study), in close proximity to residue His64 and W2, gradually exits the active site, whereas His64 concurrently rotates from pointing away (“out”) to pointing toward (“in”) active site rotameric conformation. This study provides for the first time, to our knowledge, structural “snapshots” of hCA II intermediate states during the formation of the His64-mediated proton wire that is induced as CO2 is released. Comparison of the holo- and apo-hCA II structures shows that the solvent network rearrangements require the presence of the zinc ion.
Carbonic anhydrases (CAs) are mostly zinc metalloenzymes that catalyze the reversible hydration/dehydration of CO2/HCO3− (general reviews are in refs. 1–5). In the hydration direction, the first step of catalysis is the conversion of CO2 into bicarbonate through the nucleophilic attack of the reactive Zn-bound hydroxide, and the resultant bicarbonate is subsequently displaced from the zinc by a water molecule (expression 1) (6). The second step of catalysis is the transfer of a proton from the Zn-bound water to bulk solvent for the regeneration of the Zn-bound hydroxide. The general base for proton transfer (PT), B, can be either a proton acceptor in solution (water) or a residue (His64) in the enzyme (expression 2):
| [1] |
and
| [2] |
There are 16 mammalian CAs, of which human carbonic anhydrase II (hCA II) is the best studied because of its role in many physiological processes (4, 5, 7). hCA II, like all mammalian CAs, belongs to the α-class CAs based on their structural homology (8). The active site zinc is located deep within a 15-Å-deep cleft and tetrahedrally coordinated by three histidines (His94, His96, and His119) and a Zn-bound solvent (WZn) (2). The active site cavity is further subdivided into two distinct sides of hydrophobic (consisting of Val121, Val143, Leu198, Thr199-CH3, Val207, and Trp209) and hydrophilic (consisting of Tyr7, Asn62, His64, Asn67, Thr199-Oγ1, and Thr200-Oγ1) residues. The hydrophobic side sequesters and orients the CO2 for nucleophilic attack by the Zn-bound hydroxide (expression 1 and Fig. 1) (9).
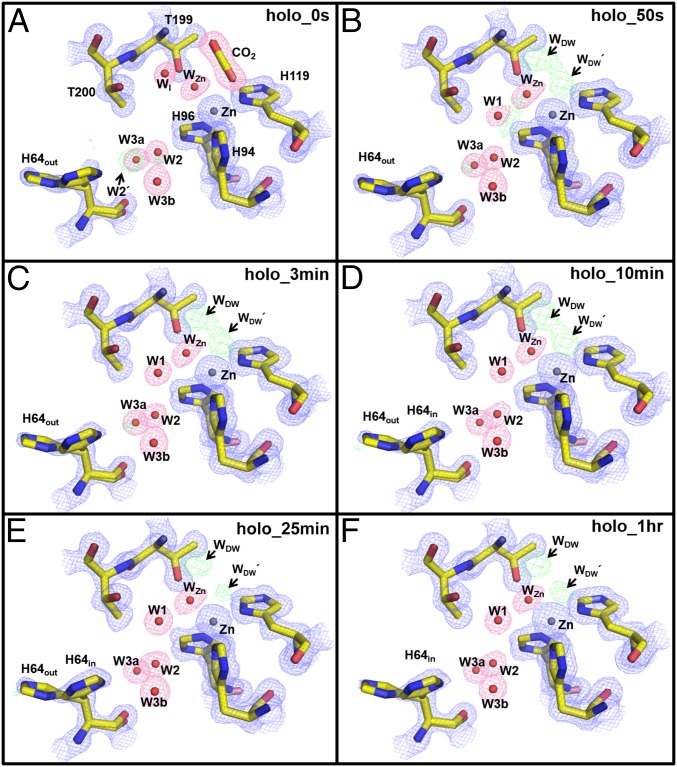
Fig. 1.
Holo-hCA II active site solvent structure during CO2 release: (A) 0 s, (B) 50 s, (C) 3 min, (D) 10 min, (E) 25 min, and (F) 1 h. Electron density 2Fo-Fc (blue) and Fo-Fc (green) maps are contoured at 1.5σ and 5.0σ, respectively. The 2Fo-Fc maps for waters and CO2 are highlighted in pink for clarity. Note the omitted density of W2′ (in A) and the appearance of WDW and WDW′ (CO2-substituting solvent in E and F). Also, WI is only observed in the CO2-bound hCA II (in A) as opposed to W1 (in B–F). Solvent and amino acids are as labeled.
The hydrophilic side of the active site coordinates a hydrogen-bonded solvent network (W1, W2, W3a, and W3b) that connects the Zn-bound solvent to His64 and is believed to be involved in the transfer of a proton from the Zn-bound water to bulk solvent for the regeneration of the Zn-bound hydroxide (expression 2 and Fig. 1) (10, 11). Thr199 forms a hydrogen bond to the WZn that, in turn, is hydrogen-bonded to W1. W1 is further stabilized by Thr200 and the next solvent in the chain, W2. The solvent network then branches, because W2 is hydrogen-bonded to both W3a and W3b. W3a is further coordinated by the hydroxyl group of Tyr7, whereas W3b is stabilized by Asn62 and Asn67 (12, 13). This solvent network has been previously shown to be conserved over a broad pH range (pH 5.0–10.0) and localizes W2, W3a, and W3b all in close proximity to the side chain of His64 when orientated in the “in” conformation (pointing toward the active site) (9, 11, 14, 15).
The structural examination of hCA II at near atomic resolution revealed that the solvent molecule W2 (the only ordered solvent molecule in the active site stabilized exclusively by other solvent molecules) is trigonally coordinated with equal distance (2.75 ± 0.02 Å) by W1, W3a, and W3b (16). Within this cluster of solvent molecules, only W2 is in the plane of the imidazole ring of His64 and within hydrogen-bonding distance of His64. It is thought that, when in an in conformation, His64 and the Zn-bound water with pKa values of ∼7 facilitate the proton shuttling process (Fig. 1) (17, 18).
Previously, the crystallographic capture of CO2 in the active site of hCA II was achieved by high-pressure cryocooling of crystals (19, 20). The visualized CO2 was bound in the hydrophobic one-half of the conical active site in identical orientations in both holo and apo crystal structures, indicating that stabilization of the substrate is independent of the active site zinc ion as previously hypothesized, and it seems to be solely dependent on the hydrophobicity of the binding pocket (21). In the absence of CO2 substrate, an additional active site solvent molecule termed deep water (WDW) resides in the hydrophobic pocket in unbound crystal structures. In crystal structures with bound CO2 substrate, the stabilized substrate was found to displace the WDW from its position; the WDW displacement by CO2 is most likely a consequence of the higher propensity of CO2 for the hydrophobic pocket than water (20).
In this study, we have further developed this method to examine intermediate states of hCA II during the gradual release of CO2. We incubated the CO2-bound holo- and apo-hCA II crystals at room temperature (RT) for various incubation periods and flash-cooled them before subjecting them to X-ray diffraction data collection. Here, we describe various structural changes in the active site solvent network and the in and “out” conformations of His64 (the proton shuttle residue) as the CO2 gas gradually escapes the hCA II crystals over a time course of 1 h. Contrasting these structures with CO2-bound hCA II structure has revealed important features in the active site and provided additional insight into the enzymatic mechanism of hCA II.
Results and Discussion
CO2 Release: Active Site (CO2/WZn/WDW/WDW′/WI/W1) Holo-hCA II.
To analyze the dynamics of solvent and track amino acid conformational changes during CO2 release in the active site, intermediate states of holo-hCA II were prepared by incubating the CO2 pressurized holo-hCA II crystals at RT for time intervals [0 s (no incubation), 50 s, 3 min, 10 min, 25 min, and 1 h] and flash-cooling them to 100 K before X-ray diffraction data collection. The crystal incubation times at RT (from 50 s to 1 h) were carefully chosen to gradually drop the partial pressure of CO2 in the holo-hCA II crystals. In this way, the holo-hCA II states were gradually shifted from the CO2-bound state to the CO2-free state (SI Materials and Methods).
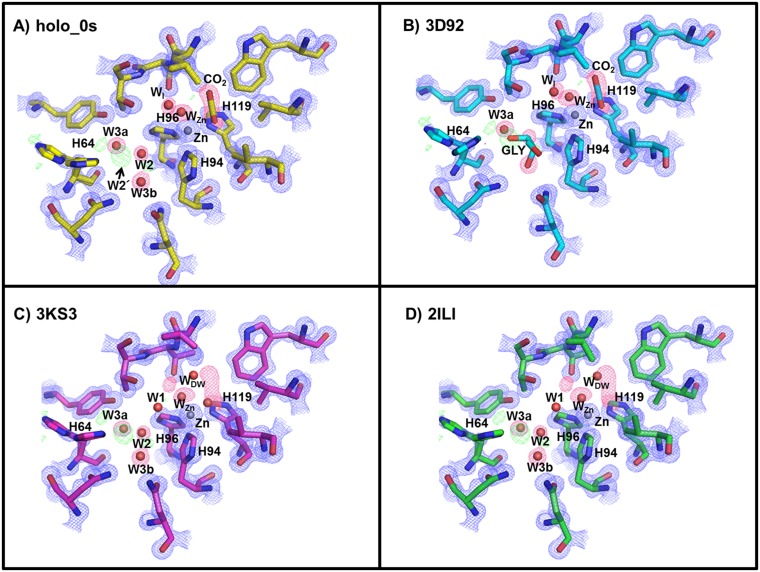
The CO2-bound holo-hCA II (0 s; no incubation) was compared with the previously reported structures of CO2-bound holo-hCA II [Protein Data Bank (PDB) ID code 3D92 (20); all atom rmsd = 0.30 Å] and CO2-free holo-hCA II [PDB ID codes 3KS3 (18) and 2ILI (22)] and as expected, showed that the starting CO2-bound state was identical to that reported in 3D92. The positions of amino acids forming the active site around the zinc and the WZn were also identical in the CO2-free holo-hCA IIs with all atom rmsd = 0.43 Å (3KS3), 0.53 Å (2ILI), and 0.62 Å (3D93) (Fig. S1).
Fig. S1.
Holo-hCA II active site. Comparisons of (A) holo-hCA II (yellow; 0 s) CO2-bound and (B) the previously reported CO2-bound (cyan; PDB ID code 3D92) structures. Superposed electron density map from A (0 s) onto holo-hCA II CO2 free in C (magenta; PDB ID code 3KS3) and D (green; PDB ID code 2ILI). The 2Fo-Fc (blue) and Fo-Fc (green) electron density maps are contoured at 2.0σ and 4.0σ, respectively. The 2Fo-Fc maps for waters and CO2 are highlighted in pink for clarity. Note that the electron density modeled as glycerol in 3D92(B) is W2 and W3b in the CO2-free holo-hCA IIs (C and D). Also, observe that WI in the CO2-bound hCA II (A and B) is not observed in the CO2-free holo-hCA II and instead, that W1 is positioned in the solvent network (C and D).
The CO2-bound holo-hCA II crystals incubated at RT (50 s, 3 min, 10 min, and 25 min) showed a gradual deterioration of electron density where the CO2 was previously bound (i.e., at 0 s), with negligible changes in the surrounding zinc and coordinating histidines (His94, His96, and His119). The electron density changes form from bound CO2 (0 s) to two connected lobes (50 s, 3 min, and 10 min) to two separate and distinct spherical densities (25 min and 1 h) (Fig. 1). The observed change in electron density suggests that, as CO2 leaves the active site, the void space is replaced by two water molecules. Interestingly, the density profile does not indicate the formation of bicarbonate; instead, it indicates the slow removal of CO2, suggesting that the pH of the crystal is too acidic for the hydration reaction, indicative of a Zn-bound water. In the two lobes of electron densities, the one nearest Thr199 represents deep water (WDW), which is also well-ordered in the CO2-free holo-hCA II (Fig. S1 C and D). The second lobe represents a water molecule that was also previously observed in the CO2-free holo-hCA II (3KS3) (Fig. S1C) (18). We refer to this water as WDW′. In all of the incubation series, WDW and WDW′ that replace CO2 are observed nearer to the WZn than CO2. However, the distance between WDW and WDW′ (∼2.1 Å) indicates that the two waters can only be partially occupied. Of note, the distance between the zinc and WDWʹ (∼2.6 Å) is significantly longer than the distances between zinc and its coordinating WZn, His94, His96, and His119, which have distances of ∼2.0 Å (Fig. 2).
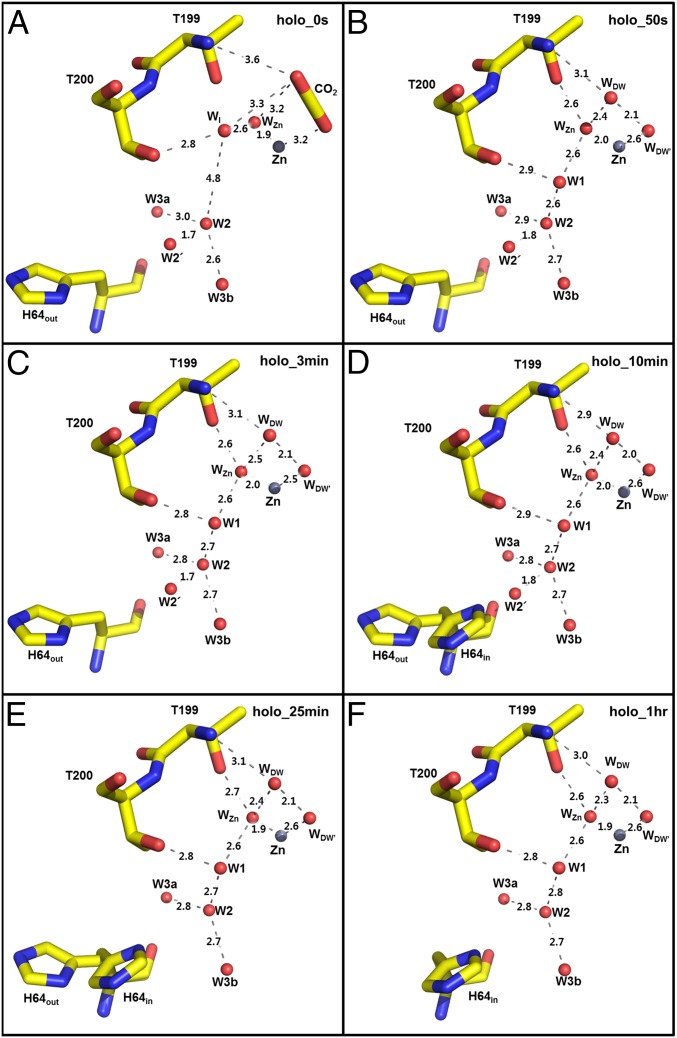
Fig. 2.
Holo-hCA II active site solvent network during CO2 release: (A) 0 s, (B) 50 s, (C) 3 min, (D) 10 min, (E) 25 min, and (F) 1 h. Hydrogen bond distances (angstrom) are depicted as dotted lines. The major conformation of His64 is in the out positions for 0 s, 50 s, and 3 min (A–C) and the in position at 1 h (F). Solvent and amino acids are as labeled.
Previously, the CO2-bound holo-hCA II structure (PDB ID code 3D92) revealed a newly observed water termed water intermediate, WI, located near Thr199, which had not been observed in other CO2-free hCA II structures (Fig. S1) (20). The density for WI in our holo-hCA II T = 0 s structure confirms that WI is present when CO2-bound (Fig. 1). The distance between WI and W2 is 4.8 Å, which suggests that the hydrogen-bonded solvent network for the PT breaks as CO2 binds in the active site (Fig. 2). However, the WI has shifted or was left in the active site for all subsequent incubation time points, coinciding with the restoration of W1 (Figs. 1 and 2). The data indicate that the hydrogen bonding in the active site water cluster of holo-hCA II is restored on the release of CO2, establishing a molecular pathway for shuttling protons between the bulk solvent and the catalytic center.
His64 and the W1/W2′/W2/W3a/W3b Water Network in Holo-hCA II.
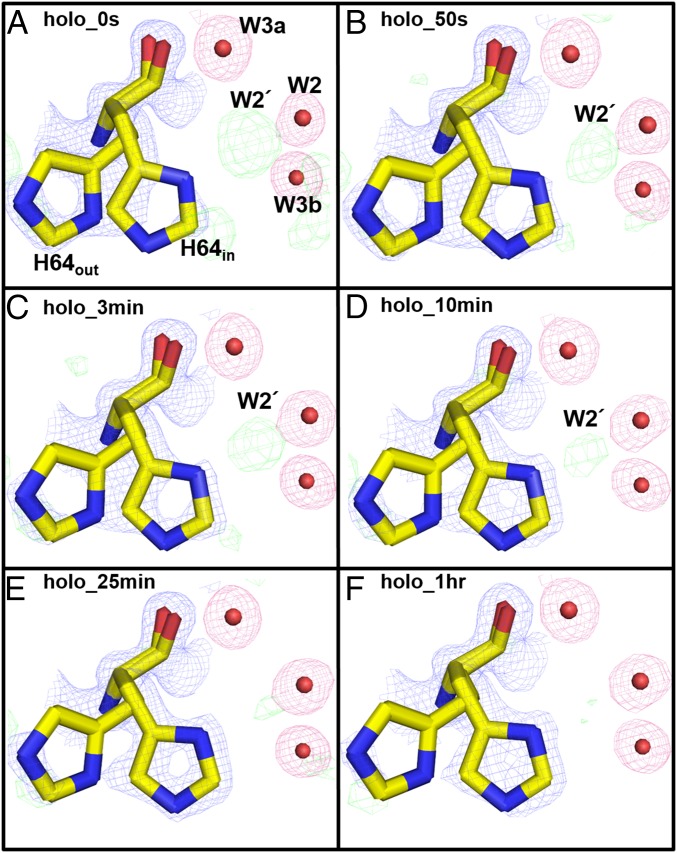
The proton shuttling residue, His64, has previously been shown to exhibit two configurations, pointing toward (in) and pointing away (out) from the active site, depending on the Cα–Cβ bond rotation (9, 23). Also, His64 and the solvent network (W1, W2, W3a, and W3b) have been proposed to be critical for the PT (expression 1) and the rate-limiting step in holo-hCA II turnover (11). During the CO2 time-released experiments, the His64 configuration in the holo-hCA II series gradually transitions from the out to the in position (Fig. 3). Previously, the pH effect on the His64 configurations was suggested where His64 favors the out position at low pH and the in position at high pH (9). Accordingly, in this study, the CO2 pressurization would lower the pH of the holo-hCA II crystals to less than pH 6 and result in His64 to occupy the out position (20). As the CO2 in the crystal is gradually released, restoration of a higher pH would shift the His64 conformation into an in position, with it fully occupying the in conformer at 1 h (Fig. 3).
Fig. 3.
Holo-hCA II rotameric states of His64: (A) 0 s, (B) 50 s, (C) 3 min, (D) 10 min, (E) 25 min, and (F) 1 h. Electron density 2Fo-Fc (blue) and Fo-Fc (green) maps are contoured at 1.5σ and 3.0σ, respectively. The 2Fo-Fc maps for waters are highlighted in pink for clarity. On CO2 release and gradual dissipation of W2′, the His64 side chain shifts from the out to the in position. Solvent and amino acids are as labeled.
In addition, electron density likely representing a water, W2′, between His64 and W2 in the holo-hCA II series was observed (Figs. 1A and 3A and Fig. S1). This water density gradually dissipates with time, is gone after 25 min, a consequence of CO2 release, and leaves a vacant space for His64 to occupy the in conformation (Figs. 1 and 3). In the previous CO2-bound holo-hCA II structure [PDB ID code 3D92 (20)], a glycerol molecule was modeled in this region (Fig. S1B). In this study, these electron densities near His64 were built as the water molecules (W2ʹ, W2, and W3b) and part of the solvent network (Fig. 3).
The observation of W2′ between W2 and His64 gradually disappearing in the holo-hCA II time series suggests that W2′ is an alternate position of W2 (the 1.7-Å distance between W2′ and W2). The fact that the side chain of His64 moves from an out to an in position coincides with the loss of W2′, suggesting that His64 out position permits both water positions W2 and W2′, whereas His64 in position crystallographically favors a water position at W2 because of steric hindrance. However, considering the dynamical in and out movement of His64, the water W2′ can be sufficiently close enough to form a hydrogen bond to His64 when it moves inwards. This observation provides evidence for the role of W2 in the PT. Previously, it was unclear which water molecule among W2, W3a, and W3b that surround His64 actually performs the transfer of a proton to His64, because they were always highly ordered but all too far (3.3–3.8 Å) for His64 to form a hydrogen bond. These data suggest that W2 and W2′ are likely the bridging waters to the nitrogen of His64, forming the proton wire. Also, contrary to the observed dynamics of His64 and W2/W2′, it is interesting to note that the distances between W1, W2, W3a, and W3b are invariant in the holo-hCA II incubation series (Fig. 2).
It should also be noted that the dynamics of His64 have also been coupled to small molecules that can activate the enzyme catalytic rate, termed “activators,” which bind in the vicinity of His64 and are distinguished from inhibitors, because they bind away from the substrate binding site (24). These transient enzyme activator complexes significantly enhance catalysis by speeding up the rate-limiting PT step through an intramolecular process (25). The initial X-ray structures of enzyme activator complexes were mostly reported as in conformers of His64 (26–28); however, subsequently, out conformation of His64 has also been observed (29). These observations show how dynamic the active site is and why understanding the motion of solvent in the active site is critical to fully understanding the enzyme’s mechanism.
CO2 Release: Active Site (CO2/WZn/WDW/WDW′/WI/W1) Apo-hCA II.
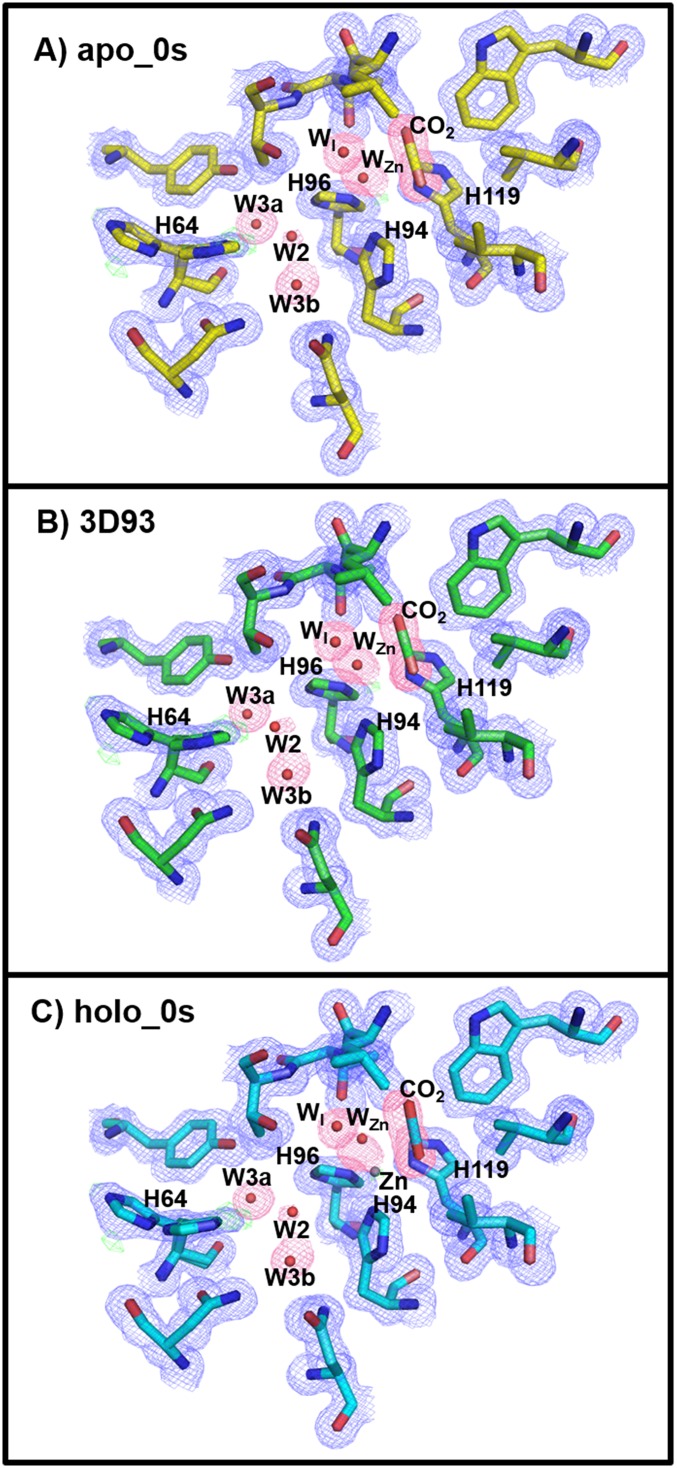
In a similar set of experiments, crystals of apo-hCA II (zinc removed) were also CO2-pressurized, incubated at RT at time intervals [0 s (no incubation), 40 s, 3 min, and 10 min], and flash-cooled to 100 K before diffraction experiment (SI Materials and Methods). Structural comparison of the apo-hCA II (0 s; no incubation) with the previously determined CO2-bound apo-hCA II structure [PDB ID code 3D93 (20)] was shown to be identical (all atom rmsd = 0.58 Å) (Fig. S2).
Fig. S2.
Apo-hCA II active site. Comparisons of (A) apo-hCA II (yellow; 0 s) CO2-bound and (B) the previously reported CO2-bound (cyan; PDB ID code 3D93) structures. The 2Fo-Fc (blue) and Fo-Fc (green) electron density maps are contoured at 1.0σ and 4.0σ, respectively. The 2Fo-Fc maps for waters and CO2 are highlighted in pink for clarity. (C) Superposed electron density map from apo-hCA II (A; 0 s) onto CO2-bound holo-hCA II (cyan; 0 s). Note the identical positions of CO2, WZn, WI, W2, W3a, and W3b, except for the presence of the zinc in the holo-hCA II.
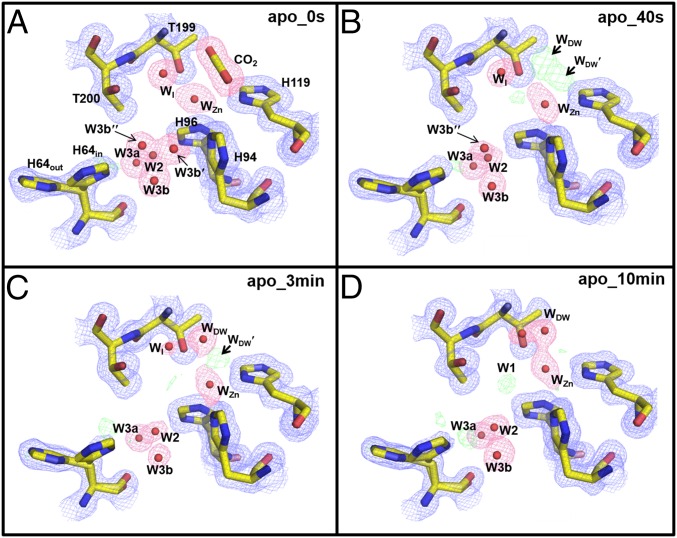
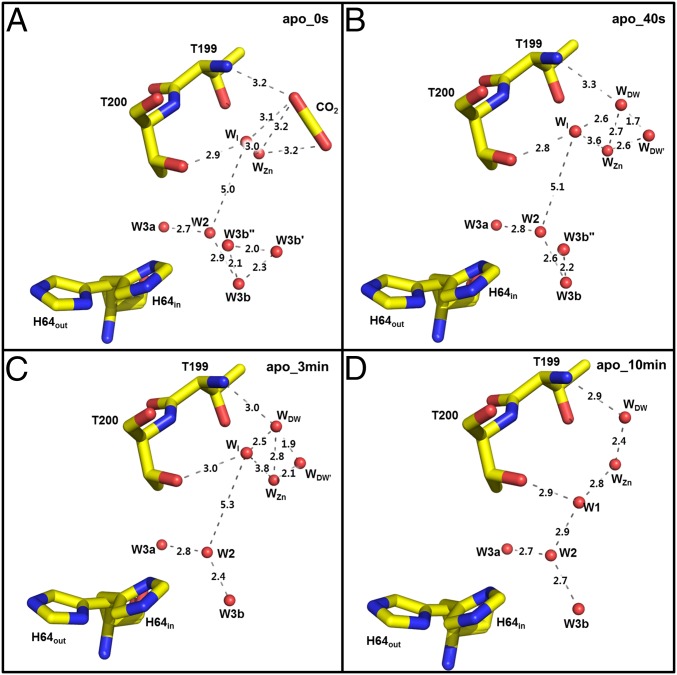
Analysis of the apo-hCA II four incubation time points (0 s, 40 s, 3 min, and 10 min) showed gradual changes of electron density near the CO2 binding site with negligible changes in the active site histidines (His94, His96, and His119) (Fig. 4). As seen with the holo-hCA II structures, the electron density profile shifted inward toward the WZn, forming two distinct spheres (WDW and WDW′). However, the continuous lobes in the apo-hCA II separate into the two isolated WDW and WDW′ between 3 and 10 min; it happened at a shorter timescale compared with that of the holo-hCA II, which happened between 10 and 25 min. As observed in the holo-hCA II, the distance between WDW and WDW′ was short, suggesting that the two waters can only be partially occupied (Fig. 5). Also, in the apo-hCA II, the electron density representing WDW′ is diminished at 10 min, which is in contrast to the consistent WDW′ density in the holo-hCA II. These observations may be explained in the following way. The connected density for WDW and WDW′ indicates that CO2 is still partially occupied along with WDW and WDW′. In the apo-hCA II, as CO2 diffuses out, the electron density of CO2 gradually decreases, and its density is simply replaced by WDW and WDW′. However, as CO2 diffuses out in the holo-hCA II, the reverse reaction of holo-hCA II (expression 1) converts water-resolved bicarbonate to CO2, which may be maintaining CO2 partial occupancy in the active site for a longer time. The presence of the zinc in the holo-hCA II seems to make WDW′ more stable, which remains unclear.
Fig. 4.
Apo-hCA II active site solvent structure during CO2 release: (A) 0 s, (B) 50 s, (C) 3 min, and (D) 10 min. Electron density 2Fo-Fc (blue) and Fo-Fc (green) maps are contoured at 1.5σ and 5.0σ, respectively. The 2Fo-Fc maps for waters and CO2 are highlighted in pink for clarity. Note that the two solvent molecules in close proximity to W3b are observed only at 0 s (A) . As was observed for the holo-hCA II, WDW and WDW′ substitute the released CO2. Solvent and amino acids are as labeled.
Fig. 5.
Apo-hCA II active site solvent network during CO2 release: (A) 0 s, (B) 50 s, (C) 3 min, and (D) 10 min. Hydrogen bond distances (angstrom) are depicted as dotted lines.
As observed with the holo-hCA II at 0 s, WI is present in the active site when CO2 is bound (Figs. 4 and 5). However, in contrast to WI leaving the active site and W1 appearing relatively rapidly (before 50 s) in the holo-hCA II, WI still exists in the apo-hCA II at 3 min and only leaves when W1 appears at 10 min. In the apo-hCA II, the WI to W1 shift takes place “more slowly” in contrast to the “faster solvent” changes for WDW and WDW′. In both holo-hCA II and apo-hCA II, W1 is stabilized by making hydrogen bonds with Thr200 and W2 water. Interestingly, the electron density of W2 is significantly weaker in the early apo-hCA II incubation series than in the holo-hCA II incubation series (see below). This weak W2 suggests that W1 position is relatively destabilized in the apo-hCA II, which may explain why the WI to W1 shift is slower in apo-hCA II than in holo-hCA II.
His64 and the W1/W2′/W2/W3a/W3b Water Network in Apo-hCA II.
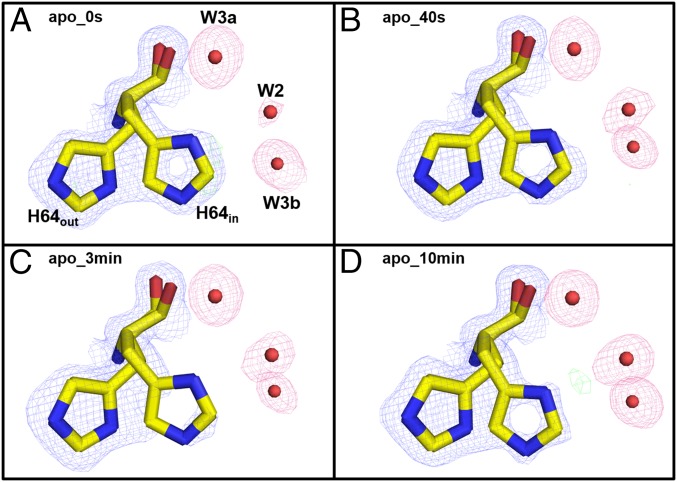
In the apo-hCA II incubation series, the solvent network of W2′ and W2 differs from that of holo-hCA II. In the apo-hCA II at 0 s structure, there is no observable density for W2′ and only faint density for W2 (Fig. 6 and Fig. S2). Also, the two waters (termed as W3b′ and W3b″) unobserved in holo-hCA II near W3b at 0 s were observed in the counterpart apo-hCA II at 0 s (Figs. 4 and 5). W3b′ was also observed in the previous CO2-bound apo-hCA II structure (PDB ID code 3D93). The presence of the new waters W3b′ and W3b″ in the apo-hCA II reflects the altered electrostatic environment of the active site in the absence of Zn at the saturation of CO2 under high pressure. They gradually disappear over time, and the passive escape of CO2 gas from the active site most likely perturbs their stability. The most notable difference is the lack of any conformational changes in the apo-hCA II incubation series of His64 during CO2 release, unlike holo-hCA II (Figs. 3 and 6). These observations reiterate the importance of the zinc for not only its catalytic role but also, the proper rearrangement of the solvent network, which is necessary for efficient PT. In the absence of PT in the apo-hCA II, the side chain of His64 is mostly locked in the out conformation, whereas the holo-hCA II with an intact PT displays dual occupancy for the side chain of His64. It appears that the orientation of the side chain of His64 is effectively controlled by the electrostatic influence of the Zn. The pKa values of His64 and Zn solvent titrate to 7.2 and 6.8, respectively, and the pH profile for enzymatic activity fits to a single ionization. Although the ordered water molecules appear in nearly identical coordinates in both apo- and holo-hCA II, the apo-hCA II does not carry a low-barrier hydrogen bond (LBHB) that exists between Zn solvent and WDW, which is a significant contributor toward catalysis. The enthalpy of formation of LBHB is nearly fourfold higher than the hydrogen bonds typical of water molecules, and its formation lowers the pKa and enhances the protolysis of the Zn solvent. The energy released and absorbed during the formation and cleavage of the LBHB during each cycle of catalysis likely influences the side chain dynamics of His64 and the movement of W2 to W2′. Lack of this LBHB may be the reason for not observing W2′ and His64 side chain dynamics in the apo-hCA II. Additional research is needed to clearly understand the role of zinc for the observed solvent rearrangements, solvent dynamics, and His64 movements in the holo- and apo-hCA II.
Fig. 6.
Conformation of His64 in apo-hCA II: (A) 0 s, (B) 50 s, (C) 3 min, and (D) 10 min. The 2Fo-Fc (blue) and Fo-Fc (green) electron density maps are contoured at 1.0σ and 5.0σ, respectively. The 2Fo-Fc maps for waters are highlighted in pink for clarity. There is no evidence of a preferable His64 position (in vs. out) or W2′ (except maybe in D).
Secondary CO2 Binding Site Near Phe226.
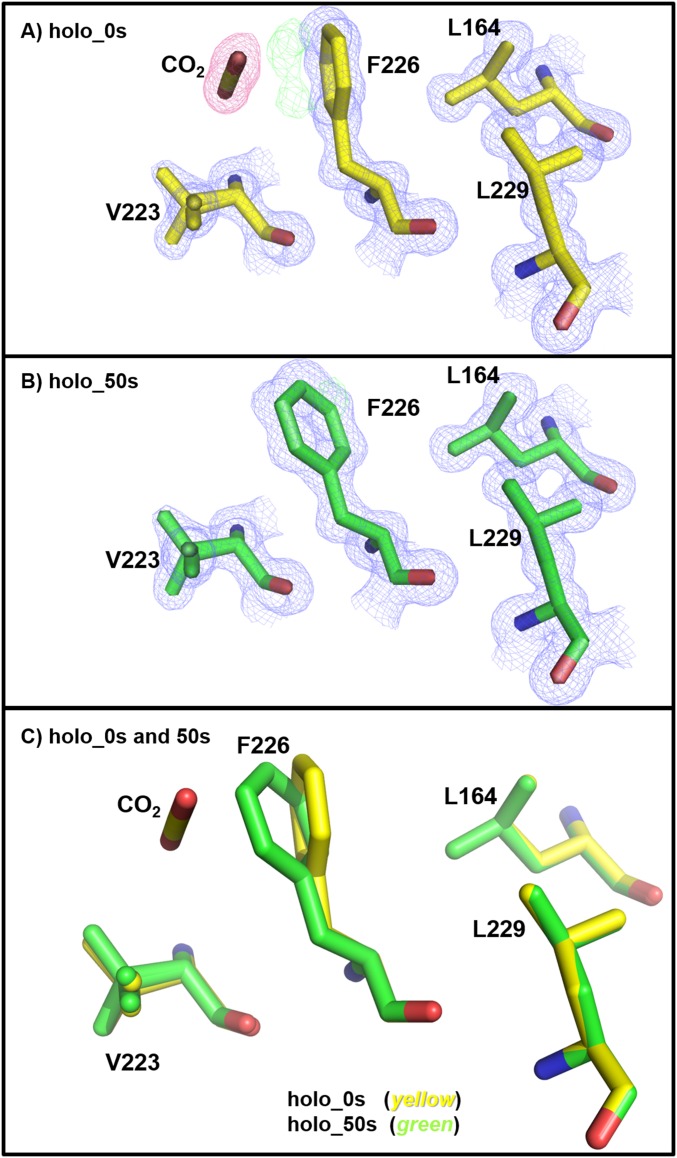
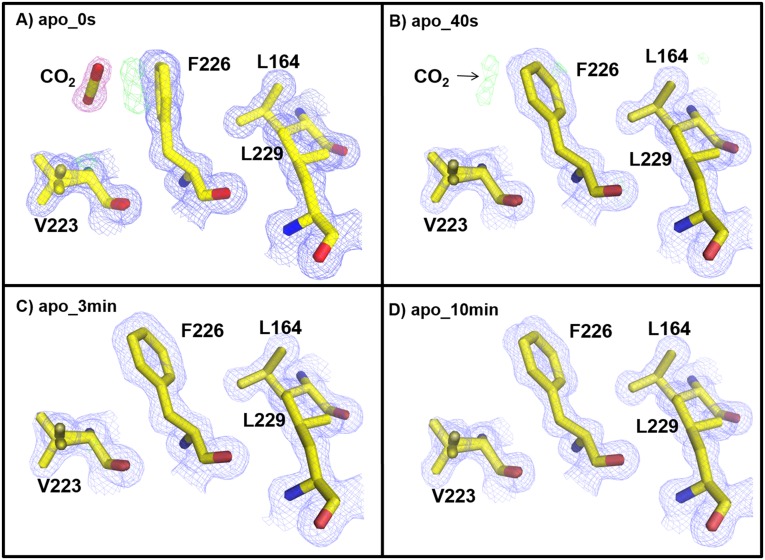
Previously, a secondary CO2 binding site was reported in the structures of CO2-bound holo- and apo-hCA II [PDB ID codes 3D92 and 3D93 (20)]. Similarly, in holo- and apo-hCA II 0 s (no incubation), this secondary CO2 is presently located in a hydrophobic pocket near Phe226 (Figs. S3 and S4). In the holo-hCA II incubation series, by 50 s, the CO2 seems dissipated, and the Phe226 side chain is rotated back to the position observed in the CO2-free state of hCA II (Fig. S3). However, for the apo-hCA II, at the 40-s time point, the electron density for the CO2 faintly existed, and at the 3-min point, it had gone (Fig. S4). It is still unclear whether the secondary binding/release of the substrate CO2 functionally affects the catalytic function of the enzyme, and this phenomenon needs additional investigation.
Fig. S3.
Secondary CO2 binding site in holo-hCA II: (A) 0 s (yellow) and (B) 50 s (green). The 2Fo-Fc (blue) and Fo-Fc (green) electron density maps are contoured at 1.2σ and 3.0σ, respectively. The 2Fo-Fc map for CO2 is highlighted in pink for clarity. (C) Superposition of (A) 0 s (yellow) onto (B) 50 s (green). Note the change of conformation of the Phe226 side chain on CO2 release.
Fig. S4.
Secondary CO2 binding site in apo-hCA II: (A) 0 s, (B) 40 s, (C) 3 min, and (D) 10 min. The 2Fo-Fc (blue) and Fo-Fc (green) electron density maps are contoured at 1.2σ and 3.0σ, respectively. The 2Fo-Fc map for CO2 is highlighted in pink for clarity. Note the different orientation of the Phe226 side chain in A compared with those in B–D.
SI Materials and Methods
Protein Purification and Crystallization.
Holo-hCA II was expressed in a recombinant strain of Escherichia coli [BL21 (DE3) pLysS] containing a plasmid encoding the hCA II gene (34). Purification was carried out using affinity chromatography as described previously (33). Briefly, bacterial cells were enzymatically lysed with hen egg white lysozyme, and the lysate was placed onto an agarose resin coupled with p-(aminomethyl)-benzene-sulfonamide, which binds hCA II. hCA II was eluted with 0.4 M sodium azide in 100 mM Tris⋅HCl, pH 7.0. The azide was removed by extensive buffer exchange against 10 mM Tris⋅HCl, pH 8.0.
Preparation of the Apo-hCA II.
Apo-hCA II (zinc-free) was prepared by incubation of holo-hCA II in a zinc chelation buffer [100 mM pyridine 2,6-dicarboxylic acid, 25 mM 3-(N-morpholino)propanesulfonic acid (MOPS), pH 7.0] at 20 °C for 8 h. The chelating agent was then removed by buffer exchange against 50 mM Tris⋅HCl, pH 7.8 (35). The loss of enzyme activity was verified using kinetic studies. The enzyme activity was revived by an addition of 1 mM ZnCl2.
Crystallization.
Crystals of holo- and apo-hCA II were obtained using the hanging drop vapor diffusion method (37). A 10-μL drop of equal volumes of protein (5 μL) and the well solution (5 μL) was equilibrated against 1 mL well solution (1.3 M sodium citrate, 100 mM Tris⋅HCl, pH 7.8) at RT (∼20 °C) removed (22). Crystals grew to ∼0.1 × 0.1 × 0.3 mm in size in a few days.
CO2 Entrapment and RT Crystal Incubation.
The CO2 entrapment was carried out as described in a previous report (20). The holo- and apo-hCA II crystals were first soaked in a cryosolution containing 30–40% (vol/vol) glycerol supplemented to the reservoir solution. The crystals were then coated with mineral oil (NVH oil; Hampton Research) to prevent dehydration and loaded into the base of high-pressure tubes (19). After they were in the pressure tubes, the crystals were pressurized with the CO2 gas (15 atm) at RT. After 25 min, the crystals were cryocooled to liquid nitrogen temperature (77 K) without releasing the CO2 gas. To capture the intermediate states during CO2 release, the CO2-bound crystals were warmed from 100 K and incubated at RT by dipping them into a mineral oil bath at 20 °C. The CO2-bound holo-hCA II crystals were incubated for 50 s, 3 min, 10 min, 25 min, and 1 h before flash-cooling them to 100 K in the nitrogen cold stream. Specifically, the incubation time includes three physical experimental steps: transferring CO2-bound crystals from cold stream to the mineral oil at RT (within 1–2 s), incubating crystals in the mineral oil, and cryocooling them back to 100 K (within 1–2 s). A CO2-bound crystal (no incubation: labeled as 0 s) was used for data collection as a control. The CO2-bound apo-hCA II crystals were treated in the same way by incubating at RT for 40 s, 3 min, and 10 min before cooling them to 100 K.
Although the catalytic reaction of hCA II occurs on the microsecond timescale, we believe that the intermediate states of hCA II during CO2 release could be captured over this longer experimental timescale for the following reasons. When the oil-coated hCA II crystals are initially pressurized with CO2 gas (15 atm), the pH in the crystal becomes acidic, and the zinc-bound solvent (pKa ∼ 7.0) stays as a water molecule. Hence, CO2 substrate can be trapped in the active site. Subsequently, when the CO2-bound crystals are warmed and incubated in mineral oil at RT, the CO2 can diffuse away slowly, because the hydrophobic oil around the crystals holds CO2 very efficiently compared with the aqueous solutions. Because the CO2 partial pressure drops slowly in the hCA II crystals, the pH of the crystal remains still below 7.0 for the early incubation time periods. Incubating crystals in a mineral oil was a crucial step towards capturing the series of intermediate hCA II states during the slow CO2 release.
The buffering effect of the NVH oil for a hydrophobic gas was systematically studied and described in our previous paper (36). In that study, oil-coated porcine pancreas elastase crystals were initially pressurized with krypton gas at 4 MPa (40 atm) and left at ambient condition (RT and 0 atm krypton gas) to study how fast krypton gas molecules diffuse out of the crystals. The result showed that krypton gas molecules diffuse very slowly out of the oil-coated elastase crystals (krypton molecule was still partially occupied in crystallographic structures even after 9 min). The slow diffusion of krypton gas was interpreted as caused by higher solubility of krypton in oil; therefore, oil around the crystals acted as a krypton-buffering medium. This interpretation was supported by the remaining strong krypton fluorescence signals from the oil-coated crystals. The same buffering effect was expected for CO2, because both krypton and CO2 are fully hydrophobic gas molecules and show significantly higher solubility in oil than in aqueous solutions. The CO2-buffering effect of mineral oil (therefore a slow diffusion of CO2 out of hCA II crystals) was supported by the apo-hCA II 40-s structure, where the electron density of the CO2 molecule was still visible in the secondary binding site next to Phe226 (Fig. S4B). Note that the mineral oil used in the study is water-immiscible; therefore, oil coating around the hCA II crystals has negligible effect on the observed dynamics of water and His64 inside hCA II.
It should be emphasized that the experimental crystal incubation timescale indicates the timescale that CO2 diffuses out of the hCA II crystals rather than the much faster catalytic reaction timescale of hCA II. Indeed, our incubation time at RT (40–50 s to 1 h) was carefully selected to tune the partial pressure of CO2 in the hCA II crystals. Because CO2 diffuses out of the crystals slowly, at each point in time, there is presumably equilibrium between the CO2 in oil around the crystal and the CO2 in the intracrystal water. The partial pressure of gas in the crystals falls gradually with longer oil-soaking time as gas diffuses into the oil. Therefore, these observed structures show the most stable and dominant intermediate states of hCA II as CO2 partial pressure drops from 15 to 0 atm. In this regard, it is believed that the observed structures provide snapshots of structural changes that hCA II undergoes as CO2 molecules exit the protein.
X-Ray Diffraction and Data Collection.
Diffraction data were collected at Cornell High Energy Synchrotron Source beamline F2 (wavelength of 0.9795 Å and beam size of 150 μm) under nitrogen cold stream (100 K). Data were collected using the oscillation method in intervals of 1° steps on an ADSC Quantum 210 CCD Detector (Area Detector Systems Corp.) with a crystal to detector distance of 110 mm. In total, 360 images were collected on each of the holo- and apo-hCA II crystal datasets. Six datasets were collected for holo-hCA II (0 s, 50 s, 3 min, 10 min, 25 min, and 1 h), and four datasets were collected for apo-hCA II (0 s, 40 s, 3 min, and 10 min). For each dataset, a new fresh crystal was pressure-cryocooled and incubated as described above. Afterward, the crystal was frozen back to 100 K, and a single X-ray diffraction dataset was collected. It is clear that the rate of CO2 release had not been perturbed by X-ray radiation, because X-ray data collection was carried out after crystal incubation. In addition, we calculated the total absorbed X-ray dose for each crystallographic dataset in our study. The absorbed X-ray dose was ∼3 × 10⁶ Gy, which is much less than the Henderson dose limit of 2 × 10⁷ Gy (38). Moreover, we have checked that X-ray radiation dose at least up to 107 Gy does not induce apparent changes in the active site. The result indicates that the active site changes described in our study are not induced by the X-ray radiation. Indexing, integration, and scaling were performed by using HKL2000 (39). Processing statistics are given for the holo- and apo-hCA II incubation series (Tables S1 and S2, respectively).
Table S1.
Data collection and refinement statistics for holo-hCA II incubation series
| Time | 0 s | 50 s | 3 min | 10 min | 25 min | 1 h |
| Data collection | ||||||
| Space group | P21 | P21 | P21 | P21 | P21 | P21 |
| Cell dimensions (Å) | ||||||
| a | 42.28 | 42.26 | 42.19 | 42.23 | 42.21 | 42.22 |
| b | 41.45 | 41.29 | 41.30 | 41.25 | 41.26 | 41.24 |
| c | 72.11 | 72.09 | 72.09 | 72.05 | 72.07 | 71.96 |
| β (°) | 104.14 | 104.27 | 104.17 | 104.22 | 104.22 | 104.19 |
| Resolution (Å) | 50–1.20 (1.22–1.20)* | 50–1.25 (1.27–1.25)* | 50–1.30 (1.32–1.30)* | 50–1.45 (1.48–1.45)* | 50–1.30 (1.35–1.30)* | 50–1.45 (1.48–1.45)* |
| Rsym (%) | 5.6 (59.6) | 5.5 (46.6) | 7.8 (54.4) | 7.8 (56.5) | 6.6 (47.4) | 7.7 (43.8) |
| I/σ(I) | 30.4 (1.9) | 34.3 (2.5) | 26.3 (2.9) | 28.0 (3.4) | 31.9 (3.8) | 28.5 (3.9) |
| Completeness (%) | 96.0 (65.8) | 98.8 (86.0) | 99.6 (98.4) | 99.7 (99.2) | 98.3 (96.2) | 100 (100) |
| Redundancy | 6.7 (3.3) | 6.8 (4.0) | 7.2 (5.7) | 7.4 (7.3) | 7.3 (6.0) | 7.4 (7.3) |
| Refinement | ||||||
| Resolution (Å) | 1.20 | 1.25 | 1.30 | 1.45 | 1.30 | 1.45 |
| No. reflections | 485,205 | 449,912 | 428,840 | 317,361 | 424,233 | 317,594 |
| Rwork/Rfree (%) | 12.5/14.9 | 12.4/14.5 | 12.6/15.2 | 12.0/15.5 | 12.4/14.7 | 12.0/15.0 |
| No. of atoms | ||||||
| Protein | 2,096 | 2,096 | 2,096 | 2,096 | 2,096 | 2,096 |
| Ligand/ion | 1 Zn | 1 Zn | 1 Zn | 1 Zn | 1 Zn | 1 Zn |
| Ligand/ion | 1 GOL | 1 GOL | 1 GOL | 1 GOL | 1 GOL | 1 GOL |
| Ligand/ion | 2 CO2 | — | — | — | — | — |
| Water | 463 | 373 | 399 | 403 | 389 | 395 |
| B factors | ||||||
| Protein (main/side chain) | 9.5/11.4 | 11.2/13.5 | 11.5/13.7 | 12.4/14.9 | 9.9/12.0 | 13.5/15.8 |
| Ligand/ion | 5.0 (Zn) | 6.0 (Zn) | 6.4 (Zn) | 7.0 (Zn) | 5.6 (Zn) | 7.4 (Zn) |
| Ligand/ion | 19.7 (GOL) | 22.4 (GOL) | 22.4 (GOL) | 25.6 (GOL) | 19.9 (GOL) | 26.5 (GOL) |
| Ligand/ion | 18.1 (CO2) | — | — | — | — | — |
| Water | 39.1 | 40.0 | 39.6 | 43.4 | 35.7 | 44.4 |
| rmsds | ||||||
| Bond lengths (Å) | 0.019 | 0.021 | 0.020 | 0.019 | 0.020 | 0.019 |
| Bond angles (°) | 1.80 | 1.88 | 1.80 | 1.79 | 1.83 | 1.79 |
GOL, glycerol.
Values in parentheses are for highest-resolution shell.
Table S2.
Data collection and refinement statistics for apo-hCA II incubation series
| Time | 0 s | 40 s | 3 min | 10 min |
| Data collection | ||||
| Space group | P21 | P21 | P21 | P21 |
| Cell dimensions (Å) | ||||
| a | 42.10 | 42.07 | 42.05 | 42.29 |
| b | 41.17 | 41.29 | 41.14 | 41.34 |
| c | 71.74 | 71.89 | 71.77 | 72.07 |
| β (°) | 104.36 | 104.28 | 104.29 | 104.17 |
| Resolution (Å) | 50–1.40 (1.42–1.40)* | 50–1.40 (1.42–1.40)* | 50–1.50 (1.53–1.50)* | 50–1.30 (1.32–1.30)* |
| Rsym (%) | 7.2 (68.0) | 6.0 (79.4) | 7.8 (59.7) | 7.0 (53.3) |
| I/σ(I) | 28.6 (2.8) | 33.3 (2.3) | 28.5 (3.2) | 28.6 (3.0) |
| Completeness (%) | 98.8 (97.6) | 100 (100) | 98.7 (97.3) | 99.5 (98.1) |
| Redundancy | 7.4 (7.3) | 7.3 (6.9) | 7.5 (7.5) | 7.2 (5.6) |
| Refinement | ||||
| Resolution (Å) | 1.40 | 1.40 | 1.50 | 1.30 |
| No. reflections | 344,334 | 346,531 | 285,837 | 428,155 |
| Rwork/Rfree (%) | 12.7/16.6 | 12.7/15.9 | 11.9/15.9 | 12.7/15.7 |
| No. of atoms | ||||
| Protein | 2,121 | 2,121 | 2,121 | 2,121 |
| Ligand/ion | 1 GOL/2 CO2 | 1 GOL/— | 1 GOL/— | 1 GOL/— |
| Water | 429 | 379 | 375 | 444 |
| B factors | ||||
| Protein (main/side chain) | 11.4/13.6 | 12.7/15.1 | 13.2/15.6 | 9.5/11.8 |
| Ligand/ion | 21.0 (GOL)/25.5 (CO2) | 24.9 (GOL)/— | 29.8 (GOL)/— | 19.6 (GOL)/— |
| Water | 39.1 | 42.9 | 43.3 | 37.9 |
| rmsds | ||||
| Bond lengths (Å) | 0.020 | 0.019 | 0.020 | 0.014 |
| Bond angles (°) | 1.80 | 1.76 | 1.78 | 1.49 |
GOL, glycerol.
Values in parentheses are for highest-resolution shell.
Structure Determination and Model Refinement.
The structures of holo- and apo-hCA II incubation series were determined using CCP4 program suite (40). Before the refinement, a random 5% of the data were flagged for Rfree analysis. The previously determined 1.1-Å resolution crystal structures (PDB ID codes 3D92 for the holo-hCA II incubation series and 3D93 for the apo-hCA II incubation series) were used as the initial phasing models. The CO2 molecules in PDB ID codes 3D92 and 3D93 were removed, except in the 0-s dataset, to minimize phase bias. The maximum likelihood (MLH) refinement was carried out using REFMAC5 (41). Water molecules were automatically picked up using ARP/wARP (42) during the MLH cycles. The refined structures were manually checked using the molecular graphics program COOT (43). Reiterations of MLH refinement were carried out with anisotropic B factor and hydrogen riding. Details on the refinement are given for the holo- and apo-hCA II incubation series (Tables S1 and S2, respectively). All structural figures were rendered with PyMol (Schrödinger, LLC).
Conclusions
Presented here are intermediate structural states of holo- and apo-hCA II observed during CO2 release. The data show that the active site structure, although thought to be rigid, undergoes significant solvent rearrangements that are orchestrated with conformational rotamer changes of the proton shuttling residue His64. For instance, an alternate water position W2′ exists, forming the solvent network to His64 in the out position, whereas CO2 is bound in the holo-hCA II; however, on CO2 release, W2′ dissipates, and His64 subsequently moves from an out to the in rotameric position. The His64 out to in movement as well as W2′ are not being observed in the CO2-bound apo-hCA II structures. Also, two waters, WDW and WDW′, replace the vacant space created during CO2 release in both the holo- and apo-hCA II. On CO2 release, the CO2-substituted WDW seems to influence and reposition WI to the W1 position, forming the ordered proton wire. This WI to W1 transition occurs on a longer timescale in the apo-hCA II. These results provide a near atomic view of structural snapshots of hCA II during CO2 release and insight into the structural role of the zinc in coordinating the water network. These results also provide hints for the solvent rearrangements that occur as the zinc-bound hydroxide–water transition occurs and the mechanism of PT through the solvent network rearrangement in the hCA II as the CO2 leaves the crystal and the pH reequilibrates from <6 to neutrality (30). Additional molecular dynamic calculations given these “static structural time points” may give more details on the flowing motion of the solvent in the active site (31, 32). This study also shows technical methods that may be applicable to other enzymes that bind and react to low-molecular weight substrates, such as CO2 and NO2.
Materials and Methods
hCA II protein was expressed, purified, and crystallized as described previously (22, 33–35). The CO2 entrapment inside hCA II crystals was carried out by cryocooling crystals under CO2 pressure of 15 atm (19, 20). Before CO2 pressurization, the hCA II crystals were coated with a mineral oil as a CO2 buffering medium (36). The intermediate states during CO2 release were captured by incubating the CO2-bound crystals into a mineral oil at RT for various periods over 1 h and then, flash-cooling them back to 100 K. The crystal incubation time (from ∼1 min to 1 h) was carefully chosen to gradually drop the partial pressure of CO2 in the hCA II crystals. In this way, the hCA II intermediate states equilibrated at different CO2 partial pressures could be captured. Note that the experimental crystal incubation timescale indicates the timescale that CO2 diffuses out of the hCA II crystals rather than the much faster catalytic reaction timescale of hCA II. The X-ray diffraction data were collected at the Cornell High Energy Synchrotron Source, and the data were processed and refined as described previously (20). For each X-ray dataset, a fresh hCA II crystal was prepared as described above, and a single complete X-ray diffraction dataset was collected with an estimated absorbed X-ray dose of 3 × 10⁶ Gy. It was checked that X-ray dose up to 107 Gy does not induce any noticeable changes in the hCA II active site. Details on the experimental procedures and crystallographic refinement statistics can be found in SI Materials and Methods and Tables S1 and S2.
Acknowledgments
The authors thank the staff at the Cornell High Energy Synchrotron Source (CHESS) and the Macromolecular Diffraction at CHESS (MacCHESS) for their support and beam time and Jin Kyun Kim for assistance in manuscript preparation. This work was funded, in part, by NIH Grant GM25154. The CHESS is supported by the NSF and the NIH/NIGMS under NSF Award DMR-1332208, and MacCHESS is supported by NIH/NIGMS Award GM-103485. This research was also supported by the Basic Science Program through the National Research Foundation of Korea funded by Ministry of Science, ICT, and Future Planning Grants 2014R1A2A1A11051254 (to C.U.K.) and 2013R1A1A2005276 (to S.P.).
Footnotes
The authors declare no conflict of interest.
This article is a PNAS Direct Submission. K.M. is a guest editor invited by the Editorial Board.
Data deposition: The crystallography, atomic coordinates, and structure factors have been deposited in the Protein Data Bank, www.pdb.org (PDB ID codes 5DSI, 5DSJ, 5DSK, 5DSL, 5DSM, 5DSN, 5DSO, 5DSP, 5DSQ, and 5DSR).
This article contains supporting information online at www.pnas.org/lookup/suppl/doi:10.1073/pnas.1520786113/-/DCSupplemental.
References
- 1.Davenport HW. The early days of research on carbonic anhydrase. Ann N Y Acad Sci. 1984;429:4–9. doi: 10.1111/j.1749-6632.1984.tb12310.x. [DOI] [PubMed] [Google Scholar]
- 2.Christianson DW, Fierke CA. Carbonic anhydrase: Evolution of the zinc binding site by nature and by design. Acc Chem Res. 1996;29(7):331–339. [Google Scholar]
- 3.Chegwidden WR, Carter ND, Edwards YH. The Carbonic Anhydrases: New Horizons. Birkhauser; Basel: 2000. [Google Scholar]
- 4.Frost SC, McKenna R. Carbonic Anhydrase: Mechanism, Regulation, Links to Disease, and Industrial Applications. Springer; Dordrecht, The Netherlands: 2014. [Google Scholar]
- 5.Supuran CT, de Simone G. Carbonic Anhydrases as Biocatalysts: From Theory to Medical and Industrial Applications. Elsevier; Berlin: 2015. [Google Scholar]
- 6.Silverman DN, Lindskog S. The catalytic mechanism of carbonic anhydrase: Implications of a rate-limiting protolysis of water. Acc Chem Res. 1988;21(1):30–36. [Google Scholar]
- 7.Krishnamurthy VM, et al. Carbonic anhydrase as a model for biophysical and physical-organic studies of proteins and protein-ligand binding. Chem Rev. 2008;108(3):946–1051. doi: 10.1021/cr050262p. [DOI] [PMC free article] [PubMed] [Google Scholar]
- 8.Hewett-Emmett D, Tashian RE. Functional diversity, conservation, and convergence in the evolution of the alpha-, beta-, and gamma-carbonic anhydrase gene families. Mol Phylogenet Evol. 1996;5(1):50–77. doi: 10.1006/mpev.1996.0006. [DOI] [PubMed] [Google Scholar]
- 9.Fisher Z, et al. Structural and kinetic characterization of active-site histidine as a proton shuttle in catalysis by human carbonic anhydrase II. Biochemistry. 2005;44(4):1097–1105. doi: 10.1021/bi0480279. [DOI] [PubMed] [Google Scholar]
- 10.Tu CK, Silverman DN, Forsman C, Jonsson BH, Lindskog S. Role of histidine 64 in the catalytic mechanism of human carbonic anhydrase II studied with a site-specific mutant. Biochemistry. 1989;28(19):7913–7918. doi: 10.1021/bi00445a054. [DOI] [PubMed] [Google Scholar]
- 11.Silverman DN, McKenna R. Solvent-mediated proton transfer in catalysis by carbonic anhydrase. Acc Chem Res. 2007;40(8):669–675. doi: 10.1021/ar7000588. [DOI] [PubMed] [Google Scholar]
- 12.Fisher SZ, et al. Speeding up proton transfer in a fast enzyme: Kinetic and crystallographic studies on the effect of hydrophobic amino acid substitutions in the active site of human carbonic anhydrase II. Biochemistry. 2007;46(12):3803–3813. doi: 10.1021/bi602620k. [DOI] [PubMed] [Google Scholar]
- 13.Zheng J, Avvaru BS, Tu C, McKenna R, Silverman DN. Role of hydrophilic residues in proton transfer during catalysis by human carbonic anhydrase II. Biochemistry. 2008;47(46):12028–12036. doi: 10.1021/bi801473w. [DOI] [PMC free article] [PubMed] [Google Scholar]
- 14.Christianson DW. Unexpected pH-dependent conformation of His-64, the proton shuttle of carbonic anhydrase-II. J Am Chem Soc. 1991;113(25):9455–9458. [Google Scholar]
- 15.Steiner H, Jonsson BH, Lindskog S. The catalytic mechanism of carbonic anhydrase. Hydrogen-isotope effects on the kinetic parameters of the human C isoenzyme. Eur J Biochem. 1975;59(1):253–259. doi: 10.1111/j.1432-1033.1975.tb02449.x. [DOI] [PubMed] [Google Scholar]
- 16.Cui Q, Karplus M. Is a “proton wire” concerted or stepwise? A model study of proton transfer in carbonic anhydrase. J Phys Chem B. 2003;107(4):1071–1078. [Google Scholar]
- 17.Lindskog S. Structure and mechanism of carbonic anhydrase. Pharmacol Ther. 1997;74(1):1–20. doi: 10.1016/s0163-7258(96)00198-2. [DOI] [PubMed] [Google Scholar]
- 18.Avvaru BS, et al. A short, strong hydrogen bond in the active site of human carbonic anhydrase II. Biochemistry. 2010;49(2):249–251. doi: 10.1021/bi902007b. [DOI] [PMC free article] [PubMed] [Google Scholar]
- 19.Kim CU, Kapfer R, Gruner SM. High-pressure cooling of protein crystals without cryoprotectants. Acta Crystallogr D Biol Crystallogr. 2005;61(Pt 7):881–890. doi: 10.1107/S090744490500836X. [DOI] [PubMed] [Google Scholar]
- 20.Domsic JF, et al. Entrapment of carbon dioxide in the active site of carbonic anhydrase II. J Biol Chem. 2008;283(45):30766–30771. doi: 10.1074/jbc.M805353200. [DOI] [PMC free article] [PubMed] [Google Scholar]
- 21.Liang JY, Lipscomb WN. Binding of substrate CO2 to the active site of human carbonic anhydrase II: A molecular dynamics study. Proc Natl Acad Sci USA. 1990;87(10):3675–3679. doi: 10.1073/pnas.87.10.3675. [DOI] [PMC free article] [PubMed] [Google Scholar]
- 22.Fisher SZ, et al. Atomic crystal and molecular dynamics simulation structures of human carbonic anhydrase II: Insights into the proton transfer mechanism. Biochemistry. 2007;46(11):2930–2937. doi: 10.1021/bi062066y. [DOI] [PubMed] [Google Scholar]
- 23.Maupin CM, Voth GA. Preferred orientations of His64 in human carbonic anhydrase II. Biochemistry. 2007;46(11):2938–2947. doi: 10.1021/bi062170f. [DOI] [PMC free article] [PubMed] [Google Scholar]
- 24.Supuran CT. Carbonic anhydrases: Novel therapeutic applications for inhibitors and activators. Nat Rev Drug Discov. 2008;7(2):168–181. doi: 10.1038/nrd2467. [DOI] [PubMed] [Google Scholar]
- 25.Temperini C, Scozzafava A, Vullo D, Supuran CT. Carbonic anhydrase activators. Activation of isozymes I, II, IV, VA, VII, and XIV with l- and d-histidine and crystallographic analysis of their adducts with isoform II: Engineering proton-transfer processes within the active site of an enzyme. Chemistry. 2006;12(27):7057–7066. doi: 10.1002/chem.200600159. [DOI] [PubMed] [Google Scholar]
- 26.Briganti F, et al. Carbonic anhydrase activators: X-ray crystallographic and spectroscopic investigations for the interaction of isozymes I and II with histamine. Biochemistry. 1997;36(34):10384–10392. doi: 10.1021/bi970760v. [DOI] [PubMed] [Google Scholar]
- 27.Briganti F, et al. A ternary complex of carbonic anhydrase: X-ray crystallographic structure of the adduct of human carbonic anhydrase II with the activator phenylalanine and the inhibitor azide. Inorg Chim Acta. 1998;275-276:295–300. [Google Scholar]
- 28.Temperini C, Scozzafava A, Puccetti L, Supuran CT. Carbonic anhydrase activators: X-ray crystal structure of the adduct of human isozyme II with L-histidine as a platform for the design of stronger activators. Bioorg Med Chem Lett. 2005;15(23):5136–5141. doi: 10.1016/j.bmcl.2005.08.069. [DOI] [PubMed] [Google Scholar]
- 29.Temperini C, Scozzafava A, Vullo D, Supuran CT. Carbonic anhydrase activators. Activation of isoforms I, II, IV, VA, VII, and XIV with L- and D-phenylalanine and crystallographic analysis of their adducts with isozyme II: Stereospecific recognition within the active site of an enzyme and its consequences for the drug design. J Med Chem. 2006;49(10):3019–3027. doi: 10.1021/jm0603320. [DOI] [PubMed] [Google Scholar]
- 30.Silverman DN, Tu CK, Lindskog S, Wynns GC. Rate of exchange of water from the active-site of human carbonic anhydrase-C. J Am Chem Soc. 1979;101(22):6734–6740. [Google Scholar]
- 31.Riccardi D, et al. “Proton holes” in long-range proton transfer reactions in solution and enzymes: A theoretical analysis. J Am Chem Soc. 2006;128(50):16302–16311. doi: 10.1021/ja065451j. [DOI] [PMC free article] [PubMed] [Google Scholar]
- 32.Roy A, Taraphder S. Identification of proton-transfer pathways in human carbonic anhydrase II. J Phys Chem B. 2007;111(35):10563–10576. doi: 10.1021/jp073499t. [DOI] [PubMed] [Google Scholar]
- 33.Khalifah RG, Strader DJ, Bryant SH, Gibson SM. Carbon-13 nuclear magnetic resonance probe of active-site ionizations in human carbonic anhydrase B. Biochemistry. 1977;16(10):2241–2247. doi: 10.1021/bi00629a031. [DOI] [PubMed] [Google Scholar]
- 34.Forsman C, Behravan G, Osterman A, Jonsson BH. Production of active human carbonic anhydrase II in E. coli. Acta Chem Scand B. 1988;42(5):314–318. doi: 10.3891/acta.chem.scand.42b-0314. [DOI] [PubMed] [Google Scholar]
- 35.Håkansson K, Carlsson M, Svensson LA, Liljas A. Structure of native and apo carbonic anhydrase II and structure of some of its anion-ligand complexes. J Mol Biol. 1992;227(4):1192–1204. doi: 10.1016/0022-2836(92)90531-n. [DOI] [PubMed] [Google Scholar]
- 36.Kim CU, Hao Q, Gruner SM. Solution of protein crystallographic structures by high-pressure cryocooling and noble-gas phasing. Acta Crystallogr D Biol Crystallogr. 2006;62(Pt 7):687–694. doi: 10.1107/S0907444906014727. [DOI] [PubMed] [Google Scholar]
- 37.McPherson A. The Preparation and Analysis of Protein Crystals. Wiley; New York: 1982. [Google Scholar]
- 38.Henderson R. Cryoprotection of protein crystals against radiation damage in electron and X-ray diffraction. Proc Biol Sci. 1990;241(1300):6–8. [Google Scholar]
- 39.Otwinowski Z, Minor W. Processing of X-ray diffraction data collected in oscillation mode. Methods Enzymol. 1997;276:307–326. doi: 10.1016/S0076-6879(97)76066-X. [DOI] [PubMed] [Google Scholar]
- 40.Collaborative Computational Project, Number 4 The CCP4 suite: Programs for protein crystallography. Acta Crystallogr D Biol Crystallogr. 1994;50(Pt 5):760–763. doi: 10.1107/S0907444994003112. [DOI] [PubMed] [Google Scholar]
- 41.Murshudov GN, Vagin AA, Dodson EJ. Refinement of macromolecular structures by the maximum-likelihood method. Acta Crystallogr D Biol Crystallogr. 1997;53(Pt 3):240–255. doi: 10.1107/S0907444996012255. [DOI] [PubMed] [Google Scholar]
- 42.Perrakis A, Morris R, Lamzin VS. Automated protein model building combined with iterative structure refinement. Nat Struct Biol. 1999;6(5):458–463. doi: 10.1038/8263. [DOI] [PubMed] [Google Scholar]
- 43.Emsley P, Cowtan K. Coot: Model-building tools for molecular graphics. Acta Crystallogr D Biol Crystallogr. 2004;60(Pt 12 Pt 1):2126–2132. doi: 10.1107/S0907444904019158. [DOI] [PubMed] [Google Scholar]


