Significance
There is a vast literature linking individual neurotransmitters with specific brain function and disorders, often with significant overlap. For instance, serotonin (5-HT), glutamate, and endocannabinoids have been linked to several biological functions, such as mood regulation, reward, and decision making, as well as to pathologies, such as depressive and anxiety disorders. It is becoming axiomatic that such neurochemical-based models need to be incorporated within comprehensive and dynamic circuit-based frameworks to apprehend fully the neural basis of these functions. Here, we defined the mesoscale-level functional organization of the medial prefrontal cortex input to the dorsal raphe nucleus and how this circuit is modulated by cannabinoid (CB) signalling. This network-based functional framework may help to explain several of the mood-regulating features of both 5-HT and CBs.
Keywords: optogenetics, synapse, glutamate receptors, anxiety, depression
Abstract
Serotonin (5-HT) neurons located in the raphe nuclei modulate a wide range of behaviors by means of an expansive innervation pattern. In turn, the raphe receives a vast array of synaptic inputs, and a remaining challenge lies in understanding how these individual inputs are organized, processed, and modulated in this nucleus to contribute ultimately to the core coding features of 5-HT neurons. The details of the long-range, top-down control exerted by the medial prefrontal cortex (mPFC) in the dorsal raphe nucleus (DRN) are of particular interest, in part, because of its purported role in stress processing and mood regulation. Here, we found that the mPFC provides a direct monosynaptic, glutamatergic drive to both DRN 5-HT and GABA neurons and that this architecture was conducive to a robust feed-forward inhibition. Remarkably, activation of cannabinoid (CB) receptors differentially modulated the mPFC inputs onto these cell types in the DRN, in effect regulating the synaptic excitatory/inhibitory balance governing the excitability of 5-HT neurons. Thus, the CB system dynamically reconfigures the processing features of the DRN, a mood-related circuit believed to provide a concerted and distributed regulation of the excitability of large ensembles of brain networks.
The phylogenetically old neurotransmitter serotonin (5-HT) is known to regulate a remarkably wide range of brain functions and behaviors, such as mood, aggression, reward, perception, levels of arousal, and decision making (1–5). The 5-HT–containing neurons are localized in a collection of small brainstem nuclei collectively known as the raphe nuclei, with the largest being the dorsal raphe nucleus (DRN). These neurons send extensive and widespread axonal projections throughout the forebrain (6). As such, the firing of a relatively small number of 5-HT neurons is powerfully poised to regulate the excitability of large ensembles of neural networks distributed across virtually the entire brain. However, little is known about how the synaptic networks impinging onto the DRN regulate the excitability of its constituent cells to generate the core feature selectivity of 5-HT neurons and, ultimately, to regulate the dynamic output of 5-HT to the brain.
A significant step forward in this direction has recently been achieved by a number of anatomical studies that provide a comprehensive list of the brain regions projecting to the DRN, as well as detailed cartography of the connectivity patterns of these inputs to local cellular elements within the DRN subnetwork (i.e., 5-HT neurons, local GABAergic neurons) (7–9). The top-down control exerted by the phylogenetically recent medial prefrontal cortex (mPFC) over the DRN is of particular importance, in part, because of the purported role of this pathway in regulating several aspects of motivation and stress processing, and in mediating antidepressant-like effects (1, 10, 11). The mechanistic details of this long-range connectivity are elusive, however, because previous studies using a variety of approaches have reported both excitatory and inhibitory control by the prefrontal cortex (PFC) of 5-HT output (7, 9, 12). Moreover, the basic architecture, processing features, and neuromodulatory influence of this synaptic network are still ill-defined.
Here, using primarily a combination of whole-cell recordings and optogenetic approaches, we show that activation of corticoraphe axonal projections evoked monosynaptic, glutamatergic connections onto both DRN 5-HT and GABAergic cells. This mesoscale synaptic organization of the DRN subnetwork was permissive to a synaptic feed-forward GABAergic-mediated inhibition of both 5-HT and GABAergic cells upon PFC axon stimulation. Interestingly, whereas PFC inputs onto 5-HT and GABAergic neurons were regulated by endocannabinoids (eCBs) and 5-HT, the sensitivity of these synapses to cannabinoid receptor 1 (CB1R) activation exhibited an unsuspected target specificity, with mPFC synapses onto GABA neurons being more sensitive than mPFC synapses onto 5-HT neurons. This differential sensitivity finely controlled the excitatory/inhibitory synaptic balance of the corticoraphe circuit, whereby CB1R activation favored the direct excitatory drive of 5-HT neurons at the expense of the feed-forward inhibition. This specialized processing feature of the DRN subnetwork acting onto the top-down, long-range control exerted by the mPFC inputs may be intimately involved in the mood-regulating features of 5-HT and the cannabinoid (CB) system.
Results
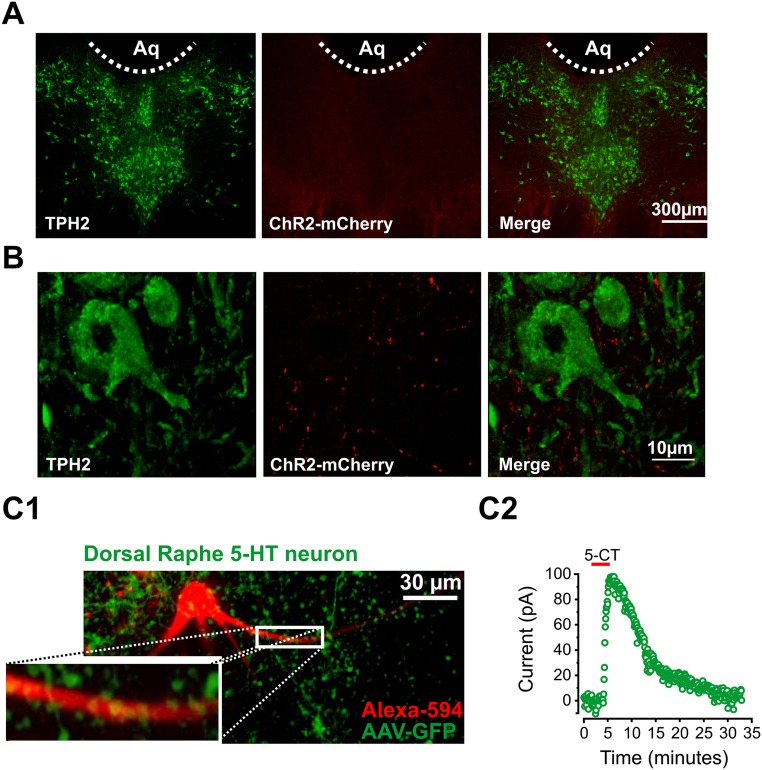
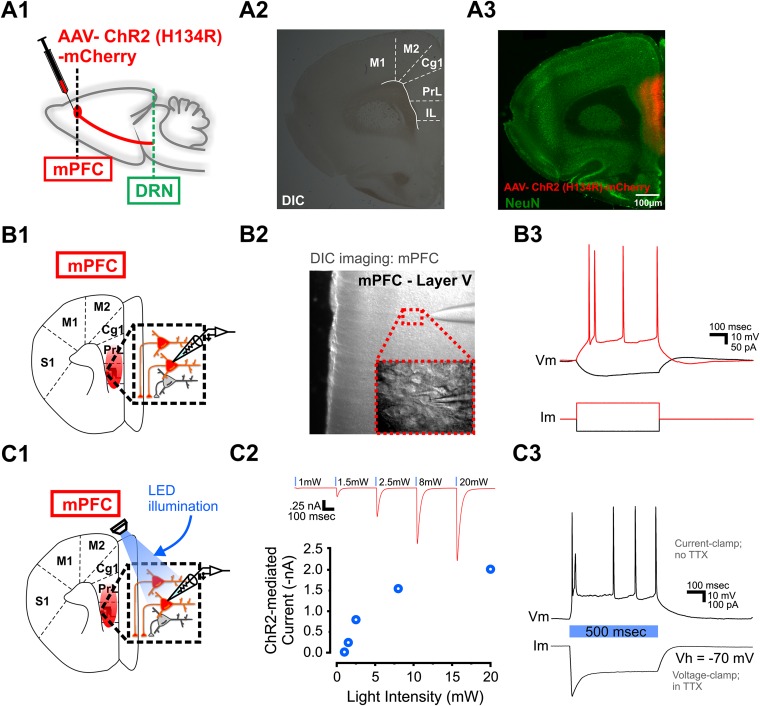
To investigate the synaptic properties of mPFC inputs to the DRN, we first confirmed the presence of this innervation by injecting Fluoro-Gold in the DRN. Consistent with previous retrograde tracing studies (8), we found dense labeling of the tracer in the mPFC and, more specifically, in layer V neurons (Fig. S1). In keeping with this observation, strong fluorescence signals were observed in the raphe 2 to 3 wk following injection in the mPFC of a virus coding either for GFP alone or for channelrhodopsin (ChR2-H134R tagged with mCherry) (Fig. S2). In the raphe, these labeled axons were preferentially oriented in the rostrocaudal axis and appeared to make direct synaptic contacts with 5-HT neurons, either stained for tryptophan hydroxylase 2 (TPH2) or filled with Alexa-594 and imaged by two-photon (2P) excitation during electrophysiological recordings (Fig. S2C). To study this descending innervation functionally, we next turned to optogenetics. We first showed that layer V pyramidal neurons in PFC slices prepared 2 to 3 wk following viral transduction in the mPFC were depolarized by LED stimulation (Fig. S3). Because optogenetic activation can also induce neurotransmitter release from isolated axons in brain slices (13, 14), we selected this method to study the local network processing features of the corticoraphe pathway.
Fig. S1.
mPFC sends direct monosynaptic inputs to the DRN. (A, 1) Schematic of Fluoro-Gold injection in the DRN and subsequent retrograde transport of Fluoro-Gold through the mPFC axon terminal. (A, 2) Confocal image of a coronal brain slice containing the mPFC. (Inset) Two-photon image of the Fluoro-Gold–expressing cells bodies in the mPFC. Note the dense labeling with Fluoro-Gold of deep-layer cells in the mPFC. (A, 3) Confocal image of Fluoro-Gold in the DRN 1 wk postinjection. Aq, aqueduct.
Fig. S2.
mPFC axon terminals in the DRN. (A) Immunostaining for TPH2 (Left) and ChR2(H134R)-mCherry (Middle). (Right) Merged image is shown. (B) Higher magnification of TPH2-expressing 5-HT neuron in the DRN (Left) and ChR2(H134R)-expressing terminals (Middle). (Right) Merged image is shown. (C, 1) Two-photon image of Alexa-594–filled DRN 5-HT neuron (red) and GFP-expressing mPFC axon terminals (green). (C, 2) Whole-cell voltage-clamp recording from the Alexa-594–filled 5-HT cell in C1 and response to bath application of the 5HT1A receptor agonist 5-CT.
Fig. S3.
ChR2(H134R)-expressing layer V pyramidal neurons respond directly to optical stimulation. (A, 1) Schematic of AAV-ChR2(H134R) injection in the mPFC. (A, 2) DIC image of mPFC-containing coronal brain slice. (A, 3) Immunostaining for NeuN and ChR2(H134R)-mCherry in the same brain slice as in A, 2. (B, 1) Schematic of whole-cell recording from a ChR2(H134R)-expressing layer V pyramidal neuron. (B, 2) DIC image of whole-cell recording from a ChR2(H134R)-expressing layer V pyramidal neuron. (B, 3) Current-clamp recording from a ChR2(H134R)-expressing layer V pyramidal neuron. (C, 1) Schematic of whole-cell recording from a ChR2(H134R)-expressing layer V pyramidal neuron and optical stimulation. (C, 2) Input/output curve of ChR2(H134R)-mediated current in response to increasing intensity of optical stimulation. (C, 3) Responses of the same ChR2(H134R)-expressing layer V pyramidal neuron to 500 ms of optical stimulation. (Above) In a current-clamp recording, the pyramidal neuron responded with action potential firing. (Below) In a voltage-clamp recording with TTX (1 μM), the ChR2(H134R)-mediated current initially peaked and was desensitized within 100 ms. Im, membrane current; Vm, membrane voltage.
mPFC-DRN Glutamate Inputs to 5-HT Neurons Are Monosynaptic.
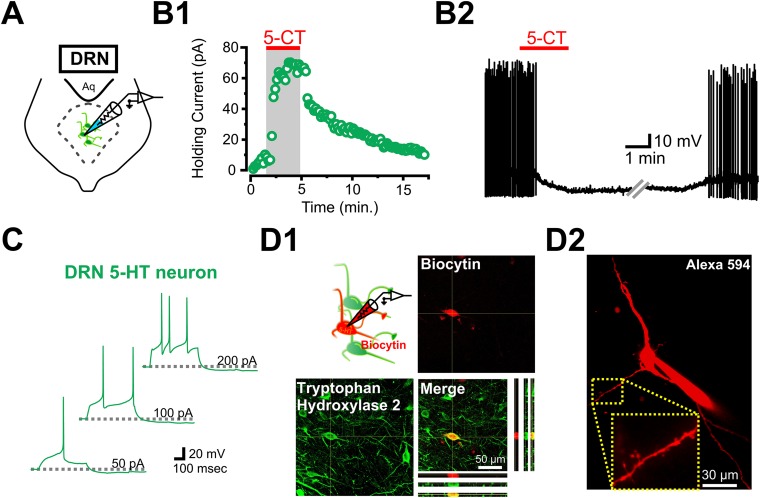
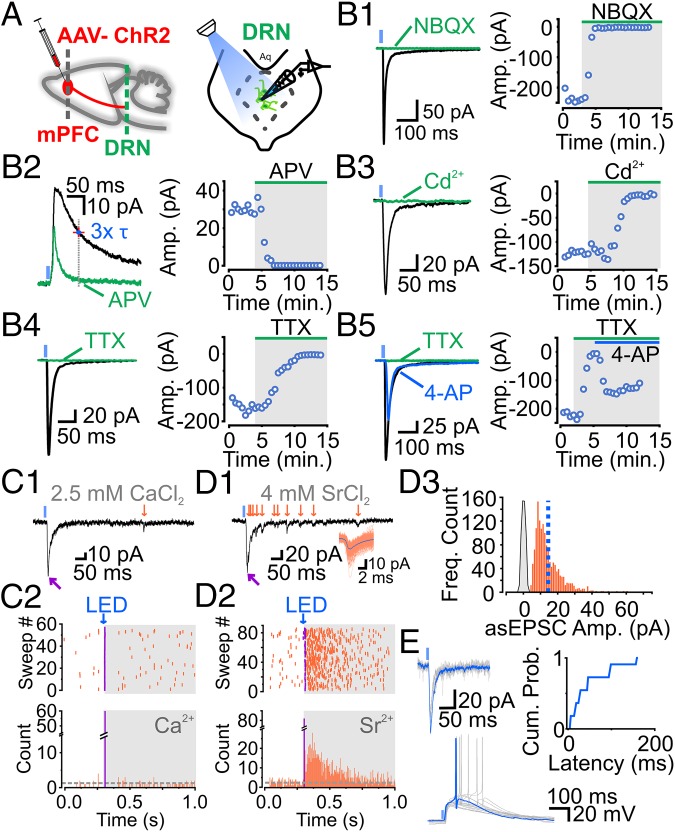
Recordings were carried out from DRN 5-HT neurons that were identified as previously described (15) (Fig. S4). Recordings from 5-HT neurons showed that LED stimulation (1–5 ms) evoked measurable inward postsynaptic currents (PSCs) in 76% of recorded neurons (i.e., 419 of 545 neurons). When recorded at −70 mV, these light-induced inward PSCs (i) displayed rapid and constant onset, (ii) exhibited rapid decay, (iii) ranged between 5 pA and 1 nA, and (iv) were blocked by the AMPA receptor (AMPAR) antagonist 2,3-dioxo-6-nitro-1,2,3,4-tetrahydrobenzo[f]quinoxaline-7-sulfonamide di-sodium salt (NBQX) (Fig. 1 B, 1). Longer decaying outward PSCs were recorded at +40 mV and were blocked by the NMDA receptor (NMDAR) antagonist 2-amino-5-phosphonopentanoic acid (APV) (Fig. 1 B, 2). Thus, activation of PFC axons in the DRN elicits PSCs onto 5-HT neurons mediated by both AMPA and NMDARs.
Fig. S4.
Electrophysiological and immunohistochemical identification of 5-HT neurons in the DRN. (A) Schematic of whole-cell recording from a DRN 5-HT neuron. (B, 1) Whole-cell voltage-clamp recording from a 5-HT neuron and change in holding current in response to bath application of the 5HT1A receptor agonist 5-CT (100 nM). (B, 2) Whole-cell current-clamp recording from a DRN 5-HT neuron. The neuron was brought to spike consistently with the current injection. A 5-CT bath application induced a characteristic 5HT1A-mediated hyperpolarization and inhibition of spiking. (C) Characteristic firing pattern of DRN 5-HT neurons. (D, 1) Post hoc immunolabeling for TPH2 in a 5-HT neuron filled with biocytin during whole-cell recordings. (D, 2) Two-photon image of Alexa-594–filled 5-HT neuron in the DRN.
Fig. 1.
mPFC-DRN inputs onto 5-HT neurons are monosynaptic, glutamatergic, and sufficient to drive action potential firing. (A) Schematics of adeno-associated virus (AAV)-ChR2 injection (Left) and DRN neuron recording from a midbrain slice (Right). ChR2-PSCs are blocked by NBQX (10 μM) or D-APV (50 μM) (B, 1: n = 5; B, 2: n = 5). Presynaptic release is inhibited by cadmium (Cd2+; 200 μM) or TTX (1 μM) (B, 3: n = 3; B, 4: n = 10). (B, 5) Inhibition of presynaptic release with TTX was partially rescued by 4-AP (1 mM; n = 6). Traces of a ChR2-EPSC (magenta arrow) and spontaneous EPSCs (sEPSCs) (orange arrows) in the presence of 2.5 mM extracellular Ca2+ (C, 1) or 4 mM strontium chloride (SrCl2) (D, 1) are shown. (C, 2, Top and D, 2, Top) Scatter plot of ChR2-EPSCs (magenta) followed by sEPSCs (orange). (C, 2, Bottom and D, 2, Bottom) Peristimulus time histogram of ChR2-EPSCs (magenta) and sEPSCs (orange). (D, 3) Histogram of asynchronous EPSC (asEPSC) amplitudes at mPFC-DRN synapses onto 5-HT neurons (n = 9). (E) Recordings of ChR2-EPSCs [Left, membrane voltage (Vm) = −70 mV] and action-potential firing in current-clamp recordings (Right, Vm ∼ −70 mV). Cumulative distribution plot depicts the latency distribution of mPFC, i.e., mPFC-driven action potentials in DRN 5-HT neurons (49.4 ± 14.5 ms, n = 11). Amp., amplitude; Cum. Prob., cumulative probability; Freq., frequency.
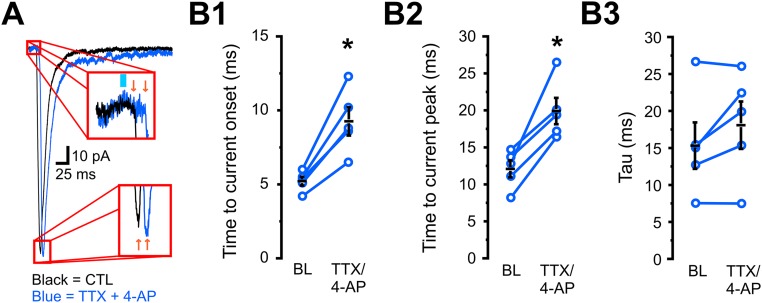
We then looked at basic aspects of light-induced synaptic release from isolated ChR2-transduced PFC axons in the DRN. ChR2-mediated excitatory PSCs (ChR2-EPSCs) were abolished by the nonspecific blockade of voltage-gated (VG) Ca2+ channels with cadmium (Cd2+) and by the blockade of VG Na+ channels with tetrodotoxin (TTX) (Fig. 1 B, 3 and 4). We further found that the TTX-induced blockade of mPFC terminal release could be reversed by the subsequent administration of the potassium (K+) channel blocker 4-aminopyridine (4-AP; Fig. 1 B, 5). The ChR2-EPSCs rescued by 4-AP had no discernable change in their decay kinetics, although their onset was somewhat delayed (Fig. S5). Thus, ChR2-mediated activation of mPFC axons leads to an action potential-dependent and Ca2+ channel-dependent glutamate release. In the presence of TTX, light illumination induced glutamate release from PFC axons onto 5-HT neurons, but only provided that the ChR2-mediated depolarization of isolated axons was unabated by the activation of K+ channels (13, 14). Collectively, this behavior is indicative of a direct monosynaptic input from PFC axons onto DRN 5-HT neurons.
Fig. S5.
Pharmacological isolation of direct monosynaptic optically activated EPSCs results in a rightward shift in the time of EPSC onset and peak. (A) Representative averaged EPSC traces before and after TTX/4-AP application. (Inset, Top) Rightward shift in the time of EPSC onset. (Inset, Bottom) Rightward shift in the time of EPSC peak. (B, 1) Averaged EPSC onset before and after TTX/4-AP application (baseline, 5.24 ± 0.3; TTX/4-AP, 9.28 ± 1.0; n = 5; P = 0.004). (B, 2) Averaged time to EPSC peak before and after TTX/4-AP application (baseline, 12.1 ± 1.1; TTX/4-AP, 19.9 ± 1.8; n = 5; P = 0.006). (B, 3) Averaged EPSC tau before and after TTX/4-AP application (baseline, 15.5 ± 3.1; TTX/4-AP, 18.2 ± 3.2; n = 5; P = 0.55).
We next determined the weights of AMPAR-mediated synaptic inputs from the PFC onto 5-HT neurons because this metric represents a fundamental feature of the top-down PFC control of DRN excitability. The amplitude, per se, of ChR2-EPSCs showed considerable variability across experiments, presumably reflecting variability in the number of transduced axons contacting the recorded neurons, and was therefore a poor metric to quantify unitary synapse strengths. We thus substituted extracellular Ca2+ for strontium (Sr2+) because this manipulation results in asynchronous, input-specific, unitary AMPAR-mediated EPSCs (16, 17). In these conditions, LED stimulation led to a time-locked, early ChR2-EPSC that was closely followed by several delayed, asynchronous EPSCs (asEPSCs) whose frequency was above the frequency of spontaneous EPSCs for ∼300 ms following LED stimulation (Fig. 1 C and D). The average amplitude of these ChR2-asEPSCs was 14.5 ± 0.2 pA (Fig. 1 D, 3), with some events reaching several tens of picoamperes.
To parse the weight of the PFC inputs in modulating the excitability of 5-HT neurons, we carried out recordings in a K+-based internal solution (with normal Ca2+) and examined the ability of ChR2-EPSCs (of known amplitudes determined in voltage-clamp recordings) to induce action potential firing (determined in current-clamp recordings) from the same 5-HT neuron (Fig. 1E). In several cases, we found that ChR2-EPSCs as small as ca. 50 pA induced an EPSP that was of sufficient amplitude to drive the firing of a time-locked action potential in 5-HT neurons. Considering the amplitude distribution of unitary EPSCs from PFC axon stimulation (Fig. 1 D, 3), these results indicate that the synchronous release of glutamate from very few axons from the mPFC (in principle, as few as one axon) can drive action potential firing of DRN 5-HT neurons. Collectively, these results show that the mPFC gives rise to a long-range axonal innervation to the DRN that (i) monosynaptically releases glutamate onto 5-HT neurons, (ii) activates both the AMPARs and NMDARs, and (iii) powerfully regulates the excitability and firing output of DRN 5-HT neurons.
Feed-Forward Inhibition of 5-HT Neurons by Optical Activation of mPFC-DRN Synapses.
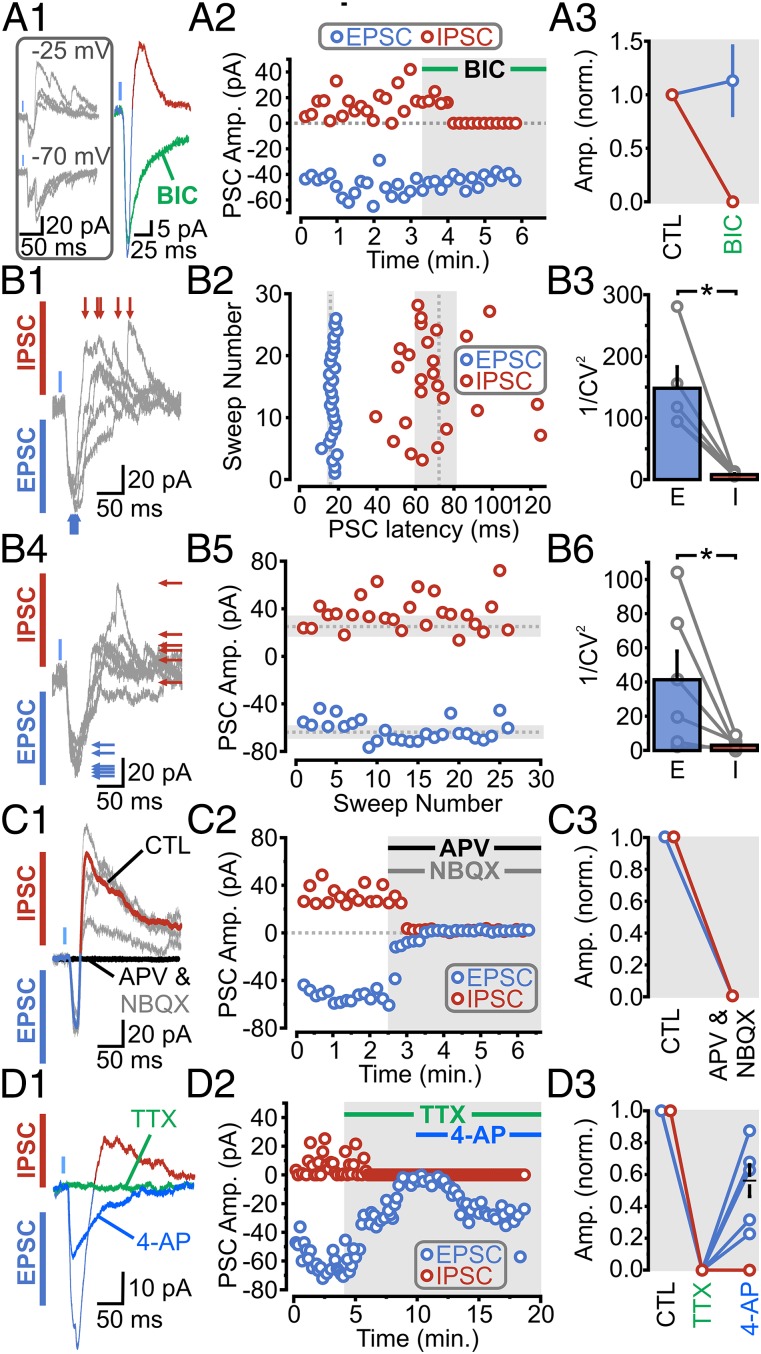
Early in the course of this study, we noticed that the inward ChR2-EPSCs were often followed by a delayed, secondary, inward PSC. The secondary PSC reversed close to our chloride reversal, became resolutely outwardly going at −25 mV, and was blocked by the GABAA receptor (GABAAR) antagonist bicuculline (Fig. 2 A, 2 and 3). In principle, this mixed inward and outward current can reflect one of two broad scenarios: (i) a subpopulation of individual mPFC axons release glutamate and/or GABA onto DRN 5-HT neurons, or (ii) individual mPFC axons make direct excitatory synaptic inputs on both DRN 5-HT neurons and local GABAergic neurons, with action potential firing of the latter leading to a delayed feed-forward inhibition of 5-HT neurons. To distinguish between these possibilities, we carried out the following series of experiments. First, we determined the coefficient of variation (CV) of both the latencies and amplitudes of both the EPSCs and inhibitory postsynaptic currents (IPSCs) (Fig. 2B). If glutamate/GABA were being coreleased at these synapses, one would expect that the latency and amplitudes of both of the ChR2-PSCs (i.e., inward and outward) would exhibit broadly similar variability. However, we found that the latencies and amplitudes of the outward IPSC displayed a much larger CV than the inward EPSC (plotted as 1/CV2; Fig. 2B). Second, we found that bath administration of APV and NBQX blocked both the inward and outward PSCs (Fig. 2C), which is expected of a feed-forward inhibition architecture (and not of a corelease scenario). As a last test, we reasoned that the ability of 4-AP application to rescue the abolishment of ChR2-PSCs by TTX (seen in Fig. 1 B, 5) should be limited to ChR2-transduced axons (i.e., 4-AP should not rescue TTX-induced suppression of firing of local cellular elements that are devoid of ChR2 expression). We found that whereas administration of TTX blocked both the light-induced EPSCs and IPSCs, only the early ChR2-EPSC component was recovered by bath application of 4-AP (Fig. 2D). Altogether, the results thus far show that the mPFC sends a direct, monosynaptic input onto DRN 5-HT neurons and that it triggers a local, GABAergic-mediated, feed-forward inhibitory circuit.
Fig. 2.
mPFC-DRN inputs to 5-HT neurons provide disynaptic feed-forward inhibitory connections. (A, 1, Left) Traces of ChR2-PSCs. (A, 1, Right) ChR2-PSC traces before and after bicuculline (BIC) (20 μM; Vm = −10 mV). (A, 2) Scatter plot of PSCs in response to BIC. (A, 3) Average population response of inward ChR2-EPSCs (blue) and outward IPSCs (red) to BIC. (B, 1 and 4) Individual traces of ChR2-EPSCs (blue, inward) and ChR2-IPSCs (red, outward) (Vm = −15 mV). (B, 2) Scatter plot of PSC latencies (dotted line, mean latency; gray, SD). (B, 3) PSC latencies plotted as 1/CV2 (n = 6; P = 0.004). (B, 5) Scatter plot of PSC amplitudes. (B, 6) PSC amplitudes plotted as 1/CV2 (n = 6; P = 0.046). (C, 1 and 2) Traces and scatter plot of ChR2-PSCs in response to NBQX and D-APV. (C, 3) Normalized population data of PSC amplitude during baseline and following NBQX and APV (n = 3). (D, 1 and 2) Traces and scatter plot of PSCs in response to bath application of TTX, followed by 4-AP. (D, 3) Normalized population data of PSC amplitudes during baseline, TTX, and TTX and 4-AP (n = 6). Gray circles indicate individual cell averages. CTL, control; norm., normalized.
Feed-Forward Inhibition of Local DRN GABA Interneurons by Optical Activation of mPFC-DRN Synapses.
By outlining the presence of a local disynaptic feed-forward inhibitory circuit, the experiments outlined above suggest that mPFC axons also make monosynaptic, glutamatergic contacts with GABAergic neurons located within the DRN subnetwork. We next sought to test this prediction directly. To guide our electrophysiological experiments, we first performed immunohistochemical labeling for GAD67 in the DRN. We found that, consistent with previous studies (18), the majority of DRN GABA neurons were located in the ventrolateral subdivision of the DRN with very sparse labeling along the midline, where the majority of 5-HT neurons are found (Fig. S6).
Fig. S6.
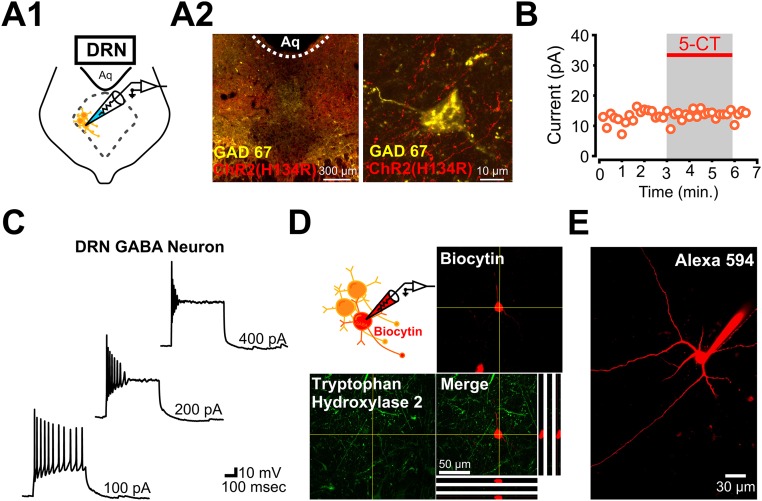
Electrophysiological and immunohistochemical identification of local GABAergic interneurons located in the lateral wings of the DRN. (A1) Schematic of whole-cell recording from a DRN GABAergic interneuron. (A2) Immunostaining for GAD67 and ChR2(H134R)-mCherry. (Right) Higher magnification image of a DRN GABAergic neuron surrounded by ChR2-expressing mPFC axons and terminals. (B) Whole-cell voltage-clamp recording from a DRN GABA neuron with no significant change in holding current in response to bath application 5-CT (Vm = −55 mV). (C) Characteristic firing properties of a DRN GABAergic interneuron in the DRN. (D) Post hoc immunolabeling for TPH2 in a GABAergic interneuron filled with biocytin during a whole-cell recording. TPH2 was not detectable in the GABAergic interneuron. (E) Two-photon image of Alexa-594–filled GABAergic interneuron in the DRN. Note the extent of the dendritic arborization of the DRN GABAergic interneuron.
We then targeted these GABA neurons in the ventrolateral subdivision of the DRN using previously established morphological and electrophysiological characteristics (19) (Fig. S6). DRN GABA neurons were first identified morphologically by their small diameter and round shape (Fig. 3 A, 1) and then electrophysiologically: Unlike 5-HT neurons, DRN GABA neurons fire at high frequency (up to 25 Hz) with current injection, display a characteristic depolarization block (Fig. S6C), and do not respond to bath application of the 5-HT1A receptor agonist 5-carboxamidotryptamine (5-CT) (19) (Fig. S6B). Moreover, in contrast to the relatively meager dendritic arborization of typical 5-HT neurons (Figs. S2, C and S4 D, 2), DRN GABA neurons showed more extensive dendritic arbors (by 2P imaging; Fig. S6E). In a few cases, we confirmed that these small, round, 5-CT–insensitive and electrophysiologically characterized neurons were negative for TPH2 labeling, as determined by post hoc immunohistochemical detection of biocytin included in the recording pipette (Fig. S6D).
Fig. 3.
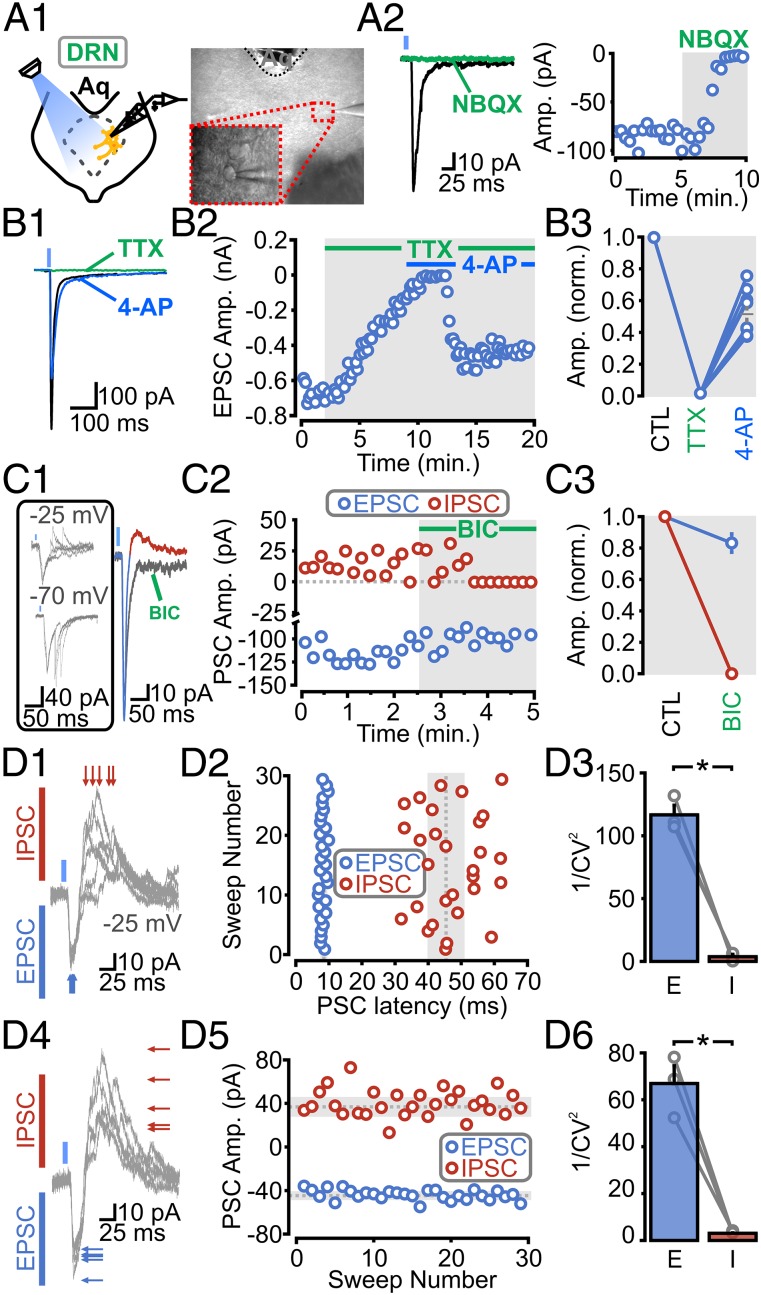
mPFC-DRN inputs to GABA neurons provide monosynaptic excitatory and disynaptic feed-forward inhibitory connections. (A, 1, Left) Schematic of a recording from a DRN GABAergic neuron. (A, 1, Right) Differential interference contrast (DIC) image of the DRN. (Inset) Recording from a GABA neuron. (A, 2) ChR2-PSCs are abolished by NBQX (n = 4). (B, 1 and 2) Averaged traces and scatter plot of ChR2-EPSCs in response to bath application of TTX, followed by 4-AP. (B, 3) Normalized population data of ChR2-EPSC amplitudes during baseline, TTX, and TTX and 4-AP (n = 7). (C, 1, Left) Traces of ChR2-PSCs onto a GABA neuron. (C, 1, Right) ChR2-PSC traces before and after BIC (Vm = −10 mV). (C, 2) Scatter plot of PSCs in response to BIC. (C, 3) Average population response of inward ChR2-EPSCs (blue) and outward IPSCs (red) to BIC. (D, 1 and 4) Individual traces of mixed ChR2-PSCs onto a GABA neuron (Vm = −25 mV). (D, 2) Scatter plot of PSC latencies (dotted line, mean latency; gray, SD). (D, 3) CV of PSC latencies plotted as 1/CV2 (n = 3; P = 0.0001). (D, 5) Scatter plot of PSC amplitudes. (D, 6) CV of PSC amplitudes plotted as 1/CV2 (n = 3; P = 0.001). Gray circles indicate individual cell averages.
We carried out recordings from GABA neurons and found that ChR2-PSCs were triggered in more than 73% of neurons (i.e., 118 of 160), with PSC amplitudes ranging from 5 pA to 2 nA (although amplitudes greater than a few hundred picoamperes were rarely encountered; Fig. 3A). Like the ChR2-PSCs triggered onto 5-HT neurons, those ChR2-PSCs recorded from GABA neurons were blocked by NBQX (Fig. 3 A, 2) and by TTX (Fig. 3B); the TTX abolishment of release was also rescued by the subsequent administration of 4-AP (Fig. 3B). Thus, consistent with a previous report (9), we found that the mPFC sends direct, monosynaptic, glutamatergic inputs onto DRN GABAergic neurons.
In several recordings, we also observed that light illumination triggered a second, delayed, inward PSC (Fig. 3C, Bottom). As was seen in 5-HT neurons, this second inward current became outward at −25 mV (Fig. 3 C, 1, Top), was blocked by bicuculline (Fig. 3 C, 2), and thus reflected a GABAAR-mediated IPSC. Moreover, the variability in both the latency and amplitude of the IPSCs and EPSCs (Fig. 3D) was consistent with action potential-dependent release of GABA following the firing of local cells. Altogether, these results show that the mPFC input to the DRN triggers a direct excitation and an indirect feed-forward inhibition acting on not only DRN 5-HT neurons but also on DRN local inhibitory GABAergic neurons.
mPFC Synapses onto 5-HT and GABA Neurons Are Differentially Modulated by CBs.
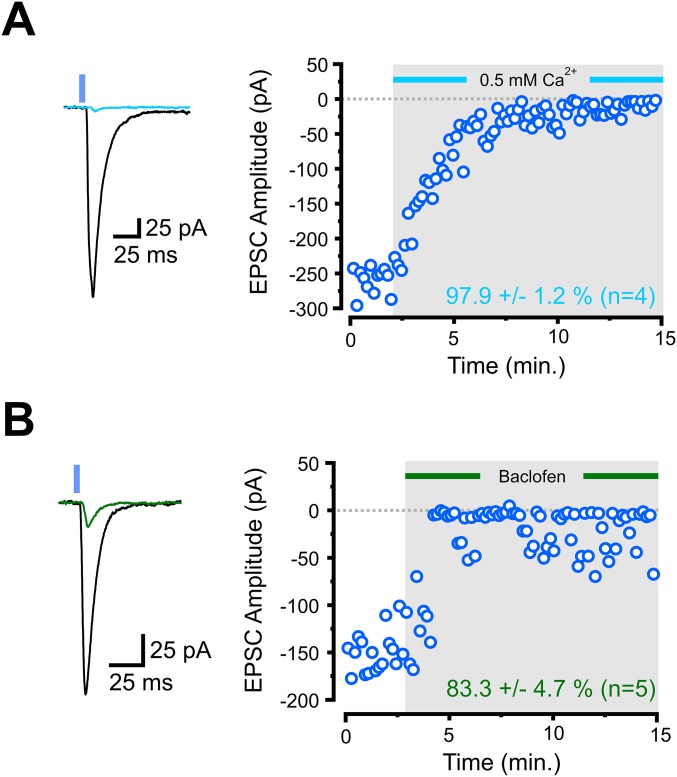
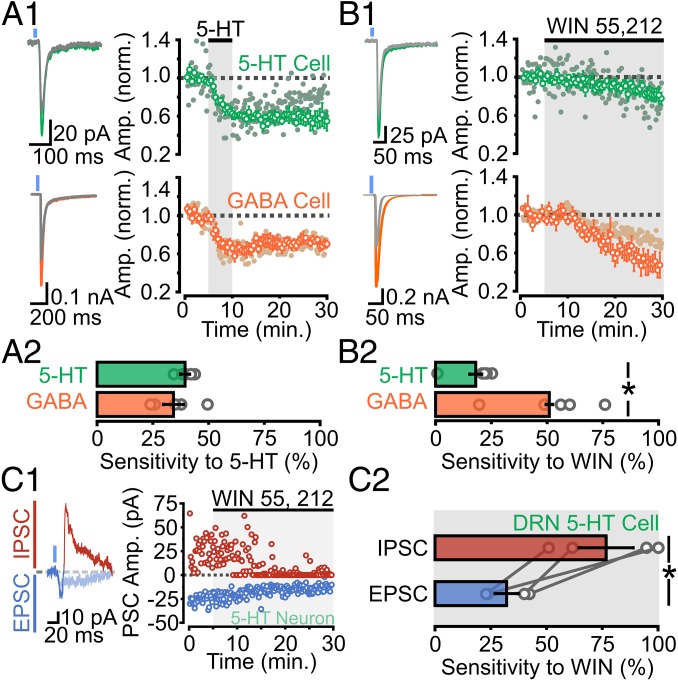
Activation of presynaptic G protein-coupled receptors (GPCRs) powerfully regulates information flow in neural circuits by modulating presynaptic release probability (20, 21). Having established the functional network organization of the corticoraphe circuit, we next examined its potential regulation by neuromodulation, specifically asking whether PFC synapses onto 5-HT and GABA neurons were differentially modulated by GPCR activation. We first needed to ensure that modulation of presynaptic release from long-range PFC axons in the DRN could reliably be studied in our hands using optogenetic approaches. As a first test, we assessed the Ca2+ dependence of ChR2-mediated release by reducing the extracellular concentration of Ca2+ (from 2.5 to 0.5 mM). This manipulation, as expected, nearly completely abolished ChR2-EPSCs (Fig. S7A). Perhaps more importantly, activation of the nearly ubiquitous GABABR with baclofen strongly reduced the amplitude of ChR2-EPSCs (Fig. S7B). Because the activation of presynaptic 5-HT1B receptors has previously been shown to inhibit presynaptic glutamate release from mixed inputs synapsing onto 5-HT neurons in the DRN (22), we next specifically asked whether the mPFC inputs onto DRN 5-HT and GABA neurons are modulated by 5-HT. Bath administration of 5-HT significantly reduced the amplitude of ChR2-EPSCs in recordings from both 5-HT and GABA cells with similar magnitude (Fig. 4A).
Fig. S7.
ChR2(H134R)-mediated presynaptic release of glutamate onto a 5-HT neuron is reduced by decreasing the extracellular concentration of Ca2+ and activating presynaptic GABAB receptors. (A) Representative traces and amplitude plot of optically activated synaptic EPSC and the response to decrease the extracellular concentration of Ca2+ from 2.5 to 0.5 mM. (B) Representative traces and amplitude plot of optically activated synaptic EPSC and the response to bath application of the GABAB-selective agonist baclofen.
Fig. 4.
mPFC-DRN synapses onto 5-HT and GABA neurons exhibit target-specific modulation by CBs. (A, 1, Left) Traces of ChR2-EPSCs onto 5-HT (green) and GABA (orange) neurons before and after (gray) bath application of 5-HT (30 μM). (A, 1, Right) 5-HT decreases ChR2-EPSC amplitude onto 5-HT and GABA neurons (solid circles indicate individual recordings). (A, 2) Average sensitivity of ChR2-EPSCs to 5-HT (5-HT cells, n = 5; GABA cells, n = 5; P = 0.4). (B, 1, Left) Traces of ChR2-EPSCs onto 5-HT (green) and GABA (orange) neurons before and after (gray) bath application of WIN 55, 212-2 (WIN; 10 μM). (B, 1, Right) WIN decreases ChR2-EPSC amplitude onto 5-HT and GABA neurons. (B, 2) Average sensitivity of ChR2-EPSCs to WIN (5-HT cells, n = 5; GABA cells, n = 5; P = 0.01). (C, 1) Traces and plot depicting the effect of WIN on the mixed inward and outward ChR2-PSCs onto a 5-HT neuron. (C, 2) Summary plot of WIN sensitivity on direct EPSCs and indirect IPSCs onto DRN 5-HT neurons (n = 4; P = 0.01). Gray circles indicate individual cell averages.
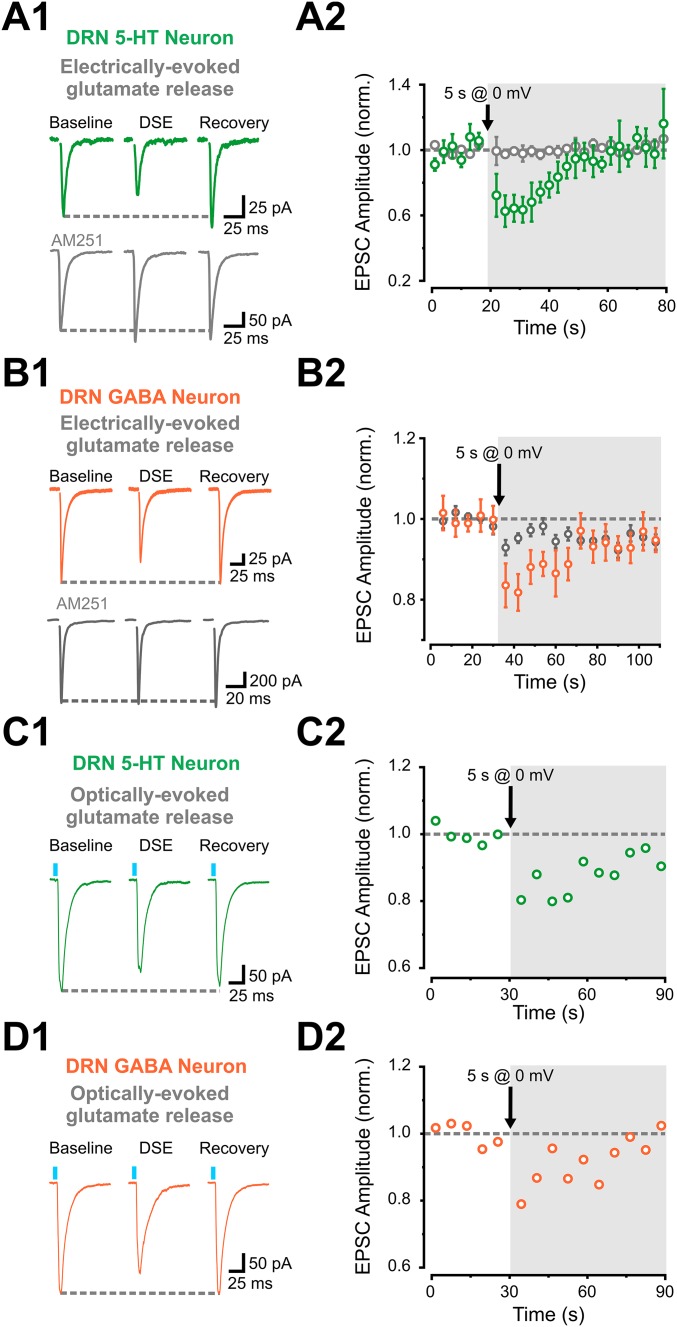
CBs, acting through presynaptic CB1Rs, are powerful modulators of presynaptic release (23). Moreover, glutamate synapses onto DRN 5-HT neurons have previously been shown to be modulated by eCBs acting on presynaptic CB1Rs (24). As a first test to examine in more detail how the top-down control of DRN excitability exerted by the PFC is regulated by the CB system, we applied depolarization-induced suppression of excitation (DSE) protocols (i.e., 5-s depolarization to 0 mV) while monitoring the amplitude of electrically evoked AMPAR-mediated EPSCs (eEPSCs). We observed DSE in recordings from both 5-HT and GABA neurons, and this inhibition was blocked by the CB1R antagonist AM-251 (Fig. S8 A and B). Thus, glutamate synapses onto both DRN 5-HT and GABA neurons are regulated by eCBs. We next tested whether glutamate release specifically from PFC axons is sensitive to eCB release and found that the DSE protocol induced a transient suppression of the amplitudes of ChR2-EPSCs in both 5-HT and GABA neurons (Fig. S8 C and D). Although the magnitude of the DSE observed using optical stimulation was more variable and generally less robust than observed using electrical stimulation, these results nonetheless show that PFC inputs to both DRN 5-HT and GABA neurons are regulated by the CB system.
Fig. S8.
DSE can be induced and expressed by optical stimulation of mPFC inputs onto DRN 5-HT and GABA neurons. (A, 1, Above) Representative traces of stimulating electrode-evoked EPSCs in response to a 5-s depolarization DSE protocol. (A, 1, Below) Bath application of AM-251 for at least 25 min blocked the DSE effect onto 5-HT neurons. (A, 2) Summary plot of DSE effect of electrically evoked AMPAR-mediated EPSCs (eEPSCs) from a 5-HT neuron. DSE experiments in the presence of AM-251 are represented in gray (n = 3), and experiments in regular conditions are represented in green (n = 6). (B, 1, Above) Representative traces of stimulating electrode-evoked EPSCs in response to a 5-s depolarization DSE protocol. (B, 1, Below) Bath application of AM-251 for at least 25 min blocked the DSE effect onto 5-HT neurons. (B, 2) Summary plot of DSE effect of eEPSCs from GABA neurons. DSE experiments in the presence of AM-251 are represented in gray, and experiments in regular conditions are represented in orange (gray, n = 16; orange, n = 10). (C, 1) Representative traces of optically stimulated EPSCs in response to a 5-s depolarization DSE protocol recorded from a 5-HT neuron. (C, 2) Representative plot of DSE of optically stimulated EPSCs from a 5-HT neuron. (D, 1) Representative traces of optically stimulated EPSCs in response to a 5-s depolarization DSE protocol recorded from a GABA neuron. (D, 2) Representative plot of the DSE of optically stimulated EPSCs from a GABA neuron. norm., normalized.
To gain a more reliable and quantifiable measure of the sensitivity of PFC axons in the DRN to CB1R activation, we determined the effects of administration of the selective CB1R agonist WIN 55, 212-2. Recordings from 5-HT neurons showed that bath administration of WIN 55, 212-2 induced a small, but reliable, inhibition of ChR2-EPSCs (Fig. 4B). Remarkably, the magnitude of the CB1R-mediated inhibition of ChR2-EPSCs was significantly more pronounced in recordings from GABA neurons than from recordings of 5-HT neurons (Fig. 4B). As such, these results unravel a striking target specificity in the sensitivity of PFC inputs to CB signaling, whereby PFC inputs onto GABA neurons are more sensitive to CB1R-mediated inhibition than PFC inputs onto 5-HT neurons.
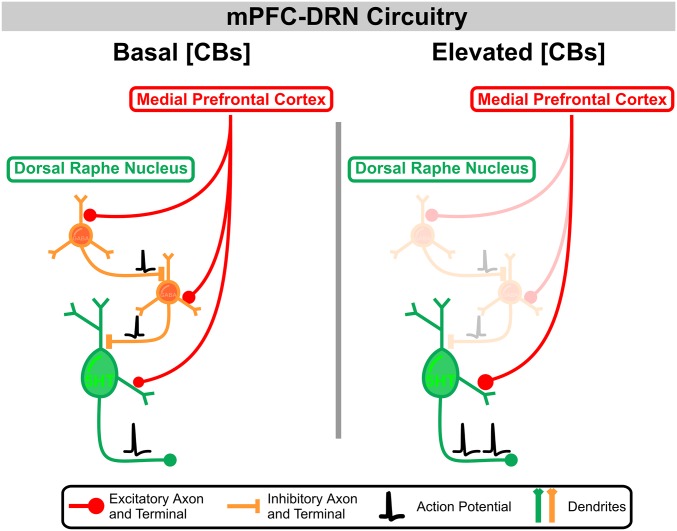
The target specificity in sensitivity to neuromodulation outlined above suggests that CB1R activation in the DRN should, in principle, favor the direct, monosynaptic excitation of DRN 5-HT neurons by descending PFC axons by preferentially inhibiting the PFC drive of GABAergic neurons (Fig. S9). To test this gating hypothesis directly, we recorded 5-HT neurons and optogenetically activated PFC axons in conditions whereby we simultaneously monitored both the direct glutamate-mediated EPSCs and the indirect, feed-forward GABA-mediated IPSCs (i.e., while voltage-clamping at −25 mV, analogous to the experiments shown in Fig. 2). Administration of WIN 55, 212-2 in these conditions resulted in a modest reduction of the direct ChR2-EPSCs while markedly reducing the amplitude of the indirect, outwardly going, GABA-mediated IPSCs (Fig. 4 C, 1 and 2), thereby leading to a robust increase in the EPSC/IPSC ratio of synaptic drive onto DRN 5-HT neurons elicited by the activation of mPFC axons. In some cases, the CB1R-mediated inhibition of the delayed IPSCs onto 5-HT neurons was close to 100%, which is far beyond the magnitude of the inhibition induced by CB1R activation of the ChR2-EPSCs onto DRN GABA neurons. As such, the consequence of the target-specific differential inhibition of mPFC synapses by CB1R activation was amplified by the feed-forward architecture in the DRN, leading to the occurrence of a “switch-like” mechanism in some cases, whereby the balanced EPSC-IPSC inputs onto DRN 5-HT neurons triggered by the mPFC are replaced by a dominant direct monosynaptic activation (Fig. 4C and Fig. S9). Thus, the CB system can powerfully regulate information flow from the mPFC in the DRN, and is thus well poised to fine-tune the functional role of this important neural pathway.
Fig. S9.
Model of mPFC projections to the DRN and the shift toward excitatory drive onto 5-HT neurons in the presence of elevated concentrations of extracellular CBs. High levels of CBs in the DRN result in the activation of presynaptic CB1Rs, including, but not exclusively, those CBs on mPFC terminals in the DRN. The sensitivity of mPFC terminals to CBs is target-specific, thereby having a more robust effect at mPFC synapses onto DRN GABAergic neurons. Thus, in a switch-like manner, activation of CB1R in the DRN powerfully gates information flow from the PFC in the DRN by favoring the direct excitatory drive of 5-HT neurons at the expense of the local feed-forward inhibitory mechanisms.
Discussion
By means of an expansive innervation pattern, the 5-HT system powerfully regulates the excitability of neural networks (e.g., 25–27). Whereas previous studies have shown that the PFC sends a strong innervation to the DRN and modulates the excitability of 5-HT neurons, the basic features of this top-down cortical control have been largely elusive. Here, we functionally defined the network architecture of the mPFC inputs to the DRN. Our results indicate that mPFC axons powerfully regulate the excitability of 5-HT neurons by means of direct monosynaptic connections onto both DRN 5-HT and GABA neurons. Activation of this input leads to a robust GABAergic feed-forward inhibition acting on both populations of DRN neurons. Unexpectedly, we uncovered a differential, target-specific (28) sensitivity to CB-mediated synaptic inhibition that favored the direct, monosynaptic drive of 5-HT neurons by mPFC axons at the expense of the feed-forward inhibition. This modulation of the processing features of a mood-related subnetwork may be involved in the mood-altering features of CB signaling.
The corticoraphe pathway has attracted attention, in part, due to its role in mood regulation and stress processing (10, 29, 30). Despite a large literature on anatomical tracing, functional studies using a variety of experimental approaches have left contradictory views on how these mPFC inputs modulate the excitability of the DRN (7–9). Collectively, our results revealed that PFC inputs make direct, monosynaptic, glutamatergic connections onto DRN GABA and 5-HT neurons. These results are consistent with some (7, 8), but not all (9), studies that have functionally investigated PFC inputs to the DRN. Part of the inconsistencies between studies may stem from distinct innervation patterns emanating from specific subregions within the mPFC. In support of this idea, the probability of observing a ChR2-EPSC onto 5-HT neurons was much lower (∼14%; i.e., 11 of 76 recordings) when the ChR2 virus was injected in superficial subregions of the mPFC (i.e., cingulate and prelimbic regions) compared with when injections were directed to the deeper infralimbic region of the mPFC (76%; i.e., 419 of 545 recordings). Intriguingly, lesions of the infralimbic regions of the PFC, but not of the prelimbic regions, lead to the appearance of anxiety-related traits in mice (31). Future work will determine whether these mood-related changes are mediated by a compromised top-down control from these deep layers of the PFC to the DRN subnetwork.
Activation of presynaptic GPCRs provides a powerful means to modulate information flow (20, 21). It has historically been difficult to study neuromodulatory influences on long-range synaptic connectivity, and, to date, only a few studies have investigated GPCR modulation of presynaptic release from ChR2-expressing terminals (32–34). Here, we show that PFC inputs to the DRN are modulated by 5-HT, GABA, and eCBs. The mPFC inputs onto both 5-HT and GABAergic neurons were sensitive to eCB release, yet the mPFC synapses onto GABAergic neurons were more sensitive to CB1R activation than the mPFC synapses onto 5-HT neurons. Thus, this target specificity in the sensitivity of mPFC axons to CB1R activation allows CBs to gate the top-down control exerted by the PFC on the DRN circuit by favoring a net increase in 5-HT output from this mood-regulating integrating hub.
Even though the “neurochemical” basis of mood disorders has contributed to the development of useful heuristic models in the past, it is now increasingly argued that these models need to be enriched with a detailed circuit-based functional framework as a means to develop novel therapeutic strategies (35). Whereas the importance of the 5-HT system in regulating mood and in the mechanisms of actions of antidepressants has long been recognized (36), the involvement of the CB system is increasingly being documented (37–39). Moreover, mounting evidence points to a key involvement of the PFC control of 5-HT neurotransmission in mediating several of the mood-altering features of CBs (40). By exerting a fine control over the excitation/inhibition balance of the mPFC top-down control of DRN excitability, CB signaling in this relatively small network has a privileged access to modulate key processing features of the DRN and, by extension, to the important behavioral control exerted by the 5-HT system. The precise elucidation of how information flow in this mood-related network is dynamically regulated by neuromodulators may lead to the development of informed pharmacological strategies for the treatment of depression and anxiety disorders.
Materials and Methods
Animals.
Sprague–Dawley rats (50–90 g; Charles River Laboratories) were received at least 6 d before stereotaxic injections. All experiments and procedures were performed in accordance with approved procedures and guidelines set forth by the University of Ottawa Animal Care and Veterinary Services.
Virus Preparation and In Vivo Delivery.
Adeno-associated virus (AAV)-ChR2 (H134R) was stereotaxically injected in the mPFC 2 wk before recordings. More details are provided in SI Materials and Methods.
Electrophysiology and Photostimulation.
Brainstem slices containing the DRN were prepared and recorded from as previously described (15). ChR2-mediated currents were primarily generated using a PlexBright LED module (465 nm; Plexon) delivered by a 200-μm fiber patch cable. More details are provided in SI Materials and Methods.
Statistics.
All data are represented as mean ± SEM. The number of cells is indicated by n. An asterisk represents statistical significance, with P < 0.05, derived from a standard Student t test.
SI Materials and Methods
Viral Constructs and Retrograde Tracer.
AAV9.CamKII0.4.eGFP.WPRE.rBG (catalog no. AV-9-26968P; Penn Vector Core) at a titer of ∼1012, AAV9.CAG.hChR2(H134R)-mCherry.WPRE.SV40 (catalog no. AV-9-20938M; Penn Vector Core) at a titer of ∼1012, and Fluoro-Gold (Fluorochrome, LLC) were used.
Animals.
Sprague–Dawley rats were kept on a 12:12-h light/dark cycle, with access to food and water ad libitum. All experiments and procedures were performed in accordance with approved procedures and guidelines set forth by the University of Ottawa Animal Care and Veterinary Services.
Stereotaxic Injections.
For stereotaxic injections, rats were injected with 0.05 mg/kg buprenorphine and anesthetized by inhalation of isoflurane. Injections were performed using a 10-μL Hamilton syringe with a 33-gauge needle, and 1 μL was injected per coordinate. Stereotaxic coordinates are as follows: mPFC [anterior–posterior (AP), 3.2; medial–lateral (ML), ± 0.8; dorsal–ventral (DV), −4 and −5] and DRN (AP, −7.5; ML, 0.0; DV −6.8). For retrograde tracing, 2 μL of 2% Fluoro-Gold (as recommended by Fluorochrome) was injected. For ChR2 (H134R) expression, 1 μL of AAV9.CAG.hChR2(H134R)-mCherry.WPRE.SV40 was injected and animals were left to recover for 2–3 wk before ex vivo electrophysiological recordings. In anterograde and retrograde studies using either Fluoro-Gold or AAV-GFP, animals were perfused 1–3 wk postinjections.
LED Photostimulation.
LED photostimulation was delivered using a PlexBright LED module and controller (465 nm; Plexon) or a Prizmatix LED module (460 nm). Light was delivered through a 200-μm patch fiber cable with a bare fiber tip with ∼1 cm of glass exposed. Unless otherwise stated, ePSCs were optically stimulated at a frequency of 0.1 or 0.067 Hz with light pulses of 1–5 ms in length and an irradiance of 792 mW/mm2.
Slice Preparation.
PFC and brainstem slices were prepared from 35- to 42-d-old Sprague–Dawley rats 2–3 wk poststereotaxic injections. Slice preparation was performed as previously described (15). In brief, rats were anesthetized by inhalation of isoflurane (Baxter Corporation) and killed by decapitation. The brain was removed, and coronal brain slices were sectioned while immersed in an ice-cold choline chloride-based cutting solution of the following composition: 119 mM choline-Cl, 2.5 mM KCl, 1 mM CaCl2, 4.3 mM MgSO4-7H2O, 1 mM NaH2PO4, 1.3 mM sodium l-ascorbate, 26.2 mM NaHCO3, and 11 mM glucose, and equilibrated with 95% O2 and 5% CO2. Slices were recovered in a chamber containing standard Ringer’s solution of the following composition: 119 mM NaCl, 2.5 mM CaCl2, 1.3 mM MgSO4-7H2O, 1 mM NaH2PO4, 26.2 mM NaHCO3, and 11 mM glucose, at a temperature of 37 °C, continuously bubbled with a mixture of 95% O2 and 5% CO2. Slices were recovered for 1 h in the recovery chamber and equilibrated to a temperature of ∼25 °C until recordings were performed.
Whole-Cell Electrophysiology.
DRN neurons were visualized using an upright microscope: (i) Examiner D1 equipped with Dodt contrast or differential interference contrast (DIC) (Zeiss; 40×/0.75 N.A. objective) or (ii) BX51W1 equipped with DIC optics (Olympus; 40×/0.80 N.A. objective). The 5-HT neurons were identified by morphological and biophysical characteristics using previously established criteria (15, 18). Whole-cell recordings were carried out using an Axon Multiclamp 700B amplifier, sampled at 10 kHz, digitized with an Axon Digidata 1440A (or 1550) digitizer, and filtered at 2 kHz. Whole-cell recordings were performed using borosilicate glass patch electrodes (3–6 MΩ; World Precision Instruments) pulled on a Narishige PC-10 pipette puller. All experiments were performed at room temperature in Ringer’s solution containing 119 mM NaCl, 2.5 mM KCl, 1.3 mM MgSO4, 2.5 mM CaCl2, 1.0 mM NaH2PO4, 11 mM glucose, and 26.2 mM NaHCO3 saturated with 95% O2 and 5% CO2 (pH 7.3, 295–310 mOsm/L). PSCs were recorded using an intracellular solution of either of the following compositions: (i) 115 mM cesium methane-sulfonate, 5 mM tetraethylammonium-Cl, 10 mM sodium phosphocreatine, 20 mM Hepes, 2.8 mM NaCl, 5 mM QX-314, 0.4 mM EGTA, 3 mM ATP(Mg2+), and 0.5 mM GTP (pH 7.25) (adjusted with CsOH; osmolarity, 280–290 mOsmol/L) or (ii) 77 mM cesium methane-sulfonate, 10 mM 1,2-bis(2-aminophenoxy)ethane-N,N,N′,N′-tetraacetic acid tetracesium salt (BAPTA tetracesium salt), 5 mM tetraethylammonium-Cl, 3 mM calcium-chloride, 10 mM sodium phosphocreatine, 20 mM Hepes, 5 mM QX-314, 4 mM ATP(Mg2+), and 0.5 mM GTP (pH 7.25) (adjusted with CsOH; osmolarity, 280–290 mOsmol/L). In some recordings, we bath-applied the nonselective 5-HT1A receptor agonist 5-CT to elicit a 5-HT1A–medated outward current (or hyperpolarization). These recordings were carried out using an internal solution of the following composition: 115 mM potassium gluconate, 20 mM KCl, 10 mM sodium phosphocreatine, 10 mM Hepes, 4 mM ATP(Mg2+), and 0.5 mM GTP (pH 7.25) (adjusted with KOH; osmolarity, 280–290 mOsmol/L). For all voltage-clamp recordings, access resistance was continuously monitored by applying a 125-ms, 2-mV hyperpolarizing pulse 245 ms before stimulation. Recordings were discarded when the access resistance changed by >30%. Liquid junction potential was not compensated for.
Immunohistochemistry.
Brain slices used for immunohistochemistry were prepared from 28- to 42-d-old rats with 1× PBS used as the solvent for all solutions. Rats were anesthetized through an i.p. injection of 100 mg/kg pentobarbital. They were then intracardially perfused with 10 U/mL ice-cold heparin, followed by 4% paraformaldehyde (PFA). Postfixation in 4% PFA was carried out for 2 h before sequential cryoprotection steps in 15% and 30% sucrose over the course of 2 d. Brains were frozen in −30 °C isopentane, mounted in cryomatrix, and cut to 40-μm slices on a cryostat (CM 3050S; Leica). Free-floating sections were blocked in 1% BSA + 0.03% Triton X-100 (TX-100) for 45 min, and incubated in primary antibody against tryptophan hydroxylase enzyme (TPH; 1:1,000; Sigma) in blocking solution at 4 °C. On the following morning, slices were washed three times, for 5 min each time, with 0.1% Tx-100 before incubation in the secondary antibody goat anti-mouse–conjugated Alexa-488 (Jackson ImmunoResearch) for 2 h at room temperature. Slices were washed with 0.1% Tx-100 three times, for 5 min each time, before mounting onto slides with Vectashield (Vector Labs).
To confirm that cells recorded from were, in fact, serotonergic, we performed post hoc immunolabeling of cells filled with biocytin (Sigma). Slices were fixed in 4% PFA for 24 h and blocked in 1% BSA + 0.1% Tx-100 for 45 min before incubation in primary antibody against TPH for 36 h in blocking solution at 4 °C. Slices were washed and incubated in the secondary antibodies goat anti-mouse–conjugated Alexa-488 and streptavidin-conjugated Cy5 (Jackson ImmunoResearch), and mounted as described above. Images were acquired using an Olympus BX61WI upright confocal microscope with 10× water and 63× oil immersion objectives, and laser emissions of 488 nm and 633 nm exciting Alexa-488 and Cy5, respectively. All postprocessing was performed using ImageJ software (NIH).
To identify GABA cells in the DRN, the brain of a rat that was injected with AAV-ChR2-mCherry was intracardially perfused and kept for 24 h in 4% PFA solution. The brain was stored for 1 d in sucrose 20% (wt/vol) before sectioning 45-μm slices with a sliding microtome (SM2010 R; Leica). The brain sections were mounted on slides, air-dried, and covered with blocking solution (3% normal donkey serum + 0.3% Tx-100) for 60 min. The primary antibody (GAD67, MAB5406, 1:1,000; Millipore) was applied overnight at 4 °C in a solution of 3% donkey serum + 0.3% Tween-20 and then rinsed three times with PBS. The slices were incubated in biotinylated donkey anti-mouse (catalog no. 715-065-150, 1:200; Jackson Immunoresearch) + 1.5% normal donkey serum for 60 min at room temperature followed by a thorough rinse. To quench endogenous peroxidase activity, we covered the slices with 0.3% H2O2 for 30 min. The slices were incubated for 45 min with an avidin-biotin complex (PK6100, Vector Elite ABC; Vector Labs), followed by three rinses. We applied 50 μL of a tyramide solution (fluorescein tyramide FITC, PC225-019, 1:50; PerkinElmer) on the slides, covered with a coverslip for only 10 min before quickly rinsing five times with PBS for 5 min each time. The final mounting was made with Fluoromount-G (catalog no. 0100-01; SouthernBiotech). The image acquisition was done with a confocal microscope (LSM 510/AxioImager.M1, Chroma Filter Set 49002, and Filter Set 45; all from Zeiss) using the following objectives: 10× EC Plan-Neofluar 0.3 and 20× Plan-Apochromat 0.8 (both from Zeiss).
Retrograde Labeling.
To confirm that the mPFC is projecting to the DRN, we injected 2 μL of 2% Fluoro-Gold in the DRN at the coordinates described above. Next, following 2–3 wk, we intracardially perfused the injected animals with PBS, followed by PFA fixation. The 45-μm brain slices were made using a microtome and then directly mounted on slides with Fluoromount-G and kept at 4 °C before imaging. The site of injection was acquired with a Zeiss AxioObserver.Z1 epifluorescent microscope with the Zeiss Filter Set 49 and with a Zeiss 10× A-Plan 0.25 objective. The PFC region was imaged using a Zeiss LSM710 multiphoton microscope equipped with a Zeiss Plan-Apochromat 20×/1.0 objective. The images were stitched offline using Image J software.
Data Analysis.
All electrophysiological recordings were analyzed offline using Clampfit 10.4 (Molecular Devices) and Origin 8.5 (OriginLab) software. The mEPSCs were analyzed using a mEPSC current-template search through Clampfit 10.4 software. The current template was created based on mEPSCs recorded in basal conditions. The same template was used for all mEPSC recordings. All data are presented as mean ± SEM. The term n refers to the number of cells recorded. Unless otherwise stated, statistical significances were derived using a standard Student’s t test (P < 0.05). P values of less than 0.05 were considered statistically significant and are indicated with an asterisk.
Drugs and Chemicals.
Bicuculline, NBQX, AM-251, and d,l-APV were purchased from Abcam. TTX, (R)-Baclofen, and 5-CT were purchased from Tocris Bioscience. The 4-AP and strontium chloride (SrCl2) were purchased from Sigma-Aldrich. WIN 55,212-2 was purchased from Cedarlane. The 5-HT was purchased from Toronto Research Chemicals.
Acknowledgments
We thank Dr. Denise Cook for reading and commenting on this manuscript and J.-C.B. and R.B. laboratory members for helpful discussions. We would also like to thank the University of Pennsylvania Vector Core and Dr. Deisseroth for valuable viral vectors and constructs. This work was supported by an award from the Brain and Behavior Research Foundation (to J.-C.B.) and by grants from the Canadian Institute for Health Research (to J.-C.B. and R.B.), the Canadian Partnership for Stroke Recovery (to J.-C.B.), the uOttawa Brain and Mind Research Institute (to J.-C.B.), and the Canadian Heart and Stroke Foundation (to J.-C.B.).
Footnotes
The authors declare no conflict of interest.
This article is a PNAS Direct Submission.
This article contains supporting information online at www.pnas.org/lookup/suppl/doi:10.1073/pnas.1522754113/-/DCSupplemental.
References
- 1.Cohen JY, Amoroso MW, Uchida N. Serotonergic neurons signal reward and punishment on multiple timescales. eLife. 2015;4:4. doi: 10.7554/eLife.06346. [DOI] [PMC free article] [PubMed] [Google Scholar]
- 2.Clarke HF, Dalley JW, Crofts HS, Robbins TW, Roberts AC. Cognitive inflexibility after prefrontal serotonin depletion. Science. 2004;304(5672):878–880. doi: 10.1126/science.1094987. [DOI] [PubMed] [Google Scholar]
- 3.Dayan P, Huys QJ. Serotonin in affective control. Annu Rev Neurosci. 2009;32:95–126. doi: 10.1146/annurev.neuro.051508.135607. [DOI] [PubMed] [Google Scholar]
- 4.Homberg JR. Serotonin and decision making processes. Neurosci Biobehav Rev. 2012;36(1):218–236. doi: 10.1016/j.neubiorev.2011.06.001. [DOI] [PubMed] [Google Scholar]
- 5.Cools R, Roberts AC, Robbins TW. Serotoninergic regulation of emotional and behavioural control processes. Trends Cogn Sci. 2008;12(1):31–40. doi: 10.1016/j.tics.2007.10.011. [DOI] [PubMed] [Google Scholar]
- 6.Moore RY, Halaris AE, Jones BE. Serotonin neurons of the midbrain raphe: Ascending projections. J Comp Neurol. 1978;180(3):417–438. doi: 10.1002/cne.901800302. [DOI] [PubMed] [Google Scholar]
- 7.Pollak Dorocic I, et al. A whole-brain atlas of inputs to serotonergic neurons of the dorsal and median raphe nuclei. Neuron. 2014;83(3):663–678. doi: 10.1016/j.neuron.2014.07.002. [DOI] [PubMed] [Google Scholar]
- 8.Weissbourd B, et al. Presynaptic partners of dorsal raphe serotonergic and GABAergic neurons. Neuron. 2014;83(3):645–662. doi: 10.1016/j.neuron.2014.06.024. [DOI] [PMC free article] [PubMed] [Google Scholar]
- 9.Challis C, Beck SG, Berton O. Optogenetic modulation of descending prefrontocortical inputs to the dorsal raphe bidirectionally bias socioaffective choices after social defeat. Front Behav Neurosci. 2014;8:43. doi: 10.3389/fnbeh.2014.00043. [DOI] [PMC free article] [PubMed] [Google Scholar]
- 10.Warden MR, et al. A prefrontal cortex-brainstem neuronal projection that controls response to behavioural challenge. Nature. 2012;492(7429):428–432. doi: 10.1038/nature11617. [DOI] [PMC free article] [PubMed] [Google Scholar]
- 11.Covington HE, 3rd, et al. Antidepressant effect of optogenetic stimulation of the medial prefrontal cortex. J Neurosci. 2010;30(48):16082–16090. doi: 10.1523/JNEUROSCI.1731-10.2010. [DOI] [PMC free article] [PubMed] [Google Scholar]
- 12.Celada P, Puig MV, Casanovas JM, Guillazo G, Artigas F. Control of dorsal raphe serotonergic neurons by the medial prefrontal cortex: Involvement of serotonin-1A, GABA(A), and glutamate receptors. J Neurosci. 2001;21(24):9917–9929. doi: 10.1523/JNEUROSCI.21-24-09917.2001. [DOI] [PMC free article] [PubMed] [Google Scholar]
- 13.Petreanu L, Huber D, Sobczyk A, Svoboda K. Channelrhodopsin-2-assisted circuit mapping of long-range callosal projections. Nat Neurosci. 2007;10(5):663–668. doi: 10.1038/nn1891. [DOI] [PubMed] [Google Scholar]
- 14.Cruikshank SJ, Urabe H, Nurmikko AV, Connors BW. Pathway-specific feedforward circuits between thalamus and neocortex revealed by selective optical stimulation of axons. Neuron. 2010;65(2):230–245. doi: 10.1016/j.neuron.2009.12.025. [DOI] [PMC free article] [PubMed] [Google Scholar]
- 15.Geddes SD, et al. Time-dependent modulation of glutamate synapses onto 5-HT neurons by antidepressant treatment. Neuropharmacology. 2015;95:130–143. doi: 10.1016/j.neuropharm.2015.02.027. [DOI] [PubMed] [Google Scholar]
- 16.Goda Y, Stevens CF. Two components of transmitter release at a central synapse. Proc Natl Acad Sci USA. 1994;91(26):12942–12946. doi: 10.1073/pnas.91.26.12942. [DOI] [PMC free article] [PubMed] [Google Scholar]
- 17.Hull C, Isaacson JS, Scanziani M. Postsynaptic mechanisms govern the differential excitation of cortical neurons by thalamic inputs. J Neurosci. 2009;29(28):9127–9136. doi: 10.1523/JNEUROSCI.5971-08.2009. [DOI] [PMC free article] [PubMed] [Google Scholar]
- 18.Calizo LH, et al. Raphe serotonin neurons are not homogenous: Electrophysiological, morphological and neurochemical evidence. Neuropharmacology. 2011;61(3):524–543. doi: 10.1016/j.neuropharm.2011.04.008. [DOI] [PMC free article] [PubMed] [Google Scholar]
- 19.Gocho Y, Sakai A, Yanagawa Y, Suzuki H, Saitow F. Electrophysiological and pharmacological properties of GABAergic cells in the dorsal raphe nucleus. J Physiol Sci. 2013;63(2):147–154. doi: 10.1007/s12576-012-0250-7. [DOI] [PMC free article] [PubMed] [Google Scholar]
- 20.Ster J, et al. Enhancement of CA3 hippocampal network activity by activation of group II metabotropic glutamate receptors. Proc Natl Acad Sci USA. 2011;108(24):9993–9997. doi: 10.1073/pnas.1100548108. [DOI] [PMC free article] [PubMed] [Google Scholar]
- 21.Boeijinga PH, Boddeke HW. Activation of 5-HT1B receptors suppresses low but not high frequency synaptic transmission in the rat subicular cortex in vitro. Brain Res. 1996;721(1-2):59–65. doi: 10.1016/0006-8993(96)00149-7. [DOI] [PubMed] [Google Scholar]
- 22.Lemos JC, et al. Selective 5-HT receptor inhibition of glutamatergic and GABAergic synaptic activity in the rat dorsal and median raphe. Eur J Neurosci. 2006;24(12):3415–3430. doi: 10.1111/j.1460-9568.2006.05222.x. [DOI] [PMC free article] [PubMed] [Google Scholar]
- 23.Heifets BD, Castillo PE. Endocannabinoid signaling and long-term synaptic plasticity. Annu Rev Physiol. 2009;71:283–306. doi: 10.1146/annurev.physiol.010908.163149. [DOI] [PMC free article] [PubMed] [Google Scholar]
- 24.Haj-Dahmane S, Shen RY. Endocannabinoids suppress excitatory synaptic transmission to dorsal raphe serotonin neurons through the activation of presynaptic CB1 receptors. J Pharmacol Exp Ther. 2009;331(1):186–196. doi: 10.1124/jpet.109.153858. [DOI] [PMC free article] [PubMed] [Google Scholar]
- 25.Béïque JC, Imad M, Mladenovic L, Gingrich JA, Andrade R. Mechanism of the 5-hydroxytryptamine 2A receptor-mediated facilitation of synaptic activity in prefrontal cortex. Proc Natl Acad Sci USA. 2007;104(23):9870–9875. doi: 10.1073/pnas.0700436104. [DOI] [PMC free article] [PubMed] [Google Scholar]
- 26.Béïque JC, et al. Serotonergic regulation of membrane potential in developing rat prefrontal cortex: Coordinated expression of 5-hydroxytryptamine (5-HT)1A, 5-HT2A, and 5-HT7 receptors. J Neurosci. 2004;24(20):4807–4817. doi: 10.1523/JNEUROSCI.5113-03.2004. [DOI] [PMC free article] [PubMed] [Google Scholar]
- 27.Andrade R. Serotonergic regulation of neuronal excitability in the prefrontal cortex. Neuropharmacology. 2011;61(3):382–386. doi: 10.1016/j.neuropharm.2011.01.015. [DOI] [PMC free article] [PubMed] [Google Scholar]
- 28.Koester HJ, Johnston D. Target cell-dependent normalization of transmitter release at neocortical synapses. Science. 2005;308(5723):863–866. doi: 10.1126/science.1100815. [DOI] [PubMed] [Google Scholar]
- 29.Hale MW, Shekhar A, Lowry CA. Stress-related serotonergic systems: implications for symptomatology of anxiety and affective disorders. Cell Mol Neurobiol. 2012;32(5):695–708. doi: 10.1007/s10571-012-9827-1. [DOI] [PMC free article] [PubMed] [Google Scholar]
- 30.Amat J, et al. Medial prefrontal cortex determines how stressor controllability affects behavior and dorsal raphe nucleus. Nat Neurosci. 2005;8(3):365–371. doi: 10.1038/nn1399. [DOI] [PubMed] [Google Scholar]
- 31.Rebello TJ, et al. Postnatal day 2 to 11 constitutes a 5-HT-sensitive period impacting adult mPFC function. J Neurosci. 2014;34(37):12379–12393. doi: 10.1523/JNEUROSCI.1020-13.2014. [DOI] [PMC free article] [PubMed] [Google Scholar]
- 32.Shabel SJ, Proulx CD, Trias A, Murphy RT, Malinow R. Input to the lateral habenula from the basal ganglia is excitatory, aversive, and suppressed by serotonin. Neuron. 2012;74(3):475–481. doi: 10.1016/j.neuron.2012.02.037. [DOI] [PMC free article] [PubMed] [Google Scholar]
- 33.Chu HY, Ito W, Li J, Morozov A. Target-specific suppression of GABA release from parvalbumin interneurons in the basolateral amygdala by dopamine. J Neurosci. 2012;32(42):14815–14820. doi: 10.1523/JNEUROSCI.2997-12.2012. [DOI] [PMC free article] [PubMed] [Google Scholar]
- 34.Ellender TJ, Huerta-Ocampo I, Deisseroth K, Capogna M, Bolam JP. Differential modulation of excitatory and inhibitory striatal synaptic transmission by histamine. J Neurosci. 2011;31(43):15340–15351. doi: 10.1523/JNEUROSCI.3144-11.2011. [DOI] [PMC free article] [PubMed] [Google Scholar]
- 35.Monteggia LM, Malenka RC, Deisseroth K. Depression: The best way forward. Nature. 2014;515(7526):200–201. doi: 10.1038/515200a. [DOI] [PubMed] [Google Scholar]
- 36.Lucki I. The spectrum of behaviors influenced by serotonin. Biol Psychiatry. 1998;44(3):151–162. doi: 10.1016/s0006-3223(98)00139-5. [DOI] [PubMed] [Google Scholar]
- 37.Hill MN, Miller GE, Ho WS, Gorzalka BB, Hillard CJ. Serum endocannabinoid content is altered in females with depressive disorders: A preliminary report. Pharmacopsychiatry. 2008;41(2):48–53. doi: 10.1055/s-2007-993211. [DOI] [PMC free article] [PubMed] [Google Scholar]
- 38.Gobbi G, et al. Antidepressant-like activity and modulation of brain monoaminergic transmission by blockade of anandamide hydrolysis. Proc Natl Acad Sci USA. 2005;102(51):18620–18625. doi: 10.1073/pnas.0509591102. [DOI] [PMC free article] [PubMed] [Google Scholar]
- 39.Hill MN, Gorzalka BB. Pharmacological enhancement of cannabinoid CB1 receptor activity elicits an antidepressant-like response in the rat forced swim test. Eur Neuropsychopharmacol. 2005;15(6):593–599. doi: 10.1016/j.euroneuro.2005.03.003. [DOI] [PubMed] [Google Scholar]
- 40.Bambico FR, Katz N, Debonnel G, Gobbi G. Cannabinoids elicit antidepressant-like behavior and activate serotonergic neurons through the medial prefrontal cortex. J Neurosci. 2007;27(43):11700–11711. doi: 10.1523/JNEUROSCI.1636-07.2007. [DOI] [PMC free article] [PubMed] [Google Scholar]


