

Abstract
Study Design Retrospective study.
Objectives To assess the fatty atrophy of the lumbar paraspinal muscles (LPMs) as determined using magnetic resonance imaging in patients with lumbar degenerative disk disease (DDD) and focal disk herniation and to determine if fatty atrophy is associated with patient-reported outcome measures (PROMS).
Methods One hundred sixty-five patients with lumbar DDD were identified from a PROMS database of >1,500 patients. These patients were divided into two study groups: DDD alone (n = 58) and DDD with disk herniation (n = 107). A grid was randomly applied to the axial scans at the L3–L4, L4–L5, and L5–S1 levels. The muscle-to-fat ratio of the LPMs was recorded and compared with PROMS data. Subcutaneous fat thickness at each level was also measured.
Results This study found no difference in the muscle-to-fat ratio between the DDD and disk herniation groups. There was no association between the muscle-to-fat ratio and PROMS data in either group. There was significantly more subcutaneous fat at all levels in the DDD group as compared with the disk prolapse group. In DDD and disk prolapses, subcutaneous fat was thicker in women (p = 0.013 and 0.001). In patients with DDD, more subcutaneous fat was associated with disability (p < 0.001). Muscle content of erector spinae and multifidus negatively correlated with increasing age in both groups at the L3–L4 level.
Conclusions Muscle fat content in the LPM does not appear to relate to PROMS. Muscle content decreases with age. Those with low back pain (DDD) have greater subcutaneous fat thickness.
Keywords: PROMS, DDD, disk prolapse, muscle fat content, paraspinal muscles
Introduction
Low back pain has become an endemic disease state throughout many countries and is a leading cause of disability in adults of working age.1 2 3 Eighty percent of all adults are known to have experienced low back pain during their life; 10% of those adults develop chronic low back pain, with the remaining 90% of cases resolving within 6 weeks.3 4
One of the most common causes of low back pain, albeit one of the most misunderstood, is lumbar degenerative disk disease (DDD). The relationship between lumbar DDD and low back pain is not clearly understood: back and radicular pain can be present in the absence of distinct morphological changes, yet many patients report no pain even in the presence of advanced degeneration.5 Although the main factor leading to lumbar DDD is assumed to be genetic, a host of other factors may cause and are associated with low back pain. Previous studies have investigated the magnetic resonance imaging (MRI) features of the lumbar paraspinal muscles (LPMs) in patients with low back pain.6 7 8 9 10 The appearance of fatty infiltration in the LPMs on MRI can be quite striking and leads the clinician to wonder whether it is cause or effect and if it could be improved with targeted therapy.
A pilot study of ours with a sample size of 79 patients found that the muscle-to-fat ratio in the LPMs did not appear to be related to patient-reported outcome measures (PROMS) for three common lower back pathologies and that the muscle-to-fat ratio decreases as age increases.11 Following feedback, we decided to increase the sample size, narrow the age range, and focus on the associated pathologies of two common conditions: lower back pain secondary to lumbar DDD and radicular leg pain due to lumbar disk herniation.
The aims of this study were to describe the fatty atrophy of the LPMs, as determined using MRI, in patients with DDD and focal disk herniation and to determine if fatty atrophy is associated with PROMS. The null hypothesis of our study was that the severity of back pain was not associated with muscle atrophy.
Materials and Methods
Subjects
The selected sample group consisted of 165 patients attending the clinic of a single spinal surgeon. The patients' data was entered into a prospective PROMS database from the national/public health care sector, which currently contains data for over 1,500 patients. The patients selected for this retrospective study (n = 165, 78 men and 87 women, age range 30 to 50 years) presented with low back pain secondary to lumbar DDD or radicular pain due to focal disk herniations within the lower lumbar disks (L3–S1). Fifty-eight patients had DDD alone (19 men and 39 women), and 107 had lumbar DDD accompanied by a focal disk herniation (59 men and 48 women). Patients with deformity (scoliosis, spondylolisthesis, kyphosis, pars defects) or previous lumbar spine surgery were excluded from the study. The selection process was not randomized because all patients who fulfilled the criteria and had an MRI of the lumbar spine were included.
The patients completed a standard PROMS questionnaire including visual analog scale (VAS) for back (10 possible points), VAS for leg (10 possible points), Oswestry Disability Index (ODI; scored in percentage),12 EuroQol-5D (Eq-5D) VAS (self-rated health index, scored in percentage), Patient Health Questionnaire-9 (depression index, 27 possible points),13 Generalized Anxiety Disorder-7 (anxiety index, 21 possible points),14 and Surgical Expectation Scores.15
Degenerative changes of the intervertebral disks of patients were quantified by measuring the disk height reduction and the loss of signal intensity as compared with the normal disks above, and T2-weighted images were used to identify focal disk herniations. The study was approved by the University Health Board.
Magnetic Resonance Imaging
MRI examinations were performed using a 1.5-T MRI. Muscle-related measurements were obtained on axial MRIs, with sagittal cross-references made to the relevant midintervertebral disk at the L3–L4, L4–L5, and L5–S1 levels of the lumbar spine (Fig. 1). The lower three levels were chosen because routine MRI scanning in our institution always attains axial images of these levels, which also represents the most common levels for degenerative disk pathology. Each slice was 4-mm thick with a 0.5-mm interval, and the resolution of these images was 384 × 286 pixels. MRI was used to measure the morphology of the LPM, with its subunits of psoas major, the lateral erector spinae muscles (iliocostalis, longissimus, semispinalis), and the medial short segmental stabilizer group, which is predominantly made up of the multifidus. T2-weighted fast spin echo images were used to analyze fat infiltration of the left and right psoas major, erector spinae, and multifidus in isolation at the respective intervertebral disk levels. The subcutaneous fat thickness at each level was measured using an electronic caliper. Three measurements were taken at each level: one from the center of the intervertebral disk to the skin, and the other two from the left and right edges of the disk, on either side of the central measurement.
Fig. 1.
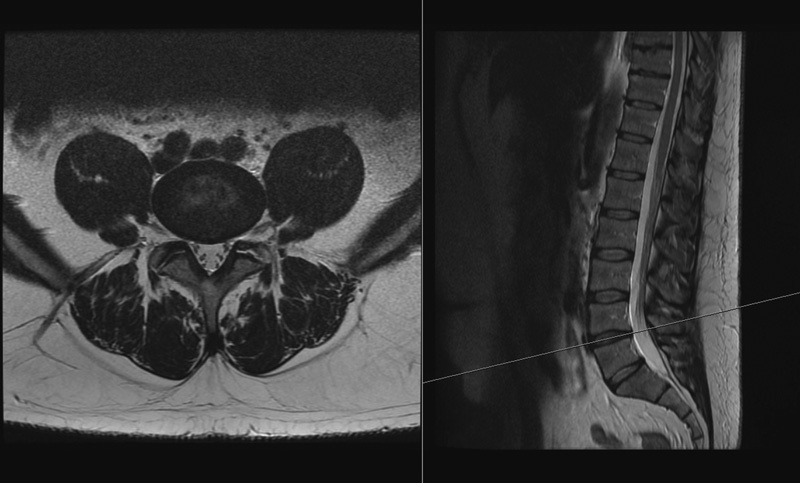
An example of the axial and sagittal images side by side at the L4–L5 level.
Quantitative analysis of nonmuscular (fat) infiltration was estimated using the Cavalieri approximation principle.16 In this systematic random approach, section cuts are taken to estimate the surface area, independent of the volume. At a set magnification, a grid of 18 × 27 points, each 1 cm apart, was randomly applied to the middiscal T2-weighted axial scans at the L3–L4, L4–L5, and L5–S1 levels (Fig. 2). The number of points touching muscle and fat in the left and right psoas major, erector spinae, and multifidus muscles were recorded (Fig. 3). The left and right sides were recorded together and not in isolation because the pilot study showed no difference between sides.11 Figs. 4 and 5 show the parameters and boundaries measured. This method was chosen as an alternative to commercially available software predominantly for financial reasons but also to minimize inclusion of fat outside the boundaries of the irregular muscle outline. We defined fatty atrophy as the process within the muscle bulk itself and not fat surrounding the targeted muscles.
Fig. 2.
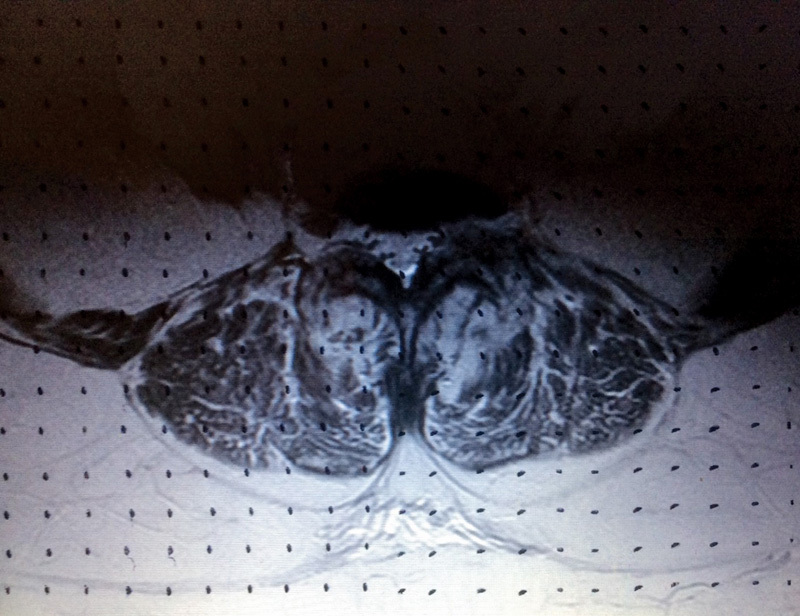
Quantitative analysis of fat infiltration using the set grid.
Fig. 3.
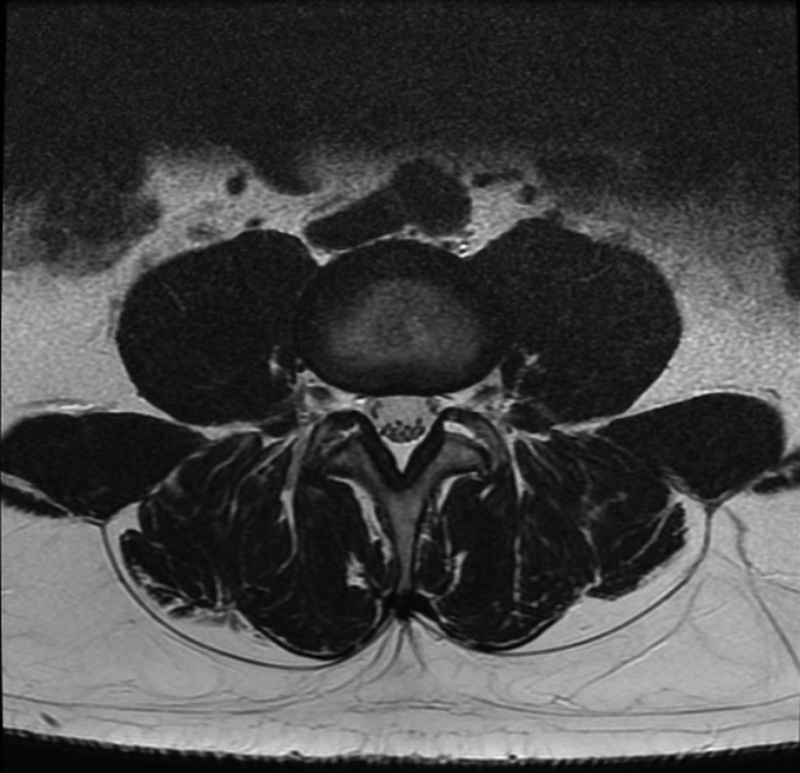
An example of high muscle content at the L3–L4 level.
Fig. 4.
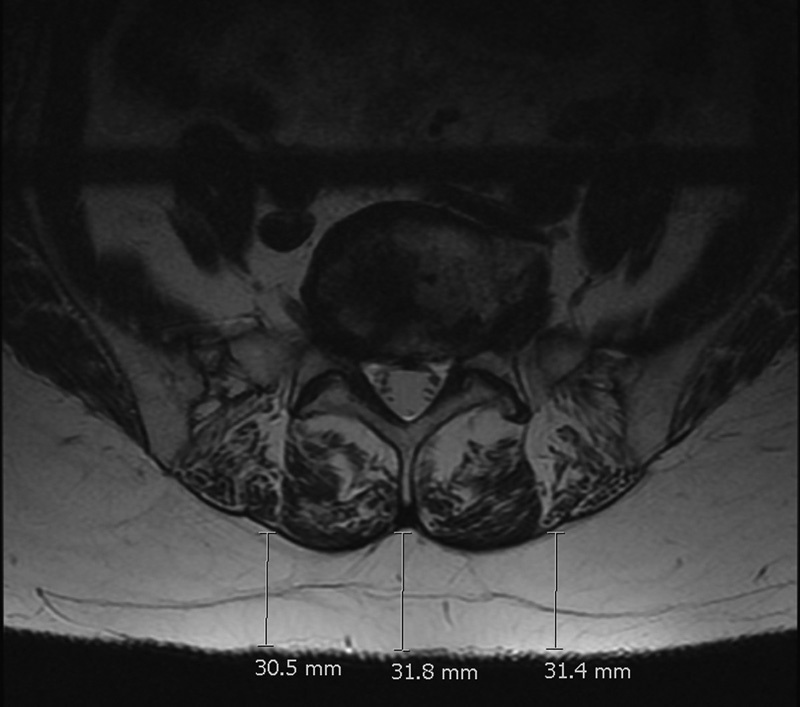
An example of “marbling” with a high fat infiltration of erector spinae and the method used to measure the subcutaneous fat with the electronic caliper.
Fig. 5.
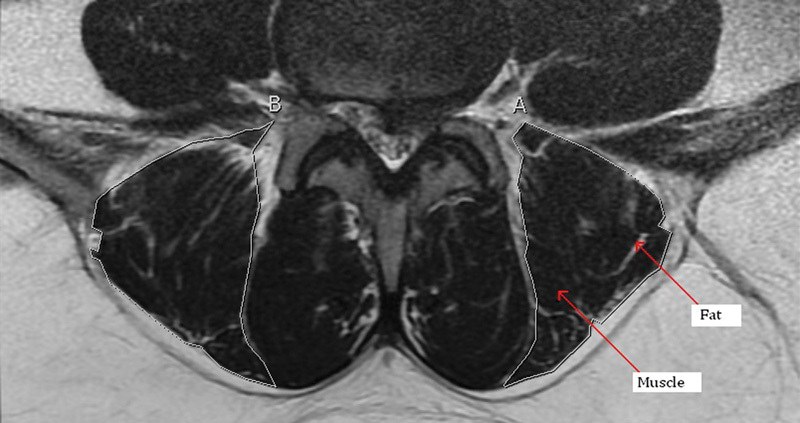
An example of the boundaries used to measure the lumbar paraspinal muscles. White lines (labeled A and B) indicate outline of the erector spinae muscle.
The lead researcher performed the initial measurements. Repeat measurements were performed on 20 of these patients by a senior consultant spinal surgeon. Intraclass correlation coefficient and Cronbach's alpha values were calculated to grade the reproducibility of the study, which ranged from fair to strong at each level. These can be seen in Table 1.
Table 1. Intraclass correlation coefficient (ICC) and Cronbach's alpha (CA) for psoas major, erector spinae, and multifidus at L3–L4, L4–L5, L5–S1 intervertebral levels.
| Psoas major | Erector spinae | Multifidus | |
|---|---|---|---|
| L3–L4 | |||
| ICC | 0.46 | 0.5 | 0.51 |
| CA | 0.72 | 0.75 | 0.76 |
| L4–L5 | |||
| ICC | 0.33 | 0.42 | 0.76 |
| CA | 0.59 | 0.69 | 0.91 |
| L5–S1 | |||
| ICC | 0.38 | 0.43 | 0.62 |
| CA | 0.65 | 0.7 | 0.83 |
Note: Reference scales: ICC: 0–0.2, poor; 0.3–0.4, fair; 0.5–0.6, moderate; 0.7–0.8, strong; >0.8, almost perfect agreement on measurements. CA: >0.7, reliable measurement.
Statistical Analyses
The software SPSS20 was used for statistical analyses (IBM, Armonk, New York, United States). The demographic sample sizes for each group were calculated, as were the corresponding means and 95% confidence intervals. One-way analysis of variance, paired t tests, and Pearson r were used to compare the muscle-to-fat ratio at each level to the respective PROMS. The analysis of variance tested for differences among the groups at each different level (avoiding multiple two-sample t tests, which would increase the chance of committing a type 1 error). The paired t test assumed the data was normally distributed and was used to compare observations at one level to those at another level. The Pearson r test was used to assess the linear correlation between the muscle-to-fat ratio at each level and the respective PROMS scores, and p values were considered significant at less than 5%. No power calculation or sample size was calculated as there was little literature on the topic; all of the cases from the database were used, and the sizes exceeded 50 in each group (which was assumed to be satisfactory).
Results
Table 2 highlights the demographic and PROMS data for the two patient groups. The DDD group had a higher female-to-male ratio (p = 0.006), a significantly higher proportion of patients receiving disability benefits (p = 0.001), and worse Eq-5D VAS scores (p = 0.040). The disk herniation group had worse VAS leg scores (p = 0.004) and higher surgical expectation scores (p = 0.032).
Table 2. Patient demographics.
| DDD | Disk prolapse | ||||||
|---|---|---|---|---|---|---|---|
| Mean | 95% CI | n | Mean | 95% CI | n | p Value | |
| Age (y) | 39.1 | 37.1–41.0 | 58 | 39.1 | 37.6–40.5 | 107 | 0.986 |
| Sex, male:female (% male) | 19:39 (32.8%) | 58 | 59:48 (55.1%) | 107 | 0.006 | ||
| VAS back (10 total) | 7.4 | 6.8–7.9 | 58 | 6.6 | 6.2–7.1 | 107 | 0.060 |
| VAS leg (10 total) | 5.3 | 4.7–6.0 | 58 | 6.7 | 6.1–7.2 | 107 | 0.004 |
| Walking distance (yards) | 567 | 407–726 | 57 | 650 | 528–772 | 106 | 0.416 |
| Disability benefit, yes:no (% yes) | 16:42 (27.6%) | 58 | 9:96 (8.6%) | 105 | 0.001 | ||
| Eq-5D VAS (%) | 41 | 32.7–49.1 | 20 | 53 | 46.1–60.3 | 44 | 0.040 |
| Expectations (80 total) | 47.2 | 35.9–58.5 | 17 | 58.8 | 53.5–64.0 | 39 | 0.032 |
| ODI (%) | 50.7 | 45.7–55.7 | 57 | 45.8 | 42.1–49.5 | 106 | 0.122 |
| PHQ9 (27 total) | 12.9 | 10.9–14.8 | 57 | 12.0 | 10.6–13.4 | 103 | 0.470 |
| GAD7 (21 total) | 9.1 | 7.2–10.9 | 57 | 8.6 | 7.4–9.8 | 102 | 0.672 |
| Disease at 1 level | 72 | 42 | |||||
| Disease at 2 levels | 67 | 47 | |||||
| Disease at 3 levels | 18 | 18 | |||||
Abbreviations: CI, confidence interval; DDD, degenerative disk disease; Eq-5D, EuroQol-5D; GAD7, Generalized Anxiety Disorder 7-item; ODI, Oswestry Disability Index; PHQ, Patient Health Questionnaire-9; VAS, visual analog scale.
The difference in the subcutaneous fat thickness between the two groups at the level of L3–L4, L4–L5, and L5–S1 intervertebral disks are shown in Table 3. Analysis demonstrated that the difference in fat thickness was significant at all levels (p < 0.005); those with DDD alone, however, had significantly more subcutaneous fat compared with those with disk herniations.
Table 3. Subcutaneous fat thickness in millimeters between the lumbar DDD group and focal disk herniation group at the level of L3–L4, L4–L5, and L5–S1 intervertebral disks.
| DDD | Disk prolapse | ||||||
|---|---|---|---|---|---|---|---|
| Mean | 95% CI | n | Mean | 95% CI | n | p Value | |
| L3–L4 | 25.4 | 21.5–29.3 | 58 | 18.7 | 16.6–20.9 | 106 | 0.0017 |
| L4–L5 | 29.1 | 25.0–33.1 | 58 | 22.1 | 19.6–24.5 | 106 | 0.002 |
| L5–S1 | 32.2 | 28.0–36.5 | 58 | 25.3 | 22.7–27.9 | 106 | 0.004 |
Abbreviations: CI, confidence interval; DDD, degenerative disk disease.
There were no statistically significant differences in the fat infiltration of psoas major, erector spinae, and multifidus at any of the three lumbar levels between the two patient groups (Table 4). Comparatively, between the two groups the muscle-to-fat ratio and measured muscle remained consistent at each level. The greatest fatty atrophy was seen in the erector spinae at the disk level L5–S1 with only 65 and 61.6% muscle in the DDD and disk prolapse groups, respectively. Minimal changes in fat infiltration were noted in the psoas major at all levels, with the percentage of muscle remaining above 90% in both groups.
Table 4. Muscle-to-fat ratio of psoas major, erector spinae, and multifidus between lumbar DDD and disk herniation groups at L3–L4, L4–L5, and L5–S1 intervertebral disk levels.
| DDD | Disk prolapse | ||||
|---|---|---|---|---|---|
| Mean | 95% CI | Mean | 95% CI | p Value | |
| L3–L4 | |||||
| Psoas major | 0.926 | 0.910–0.942 | 0.938 | 0.928–0.948 | 0.180 |
| Erector spinae | 0.812 | 0.796–0.835 | 0.828 | 0.812–0.844 | 0.358 |
| Multifidus | 0.844 | 0.818–0.869 | 0.833 | 0.812–0.854 | 0.532 |
| L4–L5 | |||||
| Psoas major | 0.950 | 0.936–0.964 | 0.950 | 0.936–0.963 | 0.960 |
| Erector spinae | 0.767 | 0.734–0.799 | 0.780 | 0.762–0.797 | 0.445 |
| Multifidus | 0.822 | 0.792–0.852 | 0.831 | 0.812–0.850 | 0.615 |
| L5–S1 | |||||
| Psoas major | 0.960 | 0.947–0.973 | 0.953 | 0.942–0.964 | 0.426 |
| Erector spinae | 0.650 | 0.623–0.677 | 0.616 | 0.592–0.640 | 0.082 |
| Multifidus | 0.803 | 0.778–0.828 | 0.805 | 0.785–0.825 | 0.879 |
Abbreviations: CI, confidence interval; DDD, degenerative disk disease.
Fig. 6 shows that the muscle-to-fat ratio of the psoas major increased as we descended intervertebral disk levels. This increase is in direct contrast to the erector spinae and multifidus where the muscle-to-fat ratio decreased on descending intervertebral disk levels as shown in Figs. 7 and 8. The most significant differences occurred in the erector spinae between L3–L4 and L4–L5 and between L4–L5 and L5–L1 levels in patients with DDD and disk herniation (p = 0.005 and p < 0.001).
Fig. 6.
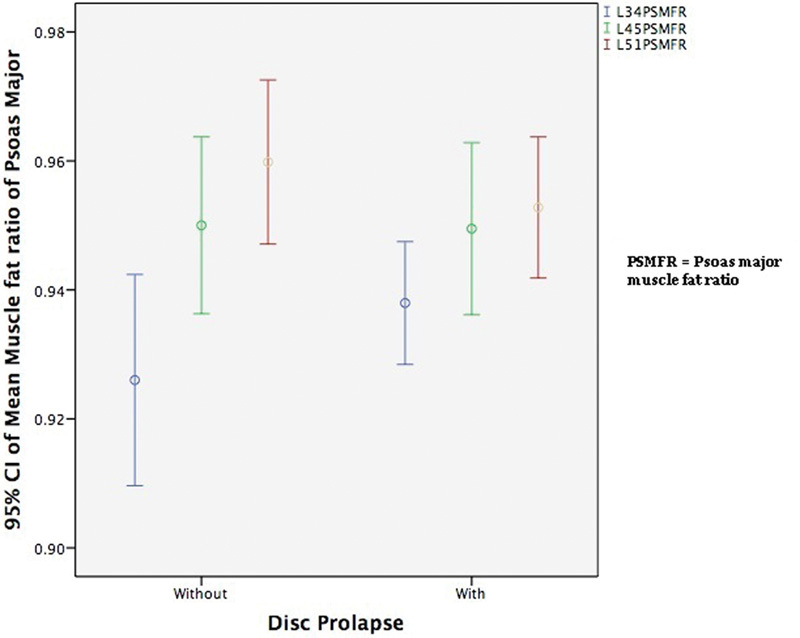
The mean muscle-to-fat ratio of psoas major at L3–L4, L4–L5, and L5–S1 for patients with and without disk herniations. Abbreviations: CI, confidence interval; PSMFR, psoas major muscle-to-fat ratio.
Fig. 7.
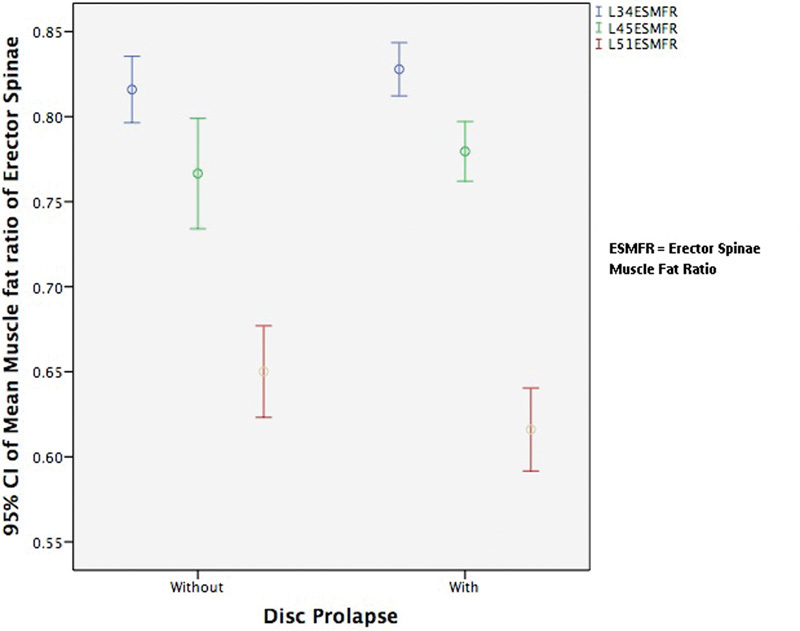
The mean muscle-to-fat ratio of erector spinae at L3–L4, L4–L5, and L5–S1 for patients with and without disk herniation. Abbreviations: CI, confidence interval; ESMFR, erector spinae muscle-to-fat ratio.
Fig. 8.
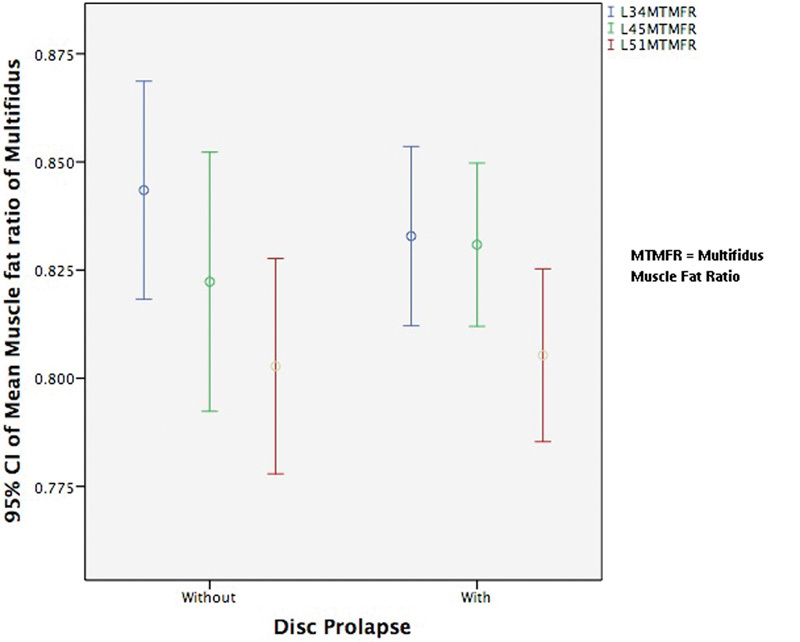
The mean muscle-to-fat ratio of multifidus at L3–L4, L4–L5, and L5–S1 for patients with and without disk herniation. Abbreviations: CI, confidence interval; MTMFR, multifidus muscle-to-fat ratio.
On analysis of the average muscle-to-fat ratio with the PROMS for patients with DDD (Table 5), only age seemed to be related to fatty infiltration at the L3–L4 level. The fat thickness corresponded to the average subcutaneous fat of all nine measurements as three independent measurements were performed per intervertebral level.
Table 5. Average muscle-to-fat ratio of erector spinae and multifidus versus PROMS for patients with DDD at L3–L4, L4–L5, and L5–S1 levels, and the average subcutaneous fat thickness of all three levels.
| L3–L4 | L4–L5 | L5–S1 | Fat thickness | |||||
|---|---|---|---|---|---|---|---|---|
| r | p | r | p | r | p | r | p | |
| Age (y) | −0.353 | 0.007 | −0.182 | 0.171 | −0.196 | 0.140 | −0.053 | 0.692 |
| VAS back (10 total) | 0.070 | 0.604 | 0.095 | 0.729 | 0.038 | 0.777 | −0.084 | 0.531 |
| VAS leg (10 total) | 0.086 | 0.520 | 0.038 | 0.775 | 0.071 | 0.597 | −0.138 | 0.300 |
| Walking distance (yards) | 0.061 | 0.654 | −0.037 | 0.785 | 0.022 | 0.871 | −0.235 | 0.079 |
| Eq-5D VAS (%) | 0.334 | 0.150 | 0.243 | 0.302 | 0.202 | 0.394 | −0.223 | 0.345 |
| Expectations (80 total) | −0.106 | 0.686 | 0.106 | 0.685 | −0.009 | 0.974 | 0.449 | 0.070 |
| ODI (%) | 0.005 | 0.971 | 0.141 | 0.296 | 0 | 0.999 | 0.167 | 0.215 |
| PHQ9 (27 total) | −0.158 | 0.242 | −0.036 | 0.792 | −0.044 | 0.745 | 0.181 | 0.178 |
| GAD7 (21 total) | −0.184 | 0.170 | −0.152 | 0.260 | −0.158 | 0.241 | 0.025 | 0.855 |
Abbreviations: DDD, degenerative disk disease; Eq-5D, EuroQol-5D; GAD7, Generalized Anxiety Disorder 7-item; ODI, Oswestry Disability Index; PHQ, Patient Health Questionnaire-9; PROMS, patient-reported outcome measures; r, Pearson r; VAS, visual analog scale.
Table 6 shows the comparison of sex and disability benefits (binary markers). In the DDD patient group, more subcutaneous fat was associated with disability (p < 0.001), which is highlighted in Fig. 9. In both the DDD and disk herniation groups, women had more subcutaneous fat than men (p = 0.013 and p < 0.001, respectively). There also was a marked difference in the muscle-to-fat ratio between men and women at the level of L5–S1 (p = 0.003 and p < 0.001, respectively) in both patient groups. Men had a significantly higher muscle-to-fat ratio than women at this level, which is demonstrated in Table 6.
Table 6. Average muscle-to-fat ratio of erector spinae and multifidus and average fat thickness of all three levels versus sex and disability benefit between patients with lumbar DDD and patients with disk herniation.
| DDD | Disk prolapse | |||||||
|---|---|---|---|---|---|---|---|---|
| L3–L4 | L4–L5 | L5–S1 | Fat | L3–L4 | L4–L5 | L5–S1 | Fat | |
| Sex (p value) | 0.513 | 0.102 | 0.003 | 0.013 | 0.204 | 0.168 | <0.001 | <0.001 |
| Disability benefit (p value) | 0.878 | 0.553 | 0.145 | 0.001 | 0.387 | 0.812 | 0.570 | 0.916 |
Abbreviation: DDD, degenerative disk disease.
Fig. 9.
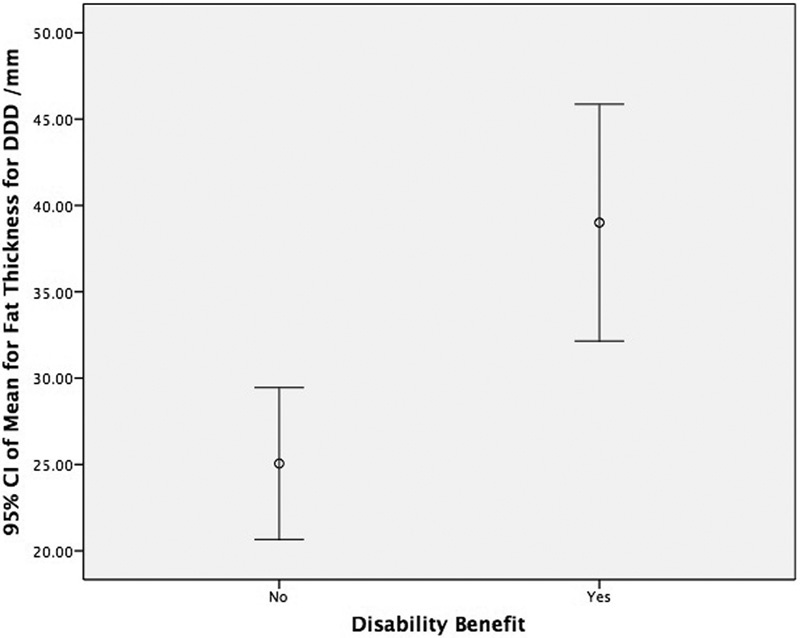
The mean fat thickness between those with and without disability benefit in patients with DDD. Abbreviations: CI, confidence interval; DDD, degenerative disk disease.
On comparing the average muscle-to-fat ratio to PROMS in patients with disk herniation (Table 7), the only statistically significant value was age with a strongly negative Pearson correlation. This fact highlighted that as age increased, the muscle-to-fat ratio decreased, with greater fat infiltration at the L3–L4 level.
Table 7. Average muscle-to-fat ratio of erector spinae and multifidus versus PROMS score for patients with focal disk herniation at L3–L4, L4–L5, and L5–S1 intervertebral disk levels.
| L3–L4 | L4–L5 | L5–S1 | Fat thickness | |||||
|---|---|---|---|---|---|---|---|---|
| r | p | r | p | r | p | r | p | |
| Age (y) | −0.363 | <0.001 | −0.393 | <0.001 | −0.175 | 0.071 | −0.103 | 0.295 |
| VAS neck and back (10 total) | −0.022 | 0.821 | −0.091 | 0.352 | 0.071 | 0.465 | 0.089 | 0.363 |
| VAS arm and leg (10 total) | −0.057 | 0.559 | 0.036 | 0.713 | 0.136 | 0.161 | 0.012 | 0.902 |
| Walking distance (yards) | 0.058 | 0.556 | 0.072 | 0.463 | −0.060 | 0.538 | 0.009 | 0.929 |
| Eq-5D VAS (%) | −0.139 | 0.367 | 0.074 | 0.634 | −0.099 | 0.520 | −0.012 | 0.938 |
| Expectations (80 total) | 0.256 | 0.116 | −0.022 | 0.895 | 0.081 | 0.624 | 0.005 | 0.978 |
| ODI (%) | −0.043 | 0.662 | −0.053 | 0.593 | 0.127 | 0.194 | 0.086 | 0.381 |
| PHQ9 (27 total) | −0.066 | 0.507 | −0.075 | 0.453 | −0.031 | 0.758 | 0.116 | 0.246 |
| GAD7 (21 total) | −0.071 | 0.481 | −0.127 | 0.204 | −0.046 | 0.649 | 0.088 | 0.383 |
Abbreviations: DDD, degenerative disk disease; Eq-5D, EuroQol-5D; GAD7, Generalized Anxiety Disorder 7-item; ODI, Oswestry Disability Index; PHQ, Patient Health Questionnaire-9; PROMS, patient-reported outcome measures; r, Pearson r; VAS, visual analog scale.
Discussion
Studying the LPMs in patients with low back pain is compelling, as they may be not just an expression of an underlying spinal disability but also a source of back pain. A better understanding of the role of LPM dysfunction would potentially increase therapeutic effects by enabling the most appropriate treatment strategy to be performed, whether physiotherapy, paravertebral injections, acupuncture, osteopathy, or surgery. The less effective the treatment strategy, the longer the individual will be disabled by back pain, which will result in an increase in health care cost. The majority of the cost of back pain, estimated to be £500 million annually to the National Health Service in the United Kingdom, is from the small proportion of individuals with chronic symptoms. Therefore, the clinical relevance in studying the LPM for early therapeutic intervention is clear: to reduce the widespread burden of low back pain.17
To our knowledge, this study is the first to examine correlations of the muscle-to-fat ratio of the LPMs to PROMS scores in patients with lumbar DDD and focal disk herniations. We chose these two patient groups because disks that herniate underlie degenerative pathomechanisms similar to that of lumbar DDD, and furthermore, they share similar management strategies of their associated low back pain symptomatology. Consequently, the rationale to focus on the two pathologies of lumbar DDD and disk herniations arose from their commonalities, along with their high prevalence.
MRI was of interest to us because it shows morphological changes affecting muscles in a noninvasive way, and changes in the muscle-to-fat ratio seen in fatty atrophy are characterized by a decrease in muscle bulk with an increase in fat infiltration, a phenomenon often referred to as “marbling.” PROMS questionnaires are attempts to measure the outcomes most relevant to patients in a standardized and validated form. Clinicians' understanding of the effect of disease and treatment on patients' daily lives remains incomplete.18 The use of PROMS in everyday practice has the potential to narrow the gap between the clinician's and the patient's view of clinical reality and help tailor treatment plans to meet the patient's preferences and needs.19 The evidence shows that the systematic use of PROMS information leads to improved communication and decision making between doctors and patients and improves patient satisfaction with care.20
We found that the muscle-to-fat ratio is not significantly related to PROMS and that there was no difference in the ratio between the DDD and disk herniation subsets. However, interesting findings were noted regarding the subcutaneous fat thickness, which was significantly greater in patients with low back pain (DDD) compared with those with disk herniations.
Parkkola et al found that the psoas major muscle of patients with chronic low back pain was smaller compared with healthy subjects.6 Although our study did not compare healthy patients, our data did not support Parkkola et al,6 because we found that the muscle-to-fat ratio of the psoas major remained consistently above 90% for all three levels in both conditions. As expected, we found that the muscle-to-fat ratio of the psoas major increased with descending levels from L3–L4 to L5–S1 and that the muscle-to-fat ratio of the erector spinae and multifidus decreased as the muscle bellies thin out while inserting on the lower lumbar vertebrae.
We also analyzed the cross-sectional area muscle and cross-sectional area fat and muscle together and found no significant relationships at any level for any muscle group. These findings lie more in concordance with the results of Danneels et al,1 who reported no significant decrease in the cross-sectional area of erector spinae muscles for patients with chronic low back pain.
Previous studies have established that the short segmental LPMs are recruited to control rotation and stabilization to support spinal stiffness. As a result, changes in the composition of these muscles would likely impede intervertebral stability, in turn causing spinal dysfunction and low back pain. According to Hides et al,21 the mechanism of the muscle wasting was not generalized disuse atrophy or spinal reflex inhibition. The wasting was thought to be because of inhibition due to perceived pain, via a long loop reflex targeting the vertebral-level pathology to protect the damaged tissues. However, why changes in the muscle-to-fat ratio did not correlate to the incidence of disk herniations must be ascertained. The reason is likely due to the fact that disk herniations usually occur as an acute event. The DDD cohort on average had back pain for more than 2 years before seeing the consultant spinal surgeon, compared with the disk prolapse cohort who had pain for less than 1 year. Therefore, there would be less time for the fatty atrophy to manifest in the disk herniation group. This time course was illustrated by Hodges et al,22 who performed a case–control animal study to assess the structural changes in muscle, adipose, and connective tissue of the back muscles after intervertebral disk injury. They found that following injury, several cytokines (tumor necrosis factor α and interleukin-1β) and molecules are released that signal trophic/atrophic processes, resulting in increased adipose and connective tissue cross-sectional area at 6 months but not at 3 months following injury.
Kjaer et al noted that over time, the size and properties of the lumbar muscles in patients with low back pain are altered, and structural changes are seen in muscle degeneration.23 These changes are defined by a decrease in the amount of muscle, accompanied by an increase in fat infiltration.24 25 The most significant changes of fatty atrophy occur in the erector spinae muscles. In addition to trunk movement, the other important function of the erector spinae muscles is to act as global stabilizers of the spinal column by generating force to control the range of spinal movement through eccentric contractions.26 Furthermore, the process of intervertebral disk degeneration can also lead to morphological changes in the psoas major muscle. This muscle assists lumbar stability and helps to keep the body erect in all three planes (frontal, horizontal, sagittal), as well as being a significant hip flexor.27 It is therefore not surprising that changes in the cross-sectional diameter of both the erector spinae and the psoas major muscles could lead to a loss of proper biomechanics and distort the spine–pelvis complex, hence contributing to low back pain.28 Immobilization of these muscles due to low back pain in turn would cause fatty atrophy in both the flexor and extensor muscles of the spinal column.29 30
The perhaps most significant finding of this study was that those patients with lumbar DDD (low back pain) had more subcutaneous fat thickness than those in the disk herniation group. A possible explanation may be due to the extra strain placed on the intervertebral disks, which can accelerate the deterioration of the osteocartilaginous components of the spine, hence contributing to further lumbar back pain.31 The cause of the increased subcutaneous fat may also be secondary to a lack of exercise as a result of pain. This conclusion is supported by the Medical Research Council trial of an intensive rehabilitation program for patients with chronic low back pain.32 This finding may have an important clinical implication because it provides evidence that patients with DDD generally are more obese. Therefore, counteracting obesity could reduce the number of patients with DDD and relieve a proportion of the burden on health care payors. It is important to note that our study highlighted that there also was a significantly greater number of patients on disability benefits in the DDD group as compared with the disk herniation group, despite the latter group reporting more leg pain.
No power calculation was conducted for our study; however, a recent study published by Teichtahl et al on the fat infiltration of the LPM in patients with low back pain and disability stated that their study was adequately powered with a sample size of 72.33 Our study has more than twice that number of patients, leading us to conclude that the power of our study should be sufficient. Teichtahl et al concluded that paraspinal fat infiltration was associated with pain, disability, and structural abnormalities in the lumbar spine.33 This conclusion contrasts with the results of our study; however, they took into account the fat around and outside the muscle bulk, whereas we only counted the marbled fat within the muscle bulk.
One of the limitations of our present study was the absence of a control group, because only patients with DDD and disk prolapse were analyzed. However, because there was negligible change in the composition of the psoas major throughout the study, these measurements served as a indirect measure of comparison. Furthermore, one of our results showed that for both groups, women have significantly more subcutaneous fat than men. However, women naturally have a greater percentage of body fat than men, therefore making it difficult to ascertain how much this gender influence contributes to the result. Although the psoas major, erector spinae, and multifidus were measured separately, we found it to become increasingly difficult to accurately define these boundaries on moving further caudal in the lumbar spine due to blurring of the anatomical landmarks. However, the reproducibility for muscle anatomy at the L5–S1 level was very good.
A pilot study was performed on whether the muscle fat content is associated to PROMS in patients with DDD, L4–L5 degenerative spondylolisthesis (DSPL), and L5–S1 lytic spondylolisthesis.11 One finding of this study was that there was no difference between the left and right LPM in relation to nonmuscular (fat) infiltration. This finding was corroborated by Hao and Xie,34 who found that the total cross-sectional area and percentage of fat infiltration area was no different between the left and right sides. As such, the left and right LPMs were recorded together in this study. The pilot study also found no difference in PROMS between the three groups and no association between the muscle fat content and any of the PROMS in any of the groups. The muscle content in the L4–L5 DSPL was significantly less than the other two groups, with the patient age in this group significantly higher than the other two. The muscle content significantly correlated with increasing age in the erector spinae muscles at all levels in all three groups (p < 0.01). The psoas major muscle content was not associated with increasing age except in the L3–L4 and L5–S1 levels of the L4–L5 DSPL group (p < 0.05). This study concluded that muscle fat content in the erector spinae, multifidus, and psoas muscles does not appear to be related to PROMS and that muscle content decreases with age. Given that this pilot study arrived at the same conclusions as ours, these results increase the validity of both studies.
Conclusion
In conclusion, we found no correlation between the MRI muscle-to-fat ratio of the LPMs and the PROMS data. However, importantly, we did find that the muscle-to-fat ratio decreases with age and that those patients with more chronic low back pain associated with DDD have more subcutaneous fat.
Footnotes
Disclosures Ashwin Bhadresha: none Owen John Lawrence: none Michael J. H. McCarthy: none
Editorial Perspective
This study by Lawrence et al was well received by our reviewers after thorough reworking of the statistical analysis.
The study takes a comprehensive view at the potential correlation of lower back muscle health as demonstrated on axial MRI. Indeed, lumbar paraspinal muscles have been long overlooked as a readily available additional source of insight—after all, every MRI scan on its axial images would seemingly allow for assessment of the soft tissue health of its bearer. In reality, this available potentially valuable source of information has been woefully overlooked in over three decades of routine clinical spine MRIs.
The authors deserve praise for being among the very few to have systematically studied the lumbar paraspinal muscle phenotypography using neuroimaging, and moreover, they have attempted to correlate their findings to validated patient-reported outcomes (PRO) scores. This project undoubtedly required a lot of measurement work given the reasonable sample size the authors were able to draw from.
Somewhat surprisingly, the main lumbar soft tissue abnormality the authors detected was not in the muscle quality or quantity but the depth of dorsal subcutaneous fat, which the authors alertly had also measured. Poor PROs indeed correlated positively with increased trunk obesity as expressed in increased subcutaneous fat accumulation. There was also a positive correlation with presence of disability benefits.
As in most studies, our reviewers found some noteworthy opportunities for future investigative improvement. The authors limited their study to patients who were registered in their database under one of two general lumbar spine conditions—DDD and herniated nucleus pulposus. This concept had some appeal as one cohort (the DDD group) would presumably be affected more by chronicity of symptoms compared with the other group (herniated nucleus pulposus group), which would likely present with shorter duration of symptoms. This change in turn would allow for some insights because the duration and type of pain and dysfunction could conceivably be reflected in muscle dysfunction. Our reviewers noted the absence of a “normal” comparison group to establish normative baselines. Moreover, the severity of the DDD group was not established—for instance, by reporting on presence of Modic changes or rating severity of disk degeneration with the Pfirrmann scale. Similarly, the duration of clinically significant symptoms was not really reported for either clinical group, which may impact significantly the chronicity of the DDD and that of the herniated nucleus pulposus group. Patients with radiculopathy denervation of semispinalis and multifidus muscles might influence one side disproportionally more than the other.
The other relevant finding was an intuitively clear one, but nonetheless there was a significant impact on nonoperative care. Elderly patients were found to have significant decrease in paraspinal muscle diameter, which if taken together with the insight of progressive sagittal vertical axis loss with aging again drives home the need to enhance postural trunk extension exercises with muscle training in the elderly to minimize the risk of progressive trunk forward tilt. The study likely also reinforces the wisdom of having patients wait for an elective major lumbar procedure until they have lost significant weight and clearance of benefit claims to make sure that that the patient has achieved reasonable weight reduction. The authors have certainly done a very thorough job to try to clarify the correlation of low back pain and a variety of outcomes tests. This study may very well be the start of a more in-depth assessment of paraspinal muscle health and validated rehabilitation effects on serial imaging studies to better express the effects of exercise reactivation and postoperative muscle denervation in patient outcomes.
In the end, this study suggests that we have not missed anything by not paying closer attention to the volume and consistency of the lumbar paraspinal muscles from a preoperative diagnostic method. There are two significant findings: the frequently overlooked health of the lumbar paraspinal muscles as seen on MRI was found to not correlate with standard patient outcomes findings in two common, but different lumbar spinal conditions—the more acute disk herniation and the more chronic disk degeneration. Correlations were identified of poor PROs and increased subcutaneous fat accumulation in patients as well as decreased health of paraspinal muscles in older patients. Increased subcutaneous fat was also found to be correlated to the presence of disability benefits.
References
- 1.Danneels L A, Vanderstraeten G G, Cambier D C, Witvrouw E E, De Cuyper H J. CT imaging of trunk muscles in chronic low back pain patients and healthy control subjects. Eur Spine J. 2000;9(4):266–272. doi: 10.1007/s005860000190. [DOI] [PMC free article] [PubMed] [Google Scholar]
- 2.Mengiardi B, Schmid M R, Boos N. et al. Fat content of lumbar paraspinal muscles in patients with chronic low back pain and in asymptomatic volunteers: quantification with MR spectroscopy. Radiology. 2006;240(3):786–792. doi: 10.1148/radiol.2403050820. [DOI] [PubMed] [Google Scholar]
- 3.Hoy D, Brooks P, Blyth F, Buchbinder R. The epidemiology of low back pain. Best Pract Res Clin Rheumatol. 2010;24(6):769–781. doi: 10.1016/j.berh.2010.10.002. [DOI] [PubMed] [Google Scholar]
- 4.Kamaz M, Kireşi D, Oğuz H, Emlik D, Levendoğlu F. CT measurement of trunk muscle areas in patients with chronic low back pain. Diagn Interv Radiol. 2007;13(3):144–148. [PubMed] [Google Scholar]
- 5.Biyani A, Andersson G B. Low back pain: pathophysiology and management. J Am Acad Orthop Surg. 2004;12(2):106–115. doi: 10.5435/00124635-200403000-00006. [DOI] [PubMed] [Google Scholar]
- 6.Parkkola R, Rytökoski U, Kormano M. Magnetic resonance imaging of the discs and trunk muscles in patients with chronic low back pain and healthy control subjects. Spine (Phila Pa 1976) 1993;18(7):830–836. doi: 10.1097/00007632-199306000-00004. [DOI] [PubMed] [Google Scholar]
- 7.Flicker P L, Fleckenstein J L, Ferry K. et al. Lumbar muscle usage in chronic low back pain. Magnetic resonance image evaluation. Spine (Phila Pa 1976) 1993;18(5):582–586. doi: 10.1097/00007632-199304000-00010. [DOI] [PubMed] [Google Scholar]
- 8.Kader D FF, Wardlaw D, Smith F W. Correlation between the MRI changes in the lumbar multifidus muscles and leg pain. Clin Radiol. 2000;55(2):145–149. doi: 10.1053/crad.1999.0340. [DOI] [PubMed] [Google Scholar]
- 9.Suri P, Fry A L, Gellhorn A C. Do muscle characteristics on lumbar spine magnetic resonance imaging or computed tomography predict future low back pain, physical function, or performance? A systematic review. PM R. 2015;7(12):1269–1281. doi: 10.1016/j.pmrj.2015.04.016. [DOI] [PubMed] [Google Scholar]
- 10.Wan Q, Lin C, Li X, Zeng W, Ma C. MRI assessment of paraspinal muscles in patients with acute and chronic unilateral low back pain. Br J Radiol. 2015;88(1053):2.0140546E7. doi: 10.1259/bjr.20140546. [DOI] [PMC free article] [PubMed] [Google Scholar]
- 11.Cunningham A, Saba K, McCarthy M. A comparison of (1) MRI muscle fat content in psoas erector spinae muscles and (2) patient-reported outcome measures in patients with lumbar degenerative disc disease, L4/L5 degenerative spondylolisthesis and L5/S1 spondylolisthesis. Presentations from the British Association of Spinal Surgeons; Britspine 2014. Eur Spine J. 2014 [Google Scholar]
- 12.Fairbank J C Pynsent P B The Oswestry Disability Index Spine (Phila Pa 1976) 200025222940–2952., discussion 2952 [DOI] [PubMed] [Google Scholar]
- 13.Kroenke K, Spitzer R L, Williams J B. The PHQ-9: validity of a brief depression severity measure. J Gen Intern Med. 2001;16(9):606–613. doi: 10.1046/j.1525-1497.2001.016009606.x. [DOI] [PMC free article] [PubMed] [Google Scholar]
- 14.Spitzer R L, Kroenke K, Williams J B, Löwe B. A brief measure for assessing generalized anxiety disorder: the GAD-7. Arch Intern Med. 2006;166(10):1092–1097. doi: 10.1001/archinte.166.10.1092. [DOI] [PubMed] [Google Scholar]
- 15.Yee A, Adjei N, Do J, Ford M, Finkelstein J. Do patient expectations of spinal surgery relate to functional outcome? Clin Orthop Relat Res. 2008;466(5):1154–1161. doi: 10.1007/s11999-008-0194-7. [DOI] [PMC free article] [PubMed] [Google Scholar]
- 16.Gundersen H J, Jensen E B. The efficiency of systematic sampling in stereology and its prediction. J Microsc. 1987;147(Pt 3):229–263. doi: 10.1111/j.1365-2818.1987.tb02837.x. [DOI] [PubMed] [Google Scholar]
- 17.Macfarlane G J, Thomas E, Croft P R, Papageorgiou A C, Jayson M I, Silman A J. Predictors of early improvement in low back pain amongst consulters to general practice: the influence of pre-morbid and episode-related factors. Pain. 1999;80(1–2):113–119. doi: 10.1016/s0304-3959(98)00209-7. [DOI] [PubMed] [Google Scholar]
- 18.Nelson E, Conger B, Douglass R. et al. Functional health status levels of primary care patients. JAMA. 1983;249(24):3331–3338. [PubMed] [Google Scholar]
- 19.Barry M J, Edgman-Levitan S. Shared decision making—pinnacle of patient-centered care. N Engl J Med. 2012;366(9):780–781. doi: 10.1056/NEJMp1109283. [DOI] [PubMed] [Google Scholar]
- 20.Chen J, Ou L, Hollis S J. A systematic review of the impact of routine collection of patient reported outcome measures on patients, providers and health organisations in an oncologic setting. BMC Health Serv Res. 2013;13:211. doi: 10.1186/1472-6963-13-211. [DOI] [PMC free article] [PubMed] [Google Scholar]
- 21.Hides J A, Stokes M JP, Saide M, Jull G A, Cooper D H. Evidence of lumbar multifidus muscle wasting ipsilateral to symptoms in patients with acute/subacute low back pain. Spine (Phila Pa 1976) 1994;19(2):165–172. doi: 10.1097/00007632-199401001-00009. [DOI] [PubMed] [Google Scholar]
- 22.Hodges P W, James G, Blomster L. et al. Multifidus muscle changes after back injury are characterized by structural remodeling of muscle, adipose and connective tissue, but not muscle atrophy: molecular and morphological evidence. Spine (Phila Pa 1976) 2015;40(14):1057–1071. doi: 10.1097/BRS.0000000000000972. [DOI] [PubMed] [Google Scholar]
- 23.Kjaer P, Bendix T, Sorensen J S, Korsholm L, Leboeuf-Yde C. Are MRI-defined fat infiltrations in the multifidus muscles associated with low back pain? BMC Med. 2007;5(1):2. doi: 10.1186/1741-7015-5-2. [DOI] [PMC free article] [PubMed] [Google Scholar]
- 24.Kang C H, Shin M J, Kim S M, Lee S H, Lee C S. MRI of paraspinal muscles in lumbar degenerative kyphosis patients and control patients with chronic low back pain. Clin Radiol. 2007;62(5):479–486. doi: 10.1016/j.crad.2006.12.002. [DOI] [PubMed] [Google Scholar]
- 25.Valentin S, Licka T, Elliott J. Age and side-related morphometric MRI evaluation of trunk muscles in people without back pain. Man Ther. 2015;20(1):90–95. doi: 10.1016/j.math.2014.07.007. [DOI] [PMC free article] [PubMed] [Google Scholar]
- 26.Hesse B, Fröber R, Fischer M S, Schilling N. Functional differentiation of the human lumbar perivertebral musculature revisited by means of muscle fibre type composition. Ann Anat. 2013;195(6):570–580. doi: 10.1016/j.aanat.2013.07.003. [DOI] [PubMed] [Google Scholar]
- 27.Barker K L, Shamley D R, Jackson D. Changes in the cross-sectional area of multifidus and psoas in patients with unilateral back pain: the relationship to pain and disability. Spine (Phila Pa 1976) 2004;29(22):E515–E519. doi: 10.1097/01.brs.0000144405.11661.eb. [DOI] [PubMed] [Google Scholar]
- 28.Ploumis A, Michailidis N, Christodoulou P, Kalaitzoglou I, Gouvas G, Beris A. Ipsilateral atrophy of paraspinal and psoas muscle in unilateral back pain patients with monosegmental degenerative disc disease. Br J Radiol. 2011;84(1004):709–713. doi: 10.1259/bjr/58136533. [DOI] [PMC free article] [PubMed] [Google Scholar]
- 29.Lee J C, Cha J G, Kim Y, Kim Y I, Shin B J. Quantitative analysis of back muscle degeneration in the patients with the degenerative lumbar flat back using a digital image analysis: comparison with the normal controls. Spine (Phila Pa 1976) 2008;33(3):318–325. doi: 10.1097/BRS.0b013e318162458f. [DOI] [PubMed] [Google Scholar]
- 30.Teichtahl A J, Urquhart D M, Wang Y. et al. Physical inactivity is associated with narrower lumbar intervertebral discs, high fat content of paraspinal muscles and low back pain and disability. Arthritis Res Ther. 2015;17(1):114. doi: 10.1186/s13075-015-0629-y. [DOI] [PMC free article] [PubMed] [Google Scholar]
- 31.Balagué F, Mannion A F, Pellisé F, Cedraschi C. Non-specific low back pain. Lancet. 2012;379(9814):482–491. doi: 10.1016/S0140-6736(11)60610-7. [DOI] [PubMed] [Google Scholar]
- 32.Fairbank J Frost H Wilson-MacDonald J Yu L-M Barker K Collins R; Spine Stabilisation Trial Group. Randomised controlled trial to compare surgical stabilisation of the lumbar spine with an intensive rehabilitation programme for patients with chronic low back pain: the MRC spine stabilisation trial BMJ 200533075021233. [DOI] [PMC free article] [PubMed] [Google Scholar]
- 33.Teichtahl A J, Urquhart D M, Wang Y. et al. Fat infiltration of paraspinal muscles is associated with low back pain, disability, and structural abnormalities in community-based adults. Spine J. 2015;15(7):1593–1601. doi: 10.1016/j.spinee.2015.03.039. [DOI] [PubMed] [Google Scholar]
- 34.Hao D, Xie E. Study of lumbar multifidus muscles in patients with chronic low back pain and in degenerative scoliosis human: a blinded randomized controlled trial (RCT). Eurospine 2015, Copenhagen. Eur Spine J. 2015;24 06:S669–S710. [Google Scholar]