

Abstract
Few studies have assessed postoperative trends in opioid cessation and predictors of persistent opioid use after total knee arthroplasty (TKA) and total hip arthroplasty (THA). Preoperatively 574 TKA and THA patients completed validated, self-report measures of pain, functioning and mood and were longitudinally assessed for 6-months post-surgery. Among patients who were opioid naïve the day of surgery, 8.2% of TKA and 4.3% of THA patients were using opioids at 6 months. In comparison, 53.3% of TKA and 34.7% of THA patients who reported opioid use the day of surgery continued to use opioids at 6 months. Patients taking >60 mg oral morphine equivalents preoperatively had an 80% likelihood of persistent use postoperatively. Day of surgery predictors for 6-month opioid use by opioid naïve patients included greater overall body pain (p=0.002), greater affected joint pain (knee/hip) (p=0.034), and greater catastrophizing (p=0.010). For both opioid naïve and opioid users on day of surgery, decreases in overall body pain from baseline to 6 months were associated with decreased odds of being on opioids at 6 months (aOR=0.72, p=0.050; aOR=0.62, p=0.001); however, change in affected joint pain (knee/hip) was not predictive of opioid use (aOR=0.99, p=0.939; aOR=1.00, p=0.963). In conclusion, many patients taking opioids prior to surgery continue to use opioids after arthroplasty and some opioid naïve patients remained on opioids; however persistent opioid use was not associated with change in joint pain. Given growing concerns about chronic opioid use, the reasons for persistent opioid use and perioperative prescribing of opioids deserve further study.
1. Introduction
Total knee arthroplasty (TKA) and total hip arthroplasty (THA) are two of the most common and successful surgical interventions performed annually to treat pain in the affected joint [10; 12; 15] and, with the aging population, the number of arthroplasties conducted each year is projected to increase at a staggering rate [13]. Whereas opioids are a mainstay for managing acute postoperative pain [4] and are the primary analgesic modality for TKA and THA after discharge, clinicians and researchers are now more critical of long-term use of opioids for chronic pain [6; 8; 16], including osteoarthritis[11; 17]. What is not well understood is how opioid use changes following arthroplasty and what factors predict their persistent opioid use.
Despite growing scientific and clinical interest in opioids, surprisingly few studies have explored opioid use in patients undergoing surgical interventions for the treatment of pain. The limited data on opioid cessation following arthroplasty suggests that the majority of patients discontinue opioids soon after surgery. For instance, among a national sample of patients who underwent a TKA, 14% of patients taking opioids prior to TKA and 3% of opioid naïve patients (i.e., patients started on opioids postoperatively) continued opioids at 12 months [7]. Studies have also identified several predictors of opioid use following arthroplasty. Franklin and colleagues used a large national dataset to assess persistent opioid use following TKA and found that opioid use prior to arthroplasty and persistent pain at the surgical site were associated with having an opioid prescription 12 months post arthroplasty [7]. Similarly, using a database from the Mayo Clinic, Singh and colleagues separately analyzed TKA [20] and THA [19] outcomes. Female gender [19; 20], younger age [19; 20], higher BMI [19; 20], and pre-operative anxiety [20] were associated with opioid use 2 and 5 years post arthroplasty. While these findings are novel, the researchers were unable to account for preoperative opioid use in their analyses, did not include measures of pain and functioning, and were limited to billing data for assessments of anxiety and depression.
Well-designed prospective studies that assess patterns of opioid use and predictors of continued use are needed in order to enhance pre- and post-operative pain management. To this end, the current study of prospectively collected data has three primary aims and hypotheses: (1) To explore the natural course of opioid use in opioid naïve patients, as well as patients taking opioids preoperatively (we hypothesized most patients would achieve opioid cessation at 6 months), (2) To identify preoperative predictors of persistent opioid use 6 months post TKA and THA (hypothesized predictors included opioid use the day of surgery, greater pain at baseline, baseline symptoms of depression and anxiety), and (3) To examine how change in knee/hip pain from baseline to 6 months predicts opioid use at 6 months (we hypothesized that less improvement/pain relief in the affected joint (knee/hip) at 6 months would be associated with persistent opioid use).
2. Methods and Materials
2.1 Study Setting and Participants
This study is a secondary analysis of data from a prospective outcome study in patients undergoing TKA and THA [3]. Data collection and subsequent analyses were approved by the Institutional Review Board at the University of Michigan (Ann Arbor, MI). Between March 2010 and May 2013, patients were recruited from either a preoperative arthroplasty workshop or from the preoperative waiting area on the day of surgery. Patients were eligible to participate if they were scheduled for primary, unilateral TKA or THA and at least 18 years old. Exclusion criteria included being a non-English speaker, inability to provide written informed consent, bilateral arthroplasty, revision arthroplasty, and prisoners. All eligible participants completed a battery of validated self-report questionnaires preoperative on the day of their surgery and were followed longitudinally to assess surgical outcomes. Post arthroplasty data were collected at 1 and 3-months via telephone, and 6 months by mail. The predictors of arthroplasty outcomes have previously been published [3]. There were 576 eligible patients included in the current study. Two patients had missing data on current opioid use so they were excluded from the analyses, resulting in a final sample of 574 participants.
2.2 Measures
2.2.1 Preoperative and postoperative opioid use
Preoperative opioid use was recorded by a research assistant using a list of current medications obtained from a chart review of the patient’s medical records. All pain medications were reviewed with the patient to ensure accuracy, including the average daily dose. Patients were considered to be using opioid medication preoperatively if they confirmed the documented use of opioids. Patients who reported no opioid use the day of surgery were considered “opioid naïve,” which was confirmed both by chart review and verbal confirmation with the patient on the day of surgery. Postoperative opioid use was assessed at all follow up time points by reviewing current medications with the patient. Patients were considered to be using opioid medication postoperatively if they confirmed the use of opioids. For all patients reporting opioid use, a 24-hour oral morphine equivalency (OME) dose was calculated preoperatively and at all postoperative follow-up assessments. Patients were asked to confirm the correct dose and for as needed medications the average number of pills per day was determined.
2.2.2 Joint pain (Knee/Hip)
The Western Ontario and McMaster Universities Osteoarthritis Index (WOMAC) is a 24-item standardized questionnaire that is widely used to assess pain, stiffness, and function specific to the joints in patients with osteoarthritis of the knee and hip[1]. The WOMAC is divided into 3 subscales including pain (five items; range 0–20), stiffness (2 items; range 0–8), and physical functioning (17 items; range 0–68). The subscales were individually analyzed for descriptive and outcomes data.
2.2.3 Overall body pain
The Brief Pain Inventory (BPI) is a self-report scale that assesses both the severity of pain and impact of pain on daily functioning [5]. Overall pain severity was assessed using a 4-item subscale that asks about overall body pain at its worst and least in the last week, average pain, and pain right now. For each item, participants were asked to rate their overall pain on a scale of 0 (No Pain) to 10 (Pain as bad as you can imagine) [23]. The average of the four scores was used as a single composite measure of pain severity.
2.2.4 Symptoms of depression and anxiety
Depressive and anxiety symptoms were assessed using two 7-item subscales from the Hospital Anxiety and Depression Scale (HADS)[24]. The HADS is a brief and widely-used instrument to measure psychological distress in general and medical populations. A score on either subscale of 0 to 7 is considered within the normal range; a score of 8 to10 is suggestive of the presence of anxiety/depression; and a score of 11 or higher indicates a high probability that anxiety/depression is present.
2.2.5 Pain catastrophizing
Pain catastrophizing was assessed using the 6-item catastrophizing subscale from the Coping Strategies Questionnaire (CSQ) [18]. The CSQ catastrophizing subscale is a widely used scale that measures the extent that patients view pain as a threat and evaluate their ability to cope with pain [22]. Patients used a 7-point scale to rate how often they think like each item from 0 (never think that) to 6 (always think that).
2.3 Statistical analysis plan
All analyses were conducted with Stata version 13.1[21]. Baseline phenotypic differences between those on versus off opioids the day of surgery were examined using t-tests or chi-square tests as appropriate. To show the natural trajectory of opioid use following TKA or THA, we calculated the percentage of patients on opioids at 1 month, 3 months, and 6 months postoperatively for those taking and not taking opioids preoperatively (baseline). Next, univariate logistic regression models were conducted to compare the preoperative phenotypes of the patients not taking opioids 6 months after surgery to the patients with persistent opioid use. To examine how changes in pain from day of surgery to six months were related to opioid use at 6 months, change scores were calculated subtracting WOMAC knee/hip pain subscale and overall body pain (BPI) at 6 months from WOMAC knee/hip pain and overall body pain on day of surgery, respectively. These change scores were then included as predictors of opioid use at 6 months in two multivariate logistic regression models.
3. Results
3.1 Baseline phenotypic differences between participants reporting opioid use on the day of surgery (TKA or THA) compared to those not using opioids
Across the entire sample, 28.99% (N=167) of participants reported current opioid use the day of their TKA or THA. Participants’ already taking opioids on the day of their TKA or THA reported a worse phenotypic profile compared to participants not taking opioids the day of surgery. Current opioid users reported higher levels of pain in their surgery site (p <0.001), stiffness (p <0.001), functional impairment (p <0.001), overall body pain (p <0.001), and symptoms of depression (p <0.001), anxiety (p = 0.002), and catastrophizing (p = 0.001). Current opioid users were more likely to be younger (p < 0.001) and less likely to be Caucasian (p = 0.007). There were no significant differences in gender (p = 0.127) or type of surgery (p = 0.213). Please see Supplemental Table 1 for the details of these differences.
3.2 Natural course of opioid use following TKA and THA
To understand the natural course of opioid use following TKA and THA, opioid use at 1, 3 and 6 months was reported (See Table 1). Knee arthroplasty patients reporting opioid use the day of surgery reported greater opioid use at 6 months (53.3%) than those not taking opioids the day of surgery (8.2%) (p < 0.001). Hip arthroplasty patients reporting opioid use the day of surgery also reported greater opioid use at 6 months (34.7%) compared to those not taking opioids prior to surgery (4.3%) (p < 0.001). Further, 42% of opioid naïve TKA patients on opioids at 3 months were still on opioids at 6 months. For opioid naïve THA patients, 29% of those on opioids at 3 months were still on opioids at 6 months. In a logistic regression model controlling for age, race and gender, opioid use at 3 months was associated with a relative risk of 56 (p < 0.001) of being on opioids at 6 months. In the same model for opioid naïve THA patients, opioid use at 3 months was associated with a relative risk of 12 (p = 0.004) of being on opioids at 6 months.
Table 1.
Natural history of opioid use following TKA or THA at 1 month, 3 months, and 6 months post-surgery
| Knee arthroplasty | Month 1 | Month 3 | Month 6 |
|---|---|---|---|
| (n = 61) | (n = 54) | (n = 45) | |
| Preoperative opioid use (n = 64) | 54 (88.5%) | 26 (48.2%) | 24 (53.3%) |
|
| |||
| (n = 170) | (n = 169) | (n = 147) | |
| Opioid Naïve (n = 179) | 113 (66.5%) | 28 (16.6%) | 12 (8.2%) |
|
| |||
| Hip arthroplasty | Month 1 | Month 3 | Month 6 |
|
| |||
| (n = 97) | (n = 90) | (n = 75) | |
| Preoperative opioid use (n = 103) | 62 (63.9%) | 34 (37.8%) | 26 (34.7%) |
|
| |||
| (n = 222) | (n = 207) | (n = 189) | |
| Opioid Naïve (n = 228) | 50 (22.5%) | 9 (4.4%) | 8 (4.3%) |
Note. N’s vary due to missing data.
3.3 Baseline predictors of persistent opioid use 6 months post arthroplasty
In order to identify baseline predictors of persistent opioid use, we compared the preoperative phenotypes of those patients whose opioid use persisted 6 months after surgery to those patients not taking opioids at 6 months (See Table 2). On the day of surgery, univariate analyses demonstrated that persistent opioid users at 6 months reported worse pain in their surgery site (p < 0.001), greater functional impairment (p = 0.002), more stiffness (p = 0.001), increased overall body pain (p < 0.001), more symptoms of depression (p = 0.006), and higher levels of catastrophizing (p = 0.001). There was no difference in who continued to take opioids at 6 months based on age (p = 0.509), gender (p = 0.074), ethnicity (p = 0.531), or type of surgery (p = 0.087). Further, a univariate logistic regression revealed that preoperative opioid dose (OME) was significantly predictive of opioid use at 6 months (OR = 1.07, p < 0.001). A plot of opioid dose (OME) at day of surgery against the predicted probability of opioid use at 6 months shows that the probability of opioid use at 6 months increases as OME increases, with a pre-surgical OME of 60 or greater being associated with an 80% or greater predicted probability of opioid use at 6 months (Figure 1).
Table 2.
Preoperative phenotypic differences between patients reporting persistent opioid use (6-months postoperatively) and those that did not
| Opioid use at 6 months | ||||
|---|---|---|---|---|
|
| ||||
| Day of surgery characteristics | No (N = 386) |
Yes (N = 70) |
p value | |
|
|
||||
| Age | 63.48 (10.42) | 62.57 (11.27) | 0.509 | |
| Male | 48.70% | 37.10% | 0.074 | |
| Caucasian | 95.90% | 94.20% | 0.531 | |
| Knee surgery | 40.50% | 51.30% | 0.087 | |
| WOMAC Pain (range = 3–20) | 10.27 (3.25) | 12.17 (3.67) | < 0.001 | |
| WOMAC Functioning (range = 8–61) | 35.24 (10.24) | 39.9 (12.5) | 0.002 | |
| WOMAC Stiffness (range = 0–8) | 4.45 (1.76) | 5.27 (1.76) | 0.001 | |
| WOMAC Total (range = 16–89) | 49.96 (13.97) | 57.22 (16.93) | < 0.001 | |
| BPI Overall Pain Severity (range = 0–10) | 4.32 (1.9) | 5.43 (1.99) | < 0.001 | |
| HADS Depression (range = 0–17) | 4.3 (3.08) | 5.49 (3.91) | 0.006 | |
| HADS Anxiety (range = 0–20) | 5.14 (3.5) | 6.03 (4.17) | 0.064 | |
| CSQ Catastrophizing (range = 0–36) | 4.01 (4.99) | 6.81 (8.42) | 0.001 | |
Note. WOMAC = Western Ontario and McMaster Universities Osteoarthritis Index; BPI = Brief Pain Inventory; HADS = Hospital and Anxiety and Depression Scale; CSQ = Coping Strategies Questionnaire-Catastrophizing subscale. Chi-square tests were conducted for categorical variables and independent sample t-tests were conducted for continuous variables. Mean and standard deviation were reported for continuous variables.
Figure 1.
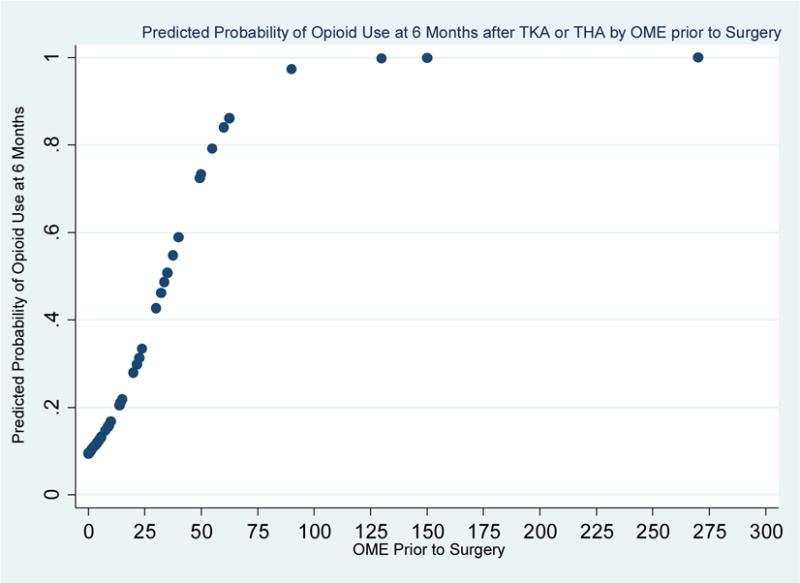
Plot of predicted probability of opioid use at 6 months from daily opioid dose (OME) values prior to surgery.
A logistic regression model predicting opioid use from daily opioid dose in oral morphine equivalent (OME) values prior to surgery was conducted. A 1-unit increase in OME is associated with a 7% increased odds of being on opioids at 6 months. This plot shows the increase in predicted probabilities of opioid use at 6 months by pre-surgical OME. OME values of 50 or greater are associated with predicted probabilities of 60% or greater of being on opioids at 6 months. OME values of 60 or greater are associated with predicted probabilities of 80% or greater of being on opioids at 6 months.
As a secondary analysis, we examined univariate baseline predictors of 6-month opioid use for those on opioids on day of surgery and opioid naïve patients separately (see Table 3). For those on opioids on day of surgery, knee surgery (p = 0.045) and higher preoperative opioid dose (OME, p = 0.010) were predictive of 6-month opioid use. For opioid naïve patients, on day of surgery having greater overall body pain (p = 0.002), greater joint pain (knee/hip) (p = 0.034), and greater catastrophizing (p = 0.010) were predictive of 6-month opioid use.
Table 3.
Day of surgery phenotypic differences between those on opioids at month 6 and those not broken down by opioid use day of surgery
| On opioids at Day of Surgery | Opioid Use at 6 months | |||
|---|---|---|---|---|
|
| ||||
| Day of surgery characteristics | No (N = 70) |
Yes (N = 50) |
p value | |
|
|
||||
| Age | 60.53(10.54) | 60.64(11.4) | 0.956 | |
| Male | 45.70% | 30.00% | 0.082 | |
| Caucasian | 92.90% | 92.00% | 0.860 | |
| Knee surgery | 30.00% | 48.00% | 0.045 | |
| WOMAC Pain (range = 3–20) | 11.84(2.84) | 12.4(3.54) | 0.353 | |
| WOMAC Functioning (range = 8–61) | 40.55(8.92) | 41.14(12.31) | 0.773 | |
| WOMAC Stiffness (range = 0–8) | 4.97(1.57) | 5.36(1.85) | 0.238 | |
| WOMAC Total (range = 17–89) | 57.53(12.13) | 58.76(16.67) | 0.658 | |
| BPI Overall Pain Severity (range = 1.5–10) | 5.48(1.68) | 5.43(1.85) | 0.877 | |
| HADS Depression (range = 0–15) | 5.67(3.01) | 5.7(3.74) | 0.956 | |
| HADS Anxiety (range = 0–17) | 5.58(3.33) | 6.28(4.07) | 0.318 | |
| CSQ Catastrophizing (range = 0–19) | 5.65(4.78) | 6.56(7.45) | 0.456 | |
| Preoperative opioid dose (OME range 0.03 – 270) | 11.84 (18.93) | 20 (35) | 0.010 | |
| Not on Opioids at Day of Surgery | Opioid Use at 6 months | |||
|---|---|---|---|---|
|
| ||||
| Day of surgery characteristics | No (N = 316) |
Yes (N = 20) |
p value | |
|
|
||||
| Age | 64.13(10.32) | 67.4(9.56) | 0.169 | |
| Male | 49.40% | 55.00% | 0.625 | |
| Caucasian | 96.50% | 100.00% | 0.408 | |
| Knee surgery | 42.70% | 60.00% | 0.131 | |
| WOMAC Pain (range = 4–19) | 9.91(3.24) | 11.61(4.03) | 0.034 | |
| WOMAC Functioning (range = 8–61) | 34(10.15) | 36.94(12.79) | 0.242 | |
| WOMAC Stiffness (range = 0–8) | 4.33(1.79) | 5.06(1.55) | 0.092 | |
| WOMAC Total (range = 16–88) | 48.22(13.8) | 53.61(17.44) | 0.115 | |
| BPI Overall Pain Severity (range = 0–10) | 4.06(1.85) | 5.42(2.34) | 0.002 | |
| HADS Depression (range = 0–17) | 4(3.02) | 5(4.33) | 0.167 | |
| HADS Anxiety (range = 0–20) | 5.04(3.54) | 5.45(4.43) | 0.622 | |
| CSQ Catastrophizing (range = 0–36) | 3.65(4.97) | 7.62(11.27) | 0.010 | |
Note. WOMAC = Western Ontario and McMaster Universities Osteoarthritis Index; BPI = Brief Pain Inventory; HADS = Hospital and Anxiety and Depression Scale; CSQ = Coping Strategies Questionnaire-Catastrophizing subscale; OME = oral morphine equivalency. Chi-square tests were conducted for categorical variables and independent sample t-tests were conducted for continuous variables. Mean and standard deviation were reported for continuous variables.
3.4 Change in knee/hip pain from baseline to 6 months as a predictor of opioid use at 6 months
A multivariate logistic regression model was conducted predicting opioid use at 6 months from change in knee/hip pain and overall body pain from baseline to 6 months (Table 4). Baseline pain scores, age, race, gender, opioid use at baseline, and type of surgery were included as covariates in the model. Overall body pain at baseline (Adjusted Odds Ratio (aOR) = 1.71, p < 0.001) and opioid use at baseline (aOR = 9.27, p < 0.001) were predictive of opioid use at 6 months. Further, decreased overall body pain was associated with lower odds of being on opioids at 6 months (aOR = 0.68, p < 0.001), while contrary to our hypothesis change in joint pain (knee/hip) was not predictive of opioid use at 6 months (aOR = 1.01, p = 0.900).
Table 4.
Changes in pain from baseline to 6 months as predictors of opioid use at 6 months for whole sample of opioid users and opioid naïve on day of surgery.
| Odds Ratio | Relative Risk | Standard Error | AUC | p-value | 95% | CI | |
|---|---|---|---|---|---|---|---|
| Change in overall body pain (BPI) | 0.68 | 0.72 | 0.07 | 0.44 | < 0.001 | 0.56 | 0.83 |
| Change in surgical site pain (WOMAC) | 1.01 | 1.01 | 0.05 | 0.50 | 0.900 | 0.91 | 1.12 |
| Preoperative pain overall (BPI) | 1.71 | 1.53 | 0.26 | 0.58 | < 0.001 | 1.27 | 2.30 |
| Preoperative surgical site pain (WOMAC) | 0.98 | 0.98 | 0.08 | 0.50 | 0.819 | 0.84 | 1.15 |
| Opioid use preoperatively | 9.27 | 3.90 | 3.33 | 0.81 | < 0.001 | 4.59 | 18.74 |
| Caucasian | 1.84 | 1.61 | 1.32 | 0.59 | 0.392 | 0.45 | 7.48 |
| Age | 1.00 | 1.00 | 0.02 | 0.50 | 0.864 | 0.97 | 1.04 |
| Female | 0.97 | 0.98 | 0.34 | 0.50 | 0.937 | 0.49 | 1.91 |
| Knee surgery (vs Hip surgery) | 1.86 | 1.63 | 0.68 | 0.60 | 0.087 | 0.91 | 3.80 |
Note. Overall model AUC = 0.864. AUC for each predictor is included as a measure of effect size. BPI = Brief Pain Inventory; WOMAC = Western Ontario and McMaster Universities Osteoarthritis Index. Change in overall body pain calculated by subtracting mean BPI Overall Body Pain score at 6 months from mean BPI Overall Body Pain score at day of surgery. Thus, positive values indicate decreases in overall body pain. Change in surgical site pain calculated by subtracting mean WOMAC Pain score at 6 months from WOMAC Pain score at day of surgery. Positive scores indicate decreases in surgical site pain from baseline to 6 months.
As a secondary analysis, separate multivariate logistic regression models were conducted for opioid naïve patients and those on opioids on day of surgery (Table 5). For those not on opioids at day of surgery, higher preoperative overall body pain (aOR = 2.76, p < 0.001) and knee arthroplasty (vs. THA; aOR = 3.89, p = 0.044) were predictive of opioid use at 6 months. Further, decreased overall body pain from baseline to 6 months (aOR = 0.72, p = 0.050) was associated with lower odds of being on opioids at 6 months, while change in joint pain (knee/hip) was not predictive of opioid use at 6 months (aOR = 0.99, p = 0.939). For those on opioids preoperatively, only decreases in overall body pain was associated with lower odds of being on opioids at 6 months (aOR = 0.62, p = 0.001). Change in affected joint pain was again not predictive (aOR= 1.00, p = 0.963).
Table 5.
Changes in pain from baseline to 6 months as predictors of opioid use at 6 months for opioid users and opioid naïve on day of surgery separately.
| On opioids day of surgery | Odds Ratio | Relative Risk | Standard Error | AUC | p-value | 95% | CI |
|---|---|---|---|---|---|---|---|
| Change in overall body pain (BPI) | 0.62 | 0.78 | 0.09 | 0.43 | 0.001 | 0.46 | 0.82 |
| Change in surgical site pain (WOMAC) | 1.00 | 1.01 | 0.07 | 0.50 | 0.963 | 0.88 | 1.14 |
| Preoperative overall pain (BPI) | 1.24 | 1.11 | 0.24 | 0.53 | 0.269 | 0.85 | 1.82 |
| Preoperative overall pain (WOMAC) | 1.09 | 1.04 | 0.11 | 0.51 | 0.418 | 0.89 | 1.33 |
| Caucasian | 0.95 | 0.90 | 0.76 | 0.49 | 0.950 | 0.20 | 4.54 |
| Age | 0.97 | 0.99 | 0.02 | 0.50 | 0.203 | 0.93 | 1.02 |
| Female | 1.67 | 1.30 | 0.77 | 0.58 | 0.265 | 0.68 | 4.13 |
| Knee surgery (vs. Hip surgery) | 1.23 | 1.09 | 0.59 | 0.53 | 0.669 | 0.48 | 3.12 |
| Not on opioids day of surgery | Odds Ratio | Relative Risk | Standard Error | AUC | p-value | 95% | CI |
|---|---|---|---|---|---|---|---|
| Change in overall body pain (BPI) | 0.72 | 0.78 | 0.12 | 0.45 | 0.050 | 0.52 | 1.00 |
| Change in surgical site pain (WOMAC) | 0.99 | 0.99 | 0.11 | 0.50 | 0.939 | 0.80 | 1.23 |
| Preoperative overall pain (BPI) | 2.76 | 2.31 | 0.74 | 0.65 | <0.001 | 1.64 | 4.65 |
| Preoperative overall pain (WOMAC) | 0.89 | 0.92 | 0.14 | 0.48 | 0.459 | 0.65 | 1.21 |
| Caucasiana | – | – | – | – | – | – | |
| Age | 1.06 | 1.05 | 0.04 | 0.51 | 0.096 | 0.99 | 1.13 |
| Female | 0.37 | 0.42 | 0.22 | 0.35 | 0.091 | 0.11 | 1.18 |
| Knee surgery (vs. Hip surgery) | 3.89 | 3.36 | 2.62 | 0.70 | 0.044 | 1.04 | 14.6 |
Note. Overall model AUC for people on opioids day of surgery = 0.75. Overall model AUC for people not on opioids day of surgery = 0.853. AUC for each predictor is included as a measure of effect size. BPI = Brief Pain Inventory; WOMAC = Western Ontario and McMaster Universities Osteoarthritis Index. Change in overall body pain calculated by subtracting mean BPI Overall Body Pain score at 6 months from mean BPI Overall Body Pain score at day of surgery. Thus, positive values indicate decreases in overall body pain. Change in surgical site pain calculated by subtracting mean WOMAC Pain score at 6 months from WOMAC Pain score at day of surgery. Positive scores indicate decreases in surgical site pain from baseline to 6 months.
All participants were Caucasian in this sample so this variable was excluded from the model.
4. Discussion
To our knowledge, this is the first study to examine predictors of opioid use in patients taking opioids preoperatively and opioid naïve patients, and to include changes in joint pain (knee/hip) and overall pain as predictors of persistent opioid use. We would expect that after a successful surgical intervention, opioid use should no longer be necessary as the pain in the joint improves. However, the current data emphasize that the relationship between persistent opioid use following arthroplasty is far more complex than improvement in pain in the affected joint.
4.1 Patterns of opioid cessation following TKA and THA differ between patients taking opioids preoperatively and opioid naïve patients
These data highlight the importance of understanding the natural trajectory of opioid use following TKA or THA, especially taking into account how cessation rates differ depending on opioid use the day of surgery. Overall, patients showed a trend towards opioid cessation. Despite this, patients taking opioids preoperatively were far more likely to report persistent opioid use at 6 months (53.3% TKA, 34.7% THA) than were opioid naïve patients (8.2% TKA, 4.3% THA). While it was not unexpected that preoperative opioid use was associated with persistent use at 6 months, the rates of opioid use following arthroplasty are higher than those previously reported. A similar study in TKA patients found that14% of patients already taking opioids prior to TKA reported continued opioid use at 12 months [7]. One possible explanation for the lower cessation rates is that the assessment period post arthroplasty differed (6 months versus 12 months). However, there is no evidence of meaningful change in pain beyond the 6-month postoperative time point. This study also showed that a percentage of opioid naïve patients started on opioid post-operatively to manage acute pain will continue to use opioids well after the surgical recovery period. On one hand, 4.3%—8.2% is a relatively small percentage, suggesting that prescribing opioids for acute pain following arthroplasty in opioid naïve patients does not pose a significant risk for long-term opioid use. On the other hand, a total of 3.48 million TKAs and almost 600,000 THAs are projected by 2030 [14], thereby potentially leading to more than 250,000 new chronic opioid users in the US each year.
4.2 Preoperative characteristics associated with persistent opioid use at 6 months were worse pain and functioning, symptoms of depression, greater catastrophizing, and higher preoperative opioid dose
Preoperative factors associated with persistent opioid use at 6 months included worse pain in the surgery site (joint pain), greater functional impairment, more stiffness, overall body pain, and symptoms of depression and catastrophizing. Importantly, our data suggest that for patients taking opioids preoperatively, an average daily dose of greater than 60 mg OME was independently associated with persistent opioid use (Figure 1). That is, patients on high dose opioids had an 80% or greater predicted probability of being on opioids at 6 months. One possibility is that higher doses of opioids make opioid cessation especially challenging, regardless of the outcome of a surgical procedure. For instance, these patients may be more likely to struggle with therapeutic opioid dependence or opioid induced hyperalgesia making it difficult to discontinue opioids even after improvement in joint pain. High dose opioids pose significant risks, including morbidity and mortality [2]; therefore, future studies should consider the factors that influence opioid use in patients taking high doses the day of surgery.
4.3 Changes in joint pain did not predict opioid use at 6 months
Counter to our hypotheses and previous studies [7], we found no association between change in joint pain (knee/hip) and persistent opioid use (Tables 4 and 5). Previous studies have used persistent opioid use as a surrogate for failed surgery, thereby assuming that the reason for persistent use was inadequate relief of joint pain. The results from the current study question this interpretation and suggest that persistent opioid use following arthroplasty may not be a reliable proxy for poor surgical outcomes. There are several hypotheses to consider as to why patients continue opioids despite improvement in their joint pain. One possibility is that opioids are being used to treat other pain. That is, perhaps patients were taking opioids the day of surgery not only for pain in their knee or hip but also for secondary pain. Similarly, opioid naïve patients who reported opioid use at 6 months may have developed new pain following arthroplasty and continued to medicate the new pain with opioids. In partial support of this, we found that decreases in overall body pain from baseline to 6 months most strongly predicted persistent opioid cessation. Another possibility is that persistent opioid users, especially those on high doses, are either dependent or self-medicating for affective distress, making opioid cessation unlikely regardless of the surgical outcome. Differentiating the reasons why people take opioids is a critical next step towards understanding why opioid use persists following a successful surgery.
4.4 Participants’ already taking opioids the day of surgery have a worse phenotypic profile compared to opioid naïve patients
Opioid use on the day of surgery was associated with a worse clinical profile, including higher pain, worse functioning, and more symptoms of affective distress. Although not central to our main hypotheses, these results add to the growing literature that continues to find phenotypic difference between patients who report opioid use and opioid naïve patients [6]. For example, in a study of patients presenting to a chronic pain clinic, current opioid use was associated with higher pain severity, lower levels of functioning and significant affective distress [9].
4.5 Clinical implications
Pain management following TKA and THA is complex. In order to provide optimal short and long-term pain management, it is critical for physicians to understand and discuss patients’ pre-surgical and postsurgical opioid use. This study identified several pre-surgical factors that are “red-flags” for persistent opioid use 6-months post arthroplasty, including high dose opioid use prior to surgery and greater overall body pain. Pre-surgical interventions should include a better assessment of comorbid pain conditions and patients on high dose opioids may have better outcomes if they are tapered to a lower dose. Among patients who were opioid naïve the day of surgery, opioid use at 3 months was associated with a 56 (TKA) and 12 (THA) times greater risk of persistent opioids use at 6 months. These data support developing better monitoring of opioid use prior to 3 months to consider points of possible intervention. Though it is impractical for orthopedic surgeons and primary care physicians to track and counsel all patients about opioid use after arthroplasty, assessing opioid use at multiple time points may help guide physicians as to when someone is falling outside of the expected postoperative opioid use.
4.5 Strengths and limitations
Strengths of this study include the rich preoperative phenotyping battery that allowed us to assess opioid use and dose, site-specific pain and functioning, overall pain, and symptoms of depression and anxiety, in addition to demographic characteristics. This approach expands on previous research in this area that did not include preoperative opioid use [19; 20] or differentiate pain in the surgical site from overall body pain [7]. Another strength was the longitudinal design and the inclusion of multiple time points. Previous studies were limited to preoperative data and postoperative outcomes 2 and 5 years post arthroplasty [19; 20]. The current study also benefited from direct verification of opioid use and dose with the patient. There are several limitations to note. First, we did not assess the specific pain condition for which opioids were being used in the patients already prescribed opioids prior to surgery and at follow up assessments. Although we are not aware of any studies that have assessed this, our results suggest that understanding why patients are using their opioids prior to a surgery is important. Additionally, we did not assess affect at the 1- and 3-month postoperative time points which limits our ability to understand how change in affect impacts opioid cessation. Lastly, these data originated from a tertiary care pain clinic in the Midwest, so these results may not be generalizable to other patient settings.
4.6 Conclusions and future directions
Many patients who already take opioids before undergoing a TKA or THA will persist in their opioid use following surgery. Moreover, a portion of opioid naïve patients will become chronic opioid users after arthroplasty, which has implications well beyond the postoperative recovery period. Importantly, we did not find an association between persistent opioid use and persistent pain in the knee/hip suggesting other factors likely influence long-term opioid use following a successful surgical intervention. We hypothesize that the reasons patients continue to use opioids may be due to pain in other areas, self-medicating affective distress and therapeutic opioid dependence. In order to identify those at higher risk for persistent use, well-designed prospective studies that assess reasons for opioid use are needed in order to enhance pre and postoperative pain management. A long-term goal includes the development of interventions to aid physicians and patients with opioid cessation following surgical interventions such as TKA and THA.
Supplementary Material
Acknowledgments
The study was funded by R01AR060392 (Co-PI Brummett and Clauw) from the National Institute of Arthritis and Musculoskeletal and Skin Diseases (National Institutes of Health, Bethesda, MD).
Drs. Goesling, Moser and Brummett had full access to all of the data in the study and take responsibility for the integrity of the data and the accuracy of the data analysis. Dr. Moser conducted and is responsible for the data analysis.
The authors thank the physicians, nurses and staff of the University of Michigan Health System and the Back and Pain Center (Department of Anesthesiology) for their assistance in this study.
Footnotes
Disclosures: Dr. Brummett receives research funding from Neuros Medical Inc. (Willoughby Hills, Ohio). Dr. Clauw is a consultant for Pfizer, Inc. (New York, New York, USA); Johnson and Johnson (New Brunswick, New Jersey, USA); Forest Pharmaceuticals (New York, New York, USA); Merck (Whitehouse Station, New Jersey, USA); Nuvo Research, Inc. (Mississauga, Ontario, Canada); Eli Lilly, Inc. (Indianapolis, Indiana, USA); Grunenthal Pharma Ltd. (Dublin, Ireland); Jazz Pharmaceuticals, Inc. (Palo Alto, California, USA). Dr. Clauw also receives research funding from Merck Pharmaceuticals, Cerephex, and Forest Pharmaceuticals. Dr. Hassett has received research funding from Bristol-Myers (Princeton, New Jersey, USA) and is a consultant for Lexicon Pharmaceuticals (The Woodlands, Texas, USA). There are otherwise no relevant disclosures.
References
- 1.Bellamy N. WOMAC Osteoarthritis Index User Guide. Version V. 2002 Book WOMAC Osteoarthritis Index User Guide. Version V. City. [Google Scholar]
- 2.Bohnert AS, Valenstein M, Bair MJ, Ganoczy D, McCarthy JF, Ilgen MA, Blow FC. Association between opioid prescribing patterns and opioid overdose-related deaths. Jama. 2011;305(13):1315–1321. doi: 10.1001/jama.2011.370. [DOI] [PubMed] [Google Scholar]
- 3.Brummett CM, Urquhart AG, Hassett AL, Tsodikov A, Hallstrom BR, Wood NI, Williams DA, Clauw DJ. Characteristics of Fibromyalgia Independently Predict Poorer Long-Term Analgesic Outcomes Following Total Knee and Hip Arthroplasty. Arthritis Rheumatol. 2015;67(5):1386–1394. doi: 10.1002/art.39051. [DOI] [PMC free article] [PubMed] [Google Scholar]
- 4.Chou R, Fanciullo GJ, Fine PG, Adler JA, Ballantyne JC, Davies P, Donovan MI, Fishbain DA, Foley KM, Fudin J, Gilson AM, Kelter A, Mauskop A, O’Connor PG, Passik SD, Pasternak GW, Portenoy RK, Rich BA, Roberts RG, Todd KH, Miaskowski C, O APSAAPM Clinical Guidelines for the Use of Chronic Opioid Therapy in Chronic Noncancer Pain. J Pain. 2009;10(2):113–130. doi: 10.1016/j.jpain.2008.10.008. [DOI] [PMC free article] [PubMed] [Google Scholar]
- 5.Cleeland CS, Ryan KM. Pain assessment: global use of the Brief Pain Inventory. Ann Acad Med Singapore. 1994;23(2):129–138. [PubMed] [Google Scholar]
- 6.Eriksen J, Sjogren P, Bruera E, Ekholm O, Rasmussen NK. Critical issues on opioids in chronic non-cancer pain: An epidemiological study. Pain. 2006;125(1–2):172–179. doi: 10.1016/j.pain.2006.06.009. [DOI] [PubMed] [Google Scholar]
- 7.Franklin PD, Karbassi JA, Li WJ, Yang WY, Ayers DC. Reduction in Narcotic Use After Primary Total Knee Arthroplasty and Association with Patient Pain Relief and Satisfaction. Journal of Arthroplasty. 2010;25(6):12–16. doi: 10.1016/j.arth.2010.05.003. [DOI] [PubMed] [Google Scholar]
- 8.Furlan AD, Sandoval JA, Mailis-Gagnon A, Tunks E. Opioids for chronic noncancer pain: a meta-analysis of effectiveness and side effects. CMAJ. 2006;174(11):1589–1594. doi: 10.1503/cmaj.051528. [DOI] [PMC free article] [PubMed] [Google Scholar]
- 9.Goesling J, Henry MJ, Moser SE, Rastogi M, Hassett AL, Clauw DJ, Brummett CM. Symptoms of Depression Are Associated With Opioid Use Regardless of Pain Severity and Physical Functioning Among Treatment-Seeking Patients With Chronic Pain. J Pain. 2015;16(9):844–851. doi: 10.1016/j.jpain.2015.05.010. [DOI] [PubMed] [Google Scholar]
- 10.Goldberg VM, Buckwalter J, Halpin M, Jiranek W, Mihalko W, Pinzur M, Rohan B, Vail T, Walker P, Windsor R, Wright T. Recommendations of the OARSI FDA Osteoarthritis Devices Working Group. Osteoarthr Cartilage. 2011;19(5):509–514. doi: 10.1016/j.joca.2011.02.017. [DOI] [PubMed] [Google Scholar]
- 11.Hochberg MC, Altman RD, April KT, Benkhalti M, Guyatt G, McGowan J, Towheed T, Welch V, Wells G, Tugwell P, American College of R American College of Rheumatology 2012 recommendations for the use of nonpharmacologic and pharmacologic therapies in osteoarthritis of the hand, hip, and knee. Arthritis care & research. 2012;64(4):465–474. doi: 10.1002/acr.21596. [DOI] [PubMed] [Google Scholar]
- 12.Kurtz S, Mowat F, Ong K, Chan N, Lau E, Halpern M. Prevalence of primary and revision total hip and knee arthroplasty in the United States from 1990 through 2002. J Bone Joint Surg Am. 2005;87(7):1487–1497. doi: 10.2106/JBJS.D.02441. [DOI] [PubMed] [Google Scholar]
- 13.Kurtz S, Ong K, Lau E, Mowat F, Halpern M. Projections of primary and revision hip and knee arthroplasty in the United States from 2005 to 2030. J Bone Joint Surg Am. 2007;89A(4):780–785. doi: 10.2106/JBJS.F.00222. [DOI] [PubMed] [Google Scholar]
- 14.Kurtz S, Ong K, Lau E, Mowat F, Halpern M. Projections of primary and revision hip and knee arthroplasty in the United States from 2005 to 2030. J Bone Joint Surg Am. 2007;89(4):780–785. doi: 10.2106/JBJS.F.00222. [DOI] [PubMed] [Google Scholar]
- 15.Kurtz SM, Ong KL, Lau E, Widmer M, Maravic M, Gomez-Barrena E, de Pina Mde F, Manno V, Torre M, Walter WL, de Steiger R, Geesink RG, Peltola M, Roder C. International survey of primary and revision total knee replacement. International orthopaedics. 2011;35(12):1783–1789. doi: 10.1007/s00264-011-1235-5. [DOI] [PMC free article] [PubMed] [Google Scholar]
- 16.Martell BA, O’Connor PG, Kerns RD, Becker WC, Morales KH, Kosten TR, Fiellin DA. Systematic review: opioid treatment for chronic back pain: prevalence, efficacy, and association with addiction. Ann Intern Med. 2007;146(2):116–127. doi: 10.7326/0003-4819-146-2-200701160-00006. [DOI] [PubMed] [Google Scholar]
- 17.McAlindon TE, Bannuru RR, Sullivan MC, Arden NK, Berenbaum F, Bierma-Zeinstra SM, Hawker GA, Henrotin Y, Hunter DJ, Kawaguchi H, Kwoh K, Lohmander S, Rannou F, Roos EM, Underwood M. OARSI guidelines for the non-surgical management of knee osteoarthritis. Osteoarthritis and cartilage/OARS, Osteoarthritis Research Society. 2014;22(3):363–388. doi: 10.1016/j.joca.2014.01.003. [DOI] [PubMed] [Google Scholar]
- 18.Rosenstiel AK, Keefe FJ. The use of coping strategies in chronic low back pain patients: relationship to patient characteristics and current adjustment. Pain. 1983;17(1):33–44. doi: 10.1016/0304-3959(83)90125-2. [DOI] [PubMed] [Google Scholar]
- 19.Singh JA, Lewallen D. Predictors of pain and use of pain medications following primary Total Hip Arthroplasty (THA): 5,707 THAs at 2-years and 3,289 THAs at 5-years. Bmc Musculoskel Dis. 2010;11 doi: 10.1186/1471-2474-11-90. [DOI] [PMC free article] [PubMed] [Google Scholar]
- 20.Singh JA, Lewallen DG. Predictors of use of pain medications for persistent knee pain after primary Total Knee Arthroplasty: a cohort study using an institutional joint registry. Arthritis Res Ther. 2012;14(6):R248. doi: 10.1186/ar4091. [DOI] [PMC free article] [PubMed] [Google Scholar]
- 21.StataCorp. Stata Statistical Software: Release 13. College Station, TX: 2013. [Google Scholar]
- 22.Swartzman LC, Gwadry FG, Shapiro AP, Teasell RW. The Factor Structure of the Coping Strategies Questionnaire. Pain. 1994;57(3):311–316. doi: 10.1016/0304-3959(94)90006-X. [DOI] [PubMed] [Google Scholar]
- 23.Tan G, Jensen MP, Thornby JI, Shanti BF. Validation of the Brief Pain Inventory for chronic nonmalignant pain. J Pain. 2004;5(2):133–137. doi: 10.1016/j.jpain.2003.12.005. [DOI] [PubMed] [Google Scholar]
- 24.Zigmond AS, Snaith RP. The Hospital Anxiety and Depression Scale. Acta Psychiatr Scand. 1983;67:361–370. doi: 10.1111/j.1600-0447.1983.tb09716.x. [DOI] [PubMed] [Google Scholar]
Associated Data
This section collects any data citations, data availability statements, or supplementary materials included in this article.