

Supplemental digital content is available in the text.
Key Words: INTERNATIONAL PHYSICAL ACTIVITY QUESTIONNAIRE, LONG FORM, INTERNATIONAL, SOCIODEMOGRAPHIC FACTORS, MEASUREMENT, EXERCISE, SEDENTARY TIME
ABSTRACT
Purpose
Understanding factors that influence accurate assessment of physical activity (PA) and sedentary behavior (SB) is important to measurement development, epidemiologic studies, and interventions. This study examined agreement between self-reported (International Physical Activity Questionnaire—Long Form [IPAQ-LF]) and accelerometry-based estimates of PA and SB across six countries and identified correlates of between-method agreement.
Methods
Self-report and objective (accelerometry-based) PA and SB data were collected in 2002–2011 from 3865 adult participants in eight cities from six countries (Belgium, Czech Republic, Denmark, Spain, United Kingdom, and United States). Between-method relative agreement (correlation) and absolute disagreement (mean difference between conceptually and intensity-matched IPAQ-LF and accelerometry-based PA and SB variables) were estimated. Also, sociodemographic characteristics and PA patterns were examined as correlates of between-method agreement.
Results
Observed relative agreement (relationships of IPAQ-LF with accelerometry-based PA and SB variables) was small to moderate (r = 0.05–0.37) and was moderated by sociodemographic (age, sex, weight status, and education) and behavioral (PA-type) factors. The absolute disagreement was large, with participants self-reporting higher PA intensity and total time in moderate-to-vigorous-intensity PA than accelerometry. Also, self-reported sitting time was lower than accelerometry-based sedentary behavior. After adjusting for sociodemographic and behavioral factors, the absolute disagreement between pairs of IPAQ-LF and accelerometry-based PA variables remained significantly different across cities/countries.
Conclusions
Present findings suggest systematic cultural and/or linguistic and sociodemographic differences in absolute agreement between the IPAQ-LF and the accelerometry-based PA and SB variables. These results have implications for the interpretation of international PA and SB data and correlate/determinant studies. They call for further efforts to improve such measures.
Prevalence data for physical activity (PA) and sedentary behavior (SB) are now available for dozens of countries based on self-report surveys (1,2,18). The validity and the between-country comparability of these data rely on survey items having the same meaning across cultures and languages and capturing relevant behaviors that are prevalent in specific populations (24). The International Physical Activity Questionnaire (IPAQ) was developed for international use and has evidence of reliability and validity (9). Although the IPAQ—Short Form has been most often used for international prevalence studies (1,2), the IPAQ—Long Form (IPAQ-LF) has also been used in international research, especially in research focused on domain-specific PA and studies of the environmental correlates of PA and SB (6,9). The main difference is that IPAQ-LF provides more detailed estimates of PA for each domain of leisure, transportation, occupation, and household activities. IPAQ-LF has been extensively validated against more reliable objective measures of PA and SB derived from accelerometers (motion sensors) (5,9,15,23). However, key questions remain about the sources of differences in agreement between accelerometry-derived and IPAQ-LF estimates of PA and SB (28,34). This knowledge is critical for a robust comparison and interpretation of differences in findings across populations and measurement methods (self-report vs accelerometry).
The first potential source of differences in agreement between accelerometry and IPAQ-LF (and any other self-report) pertains to the way PA and SB variables derived from accelerometers are computed. Accelerometry data are usually converted into time spent in SB and specific intensity levels of PA (light, moderate, and vigorous) using preestablished cut points (15) and compared with their self-report counterparts. Although IPAQ-LF is meant to gauge moderate-to-vigorous-intensity PA (MVPA; corresponding to ≥3 METs), better concordance of IPAQ-based total and moderate-intensity PA (MPA) with corresponding accelerometry-based variables has been observed when the latter also included light-intensity activities (<3 METs) as defined by the Freedson cut points (the cut points that have been used in the original multicountry validation study of the IPAQ) (5,9,12,23). This finding indicates that respondents might overestimate the intensity of their activities and/or that the accelerometer cut points for adults developed by Freedson et al. may not be appropriate for certain subgroups. Yet only one study has systematically examined this issue (5).
IPAQ-LF asks respondents to report activities undertaken for ≥10 min at a time (9). Although the respondents’ ability to accurately recall PA bout length has been questioned (39), only two studies have examined the agreement of IPAQ-LF estimates of PA with accelerometry-based PA accumulated throughout the monitoring period and PA accumulated through ≥10-min bouts (5,17). Identifying the accelerometry-based variables that yield the best agreement with the variables derived from IPAQ-LF administered in different countries would help to understand how participants self-report PA and identify PA profiles that accelerometers may underestimate. This information would help to establish the extent to which between-population differences in levels of PA/SB and their correlates are authentic phenomena or the results of measurement biases.
Studies have examined sociodemographic factors associated with the agreement between accelerometry- and IPAQ-based estimates of PA and SB. These include sex, age, education, weight status, and job status (3,13,22,33). The types of PA participants engage in may also moderate the level of agreement. For example, as accelerometry underestimates PA accrued through bicycling (19), it is plausible to assume that the level of agreement between self-reports and accelerometry will be lower for those who regularly engage in bicycling. Respondents who accrue most of their PA through leisure-time activities may display higher levels of agreement because leisure-time PA is usually planned, structured, at least of moderate intensity, and hence potentially easier to recall. By contrast, those who accrue most of their PA via occupational activities may be more likely to overestimate their PA (3). Given that occupational activities are generally less structured and more variable in intensity, respondents may have difficulties recalling the actual amount of MVPA during working hours and instead report the hours spent working (3,29,35).
Although IPAQ-LF has been validated against accelerometry in many countries, these validation studies typically used small samples (3,5,9,27,37) and/or examined only relative agreement (9,37) rather than both relative agreement (correlation) and absolute disagreement (absolute difference) between measures (3,5). Examining both is important because relative agreement does not capture systematic bias (i.e., overestimation or underestimation of self-reported PA and SB). Also, previous studies operationalized (i.e., scored) accelerometry-based PA in different ways and used sociodemographically diverse samples, making it difficult to compare findings. To determine the extent to which between-country differences in agreement between self-report and accelerometry PA/SB measures may be due to measurement and interpretational biases, analyses need to be adjusted for factors associated with agreement.
Using data from six countries, this study (1) examined the relative agreement and absolute disagreement between IPAQ-LF and accelerometry-based estimates of PA and SB, (2) identified sociodemographic (sex, age, educational attainment, and weight status) and PA-type moderators (percentages of total PA time spent in occupation, leisure, and bicycling for transport) of agreement between IPAQ-LF and accelerometry-based estimates of PA and SB, and (3) estimated between-city differences in levels of agreement after adjustment for significant sociodemographic and PA-type moderators. This information is essential for a robust comparison and interpretation of levels of PA and SB across countries.
METHODS
We used data collected in eight cities from six countries participating in the International Physical Activity and the Environment Network Adult study, an observational epidemiologic cross-sectional project (6,20). The cities included were Ghent (Belgium), Olomouc and Hradec Kralove (Czech Republic), Aarhus (Denmark), Pamplona (Spain), Stoke-on-Trent (United Kingdom), and Seattle and Baltimore regions (United States).
Participants and Procedures
Participants (18–65 yr) were recruited from neighborhoods stratified by walkability and socioeconomic status (20). Study dates ranged from 2002 to 2011. Each participating country obtained ethical approval from their institutional review boards, and all participants provided written informed consent before data collection. Participants were invited to complete the IPAQ-LF and wear accelerometers to objectively measure PA. Denmark, Spain, and the United Kingdom asked only a subset of participants (20%–50%) to wear accelerometers. Denmark, Spain, Czech Republic, and the United States used self-administered methods (mail and online surveys) to collect survey data. The United Kingdom used mailed surveys and computer-assisted telephone interviews, whereas Belgium used in-person interviews (20).
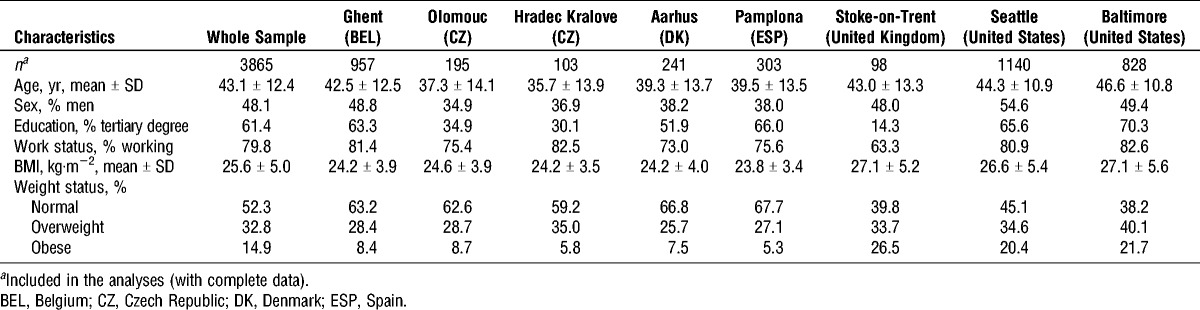
Of 6251 participants, 1787 did not wear an accelerometer because they did not consent or were not asked to wear it. When compared with participants who did not wear accelerometers, those who consented to wear it (n = 4464) were more likely to be older (P < 0.001), to live with a partner (P < 0.001), and to hold a tertiary degree (P < 0.001). Among those who consented to wear accelerometers, those with ≥4 d of valid accelerometer data (n = 4234) were more likely to be older (P < 0.001) and self-report fewer minutes of total PA than those without ≥4 d of valid accelerometer data (n = 230). Of 4234 participants with valid accelerometry data, 176 were excluded due to missing data on IPAQ-LF or covariates, and 193 participants were excluded as they reported more than 12 h·d−1 of total PA. Excluded participants were more likely to be employed (P < 0.001) and live in lower-income neighborhoods and were less likely to have a tertiary degree and to accumulate more of their total PA through leisure-time activities (P < 0.001). Participants with missing (n = 176) data were more likely to be older (P = 0.014) and employed (P = 0.024) than those with no missing data (n = 4058). They did not significantly differ in accelerometry-based estimates of PA and SB. The sociodemographic characteristics of the sample included in this study (n = 3865) are presented in Table 1.
TABLE 1.
Descriptive statistics: sociodemographics by city.
Measures
PA and SB
The International Physical Activity Questionnaire—Long Form (IPAQ-LF, last 7 d) prompts participants to report the frequency and duration of activities and sitting time in the last 7 d (9). Activities were classified into the domains of occupation, transportation, household, and leisure for each category of walking, MPA, and vigorous-intensity PA (VPA). Overall sitting time on a typical weekday and weekend day were also reported. Average daily hours of sitting (including motorized transportation) and weekly minutes of total PA, MPA plus walking, and VPA were computed.
PA was measured objectively with ActiGraph accelerometers (Pensacola, FL), which are widely used to objectively characterize intensity and duration of free living PA (16). The UK (Stoke-on-Trent) site used the GT1M, the Danish (Aarhus) site used the GT3X, and the Czech (Olomouc) and Spanish (Pamplona) sites used both the GT1M and the GT3X models. The US (Baltimore and Seattle) and Belgian (Ghent) sites used the older 7164/71256 models. Studies have consistently shown that the newer accelerometer models (GT1M and GT3X) produce comparable output (31), but findings are mixed when comparing the output of the older 7164/71256 models to the newer models (4).
Participants were asked to wear the accelerometer around their waist on a belt with the device oriented above the right hip for 7 d during waking hours when not engaged in water activities. Participants wore the accelerometers after completing the surveys in all cities, except for Baltimore and Seattle where they completed the survey after wearing the accelerometer.
Accelerometer data were either collected with or aggregated to 1-min epochs. Non–wear time was defined as more than 60 min of consecutive “0” activity counts. Days consisting of at least 10 wearing hours were coded as valid. Participants were included in the analyses if they had four or more valid wearing days. Accelerometer counts were converted to minute estimates of sedentary time and activity intensity, respectively, using the values established by Matthews et al. (25) and the adult cut points by Freedson et al. (15): 0–100 counts for sedentary time (1.0 METs), 101–1951 counts for light-intensity PA (1.1–2.9 METs), 1952–5724 for MPA (3.0–6.0 METs), and >5724 for VPA (>6.0 METs). Total daily minutes and daily minutes accumulated in ≥10-min bouts of each activity intensity (with an allowance for up to 2 min of values to fall outside the cut point threshold) were summed across valid wearing days, divided by the number of valid days, and multiplied by seven to estimate weekly minutes of cumulative activity and bouts in each intensity. These variables were then adjusted for accelerometer wear time via regression methods. The following wear time–adjusted variables were created: total weekly minutes and weekly minutes accumulated in ≥10-min bouts of MVPA, light-to-moderate-intensity PA (LMPA), light-to-vigorous-intensity PA (LVPA), VPA, and MPA. Also, we computed average daily hours of sedentary time.
Moderators of relationships and differences between IPAQ-LF and accelerometry-based PA and SB variables
In addition to the city of residence, the following sociodemographic characteristics were considered as moderators of relationships and differences in mean values between IPAQ-LF and accelerometry-based PA variables: age, sex, educational attainment (without vs with tertiary degree), and weight status based on BMI (kg·m−2). Height and weight were measured objectively in Stoke-on-Trent (United Kingdom) and self-reported elsewhere (10). Self-reported and objectively measured BMI are highly correlated, and BMI is a proxy measure for adiposity in large-scale studies (26). Data from IPAQ-LF were used to determine the percentages of total self-reported PA spent on leisure-time PA, transport-related bicycling, and occupational PA, which were examined as potential moderators.
Data Analyses
Descriptive statistics were computed for the entire sample included in the analyses and by city.
Relationships of IPAQ-LF with accelerometry-based PA and SB variables
Relationships of corresponding pairs of accelerometry-based and IPAQ-LF variables were estimated using a generalized additive mixed model (GAMM) (40). IPAQ-LF variables were regressed to corresponding accelerometry-based variables (Table 2), while adjusting for clustering at the administrative unit and city levels. The square root of the coefficient of determination was computed (hereafter, coefficient of correlation, r). As the coefficient of determination represents the proportion of shared variance, its square root is interpreted as a Pearson correlation coefficient typically used in validity studies of PA self-reports (34). The strength of relationships was determined using the Cohen cut points for correlation coefficients (r = 0.10–0.30, small; r = 0.31–0.50, moderate; r > 0.50, large) (8). To estimate curvilinear relationships, smooth terms (thin-plate splines) were used (40). Moderating effects of city, sociodemographic characteristics, and percentage time spent in specific PA domains were assessed by adding appropriate interaction terms to the previous GAMM (separate GAMM for each moderator). A difference of >5 units in Akaike information criterion values (similar to using a probability level of 10% for parametric tests of interaction effects) between the simpler versus the more complex GAMM was used as evidence of curvilinearity and/or interaction effects (6). The z-test was used to assess the significance of single interaction terms while adopting a two-tailed probability level of 0.05. Separate GAMM values were estimated for each stratum or predetermined value of a significant moderator to obtain stratum- or value-specific correlation coefficients.
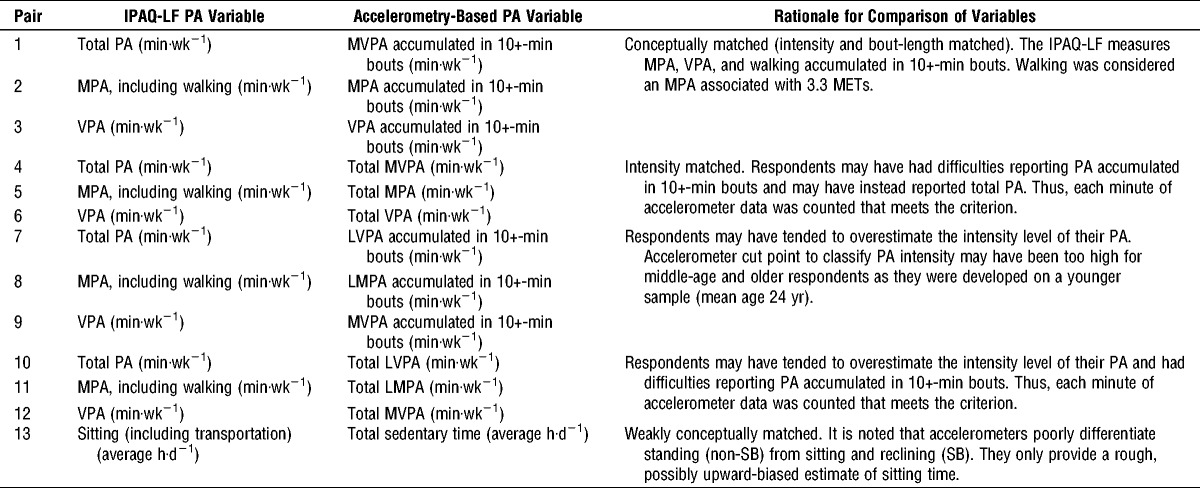
TABLE 2.
Pairs of IPAQ-LF and accelerometry-based PA and SB variables compared in this study and rationale.
Differences between IPAQ-LF with accelerometry-based PA and SB variables
Moderating effects of city, sociodemographic characteristics, and percentage of time spent in specific PA domains on computed differences between IPAQ-LF and accelerometry-based PA variables (Table 2) were examined using GAMM by regressing the difference scores onto the potential moderators. All analyses were conducted in R (30) using the packages “mgcv” (40) and “car” (14).
RESULTS
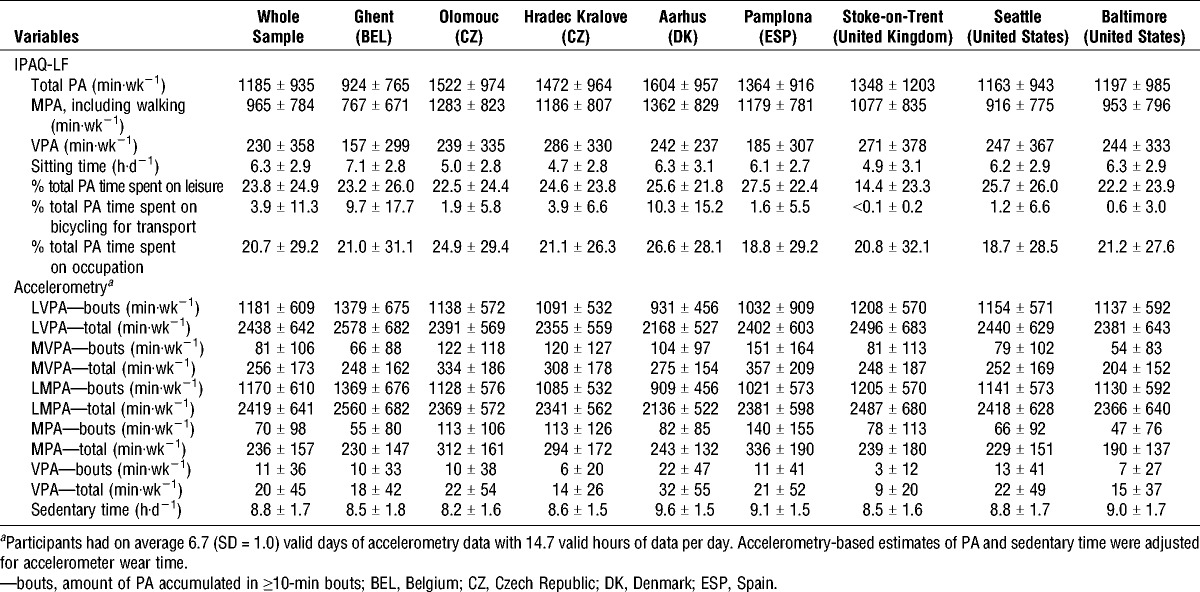
PA estimates based on IPAQ-LF were substantially higher than their conceptually matched accelerometry-based counterparts (Table 3). For example, the average total PA as estimated by the IPAQ-LF was 1185 min·wk−1, whereas according to accelerometry, participants accumulated 256 min·wk−1 (counting every MVPA minute) and only 81 min·wk−1 of MVPA in ≥10-min bouts. It seems that PA estimates based on IPAQ-LF were more variable across and within cities than those based on accelerometry (Table 3).
TABLE 3.
IPAQ-LF and accelerometry-based estimates of PA and SB (mean ± SD) by city.
Relationships of IPAQ-LF with accelerometry-based PA and SB variables (relative agreement)
Correlations between IPAQ-LF and accelerometry-based PA variables were small to moderate, ranging from 0.05 to 0.37 (Table 4). They were weaker for conceptually matched PA variables, followed by intensity-matched variables. Stronger relationships were observed for IPAQ-LF PA variables with accelerometry-based PA encompassing lower- plus matched-intensity levels (e.g., total PA based on IPAQ-LF and total accelerometry-based LVPA, including LVPA minutes; pairs 7–8 and 10–11 in Table 2). The strongest relationship (0.37) was observed between sitting time as measured by IPAQ-LF and accelerometry-based sedentary time. This relationship was curvilinear (see Figure, Supplemental Digital Content 1, Relationship between self-reported sitting time and accelerometry-based sedentary time, http://links.lww.com/MSS/A632), as was that between accelerometry-based total VPA and IPAQ-LF VPA (see Figure, Supplemental Digital Content 2, Relationship between self-reported and accelerometry-based vigorous-intensity PA, http://links.lww.com/MSS/A633).
TABLE 4.
Correlations (r) between IPAQ-LF and accelerometry-based estimates of PA and SB for the entire sample and significant moderator subgroups.
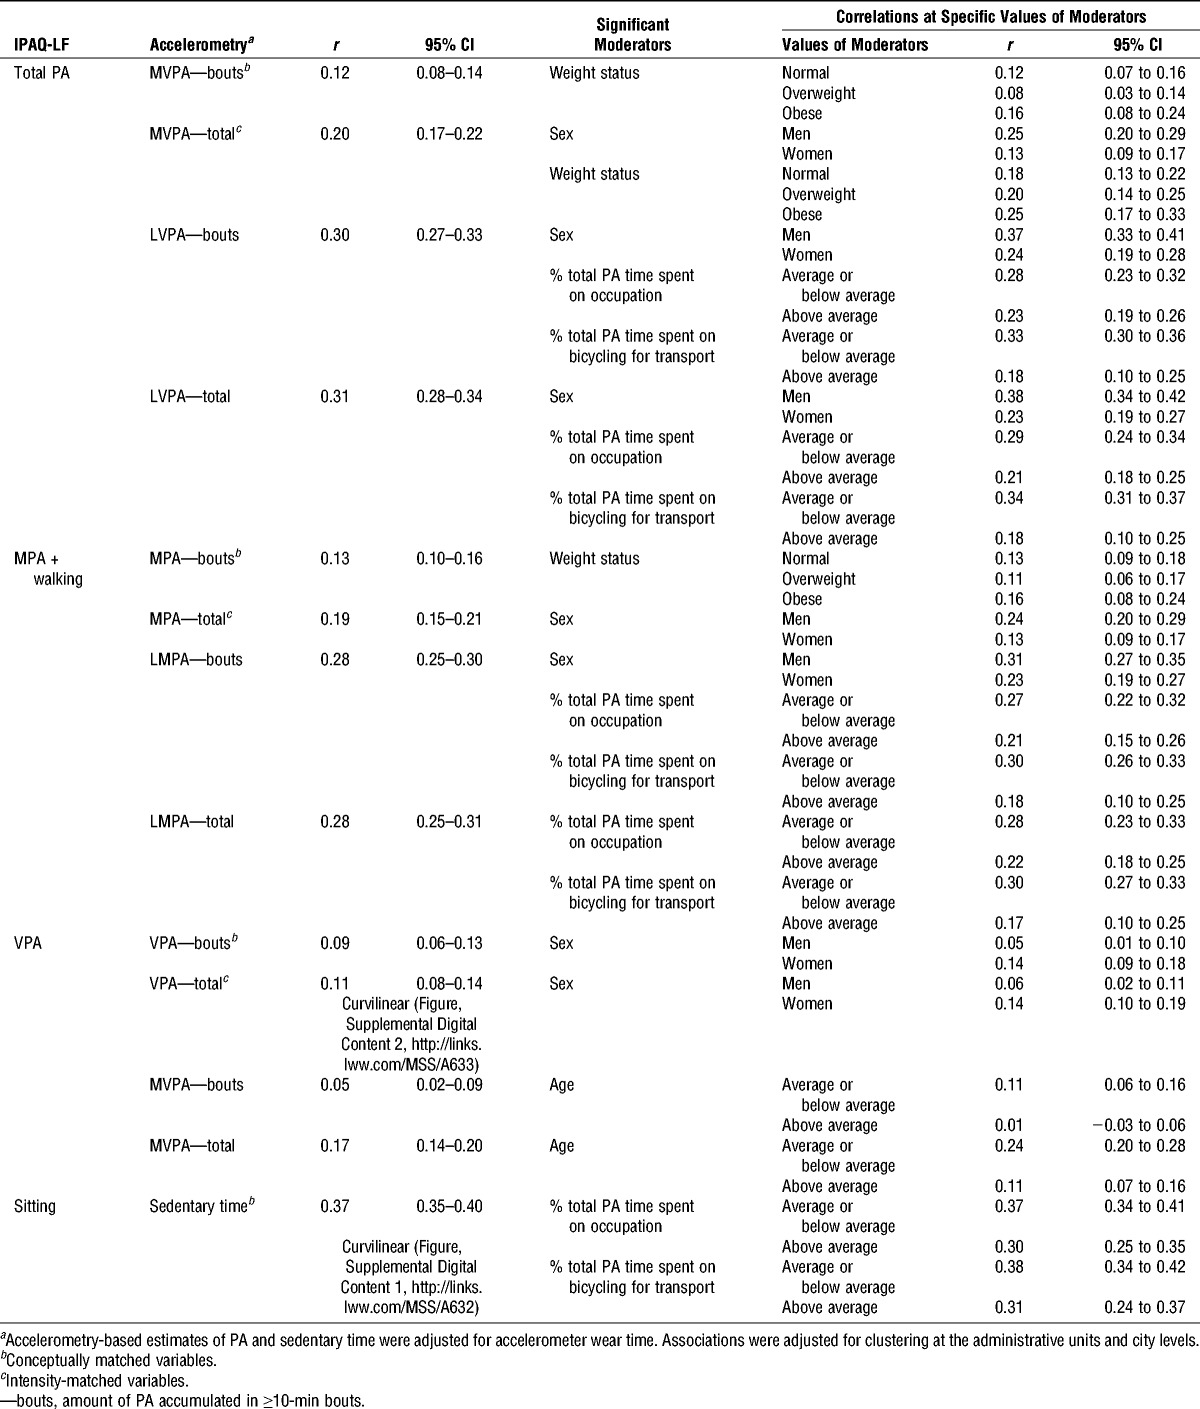
Weight status, age, sex, and percentages of total self-reported PA time spent on occupation and/or bicycling for transport moderated the strength of relationships between some pairs of IPAQ-LF and accelerometry-based estimates of PA (Table 4). Stronger relationships were observed in obese, younger participants, and those with smaller percentages of total PA time spent on occupation and bicycling for transport. Men had stronger correlations of accelerometry-based PA variables with total PA and MPA + walking from IPAQ-LF, whereas women showed stronger correlations with respect to self-reported VPA.
Differences (absolute disagreement) between IPAQ-LF with accelerometry-based PA and SB variables
The mean differences between conceptually and intensity-matched IPAQ-LF and accelerometry-based PA variables were large (Table 5 and Fig. 1; also see Table, Supplemental Digital Content 3, Correlates of differences in IPAQ-LF estimates of moderate-intensity physical activity plus walking, vigorous-intensity physical activity, sitting time and corresponding accelerometry-based estimates of physical activity and sedentary time, http://links.lww.com/MSS/A634). For example, participants’ self-reported total PA was higher by 1222 and 1040 min·wk−1 than the respective conceptually and intensity-matched accelerometry-based variables (Table 5). By contrast, the mean values of total PA and MPA + walking as measured by IPAQ-LF did not significantly differ from those of their accelerometry-based ≥10-min bout counterparts, including light-intensity PA. Also, total PA as measured by the IPAQ-LF did not differ from accelerometry-based ≥10-min bouts of LMPA in three English-speaking cities (Fig. 1). Total MVPA was the accelerometry-based variable with the highest level of agreement with IPAQ-LF VPA (45 min·wk−1 difference, see Table, Supplemental Digital Content 3, Correlates of differences in IPAQ-LF estimates of moderate-intensity physical activity plus walking, vigorous-intensity physical activity, sitting time and corresponding accelerometry-based estimates of physical activity and sedentary time, http://links.lww.com/MSS/A634; pair 12 in Table 2). Participants reported less than 3 h·d−1 of sitting as compared with accelerometry-based sedentary time (see Table, Supplemental Digital Content 3, Correlates of differences in IPAQ-LF estimates of moderate-intensity physical activity plus walking, vigorous-intensity physical activity, sitting time and corresponding accelerometry-based estimates of physical activity and sedentary time, http://links.lww.com/MSS/A634).
TABLE 5.
Correlates of differences (Δ) in IPAQ-LF estimates of total PA and four accelerometry-based estimates of PA.
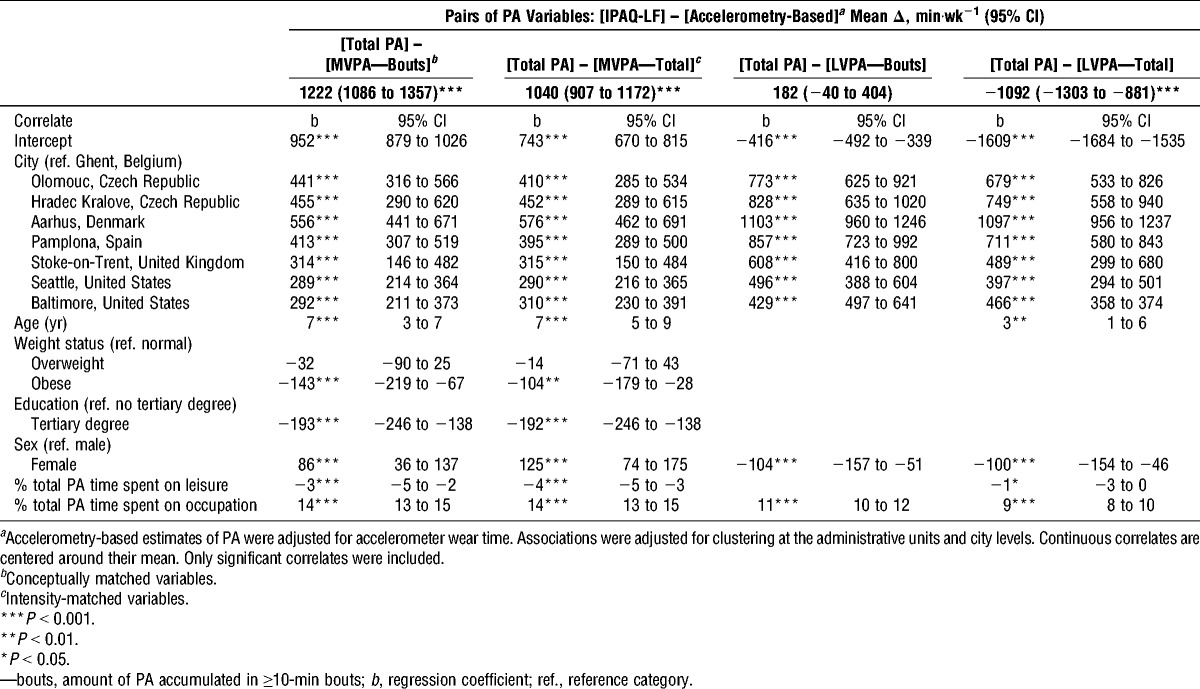
FIGURE 1.
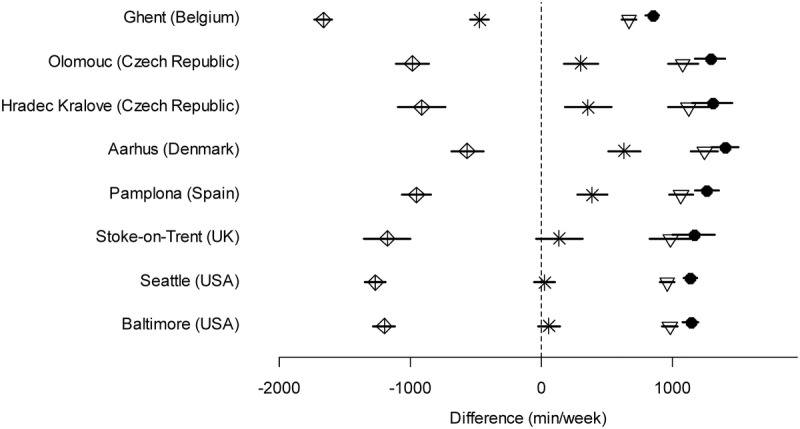
Differences between total PA as measured by IPAQ-LF and accelerometry-based estimates of PA adjusted for confounders. Solid lines are 95% confidence intervals. Total PA (IPAQ-LF) minus MVPA accumulated in ≥10-min bouts (accelerometry) (conceptually matched variables). Total PA (IPAQ-LF) minus MVPA—total (accelerometry) (intensity-matched variables). Total PA (IPAQ-LF) minus LVPA accumulated in ≥10-min bouts (accelerometry). Total PA (IPAQ-LF) minus LVPA—total (accelerometry).
The mean differences between pairs of IPAQ-LF and accelerometry-based PA variables varied by city, with Ghent (Belgium) consistently showing the smallest differences for conceptually and intensity-matched pairs of variables (Table 5 and Fig. 1; see Table, Supplemental Digital Content 3, Correlates of differences in IPAQ-LF estimates of moderate-intensity physical activity plus walking, vigorous-intensity physical activity, sitting time and corresponding accelerometry-based estimates of physical activity and sedentary time, http://links.lww.com/MSS/A634). The differences between IPAQ-LF and accelerometry-based conceptually and intensity-matched pairs of variables depended on a larger number of moderators than did those of other pairs of variables. Age, weight status, education, sex, and percentage of total PA time spent on leisure, occupation, and/or bicycling for transport were correlates of differences between IPAQ-LF and accelerometry-based estimates of PA (Table 5; see Table, Supplemental Digital Content 3, Correlates of differences in IPAQ-LF estimates of moderate-intensity physical activity plus walking, vigorous-intensity physical activity, sitting time and corresponding accelerometry-based estimates of physical activity and sedentary time, http://links.lww.com/MSS/A634).
DISCUSSION
This study examined factors determining the agreement between IPAQ-LF and accelerometry-based estimates of PA and SB in a multicountry sample of adults (n = 3865). Self-reported total sitting, followed by total PA, showed the highest levels of agreement with accelerometry-based variables as in previous studies (9,21). IPAQ-LF tended to show higher estimates of MVPA when compared with accelerometry and less sitting time than accelerometry-based estimates of SB. The level of agreement was markedly influenced by the way accelerometry data were operationalized. Better agreement was observed when accelerometry-based variables included either total or ≥10-min bout PA accrued at lower intensity levels (according to the cut points by Freedson et al. [15]) than accelerometer scoring that was nominally the same intensity range as IPAQ-LF. This pattern of findings was observed across all study sites and for all IPAQ-LF PA variables, suggesting a generalizable and robust principle similar as in some previous studies (5,12,23).
Total self-reported PA and MPA, including walking, showed a higher level of absolute agreement with accelerometry-based LVPA (Fig. 1) and LMPA accumulated in ≥10-min rather than ≥1-min bouts (see mean difference in Table 3). The opposite held true for self-reported VPA. Similar results were found in a validation study of the IPAQ-LF in older Chinese (5). Overall, respondents may be unable to provide valid estimates of PA intensity but may recall relatively accurately the time spent in sustained discrete bouts of activity. The fact that this was not the case for VPA may be due to the low prevalence of such intensity levels in the examined sample or to misclassification of VPA.
Although no significant differences in relative agreement (relationships) between IPAQ-LF and accelerometry-based estimates of PA and SB were observed across study sites, significant differences were observed in absolute disagreement (differences in mean values). Ghent (Belgium) had the highest level of agreement between conceptually and intensity-matched pairs of PA and SB estimates. This might be due to Ghent being the only site that administered the IPAQ-LF via in-person interviews, whereby interviewers assisted participants in giving realistic estimates of PA. Interviewer administration of self-report measures is known to minimize errors associated with the misinterpretation of items (38), and interviewer-administered versions of the IPAQ have been reported to yield more valid estimates of PA and SB than self-completed forms (21).
After adjustment for potential moderators, differences in absolute agreement were similar across sites with a common language and culture. Seattle (United States), Baltimore (United States), and Stoke-on-Trent (United Kingdom) showed similar average absolute differences between self-report and accelerometry-based variables. The same was observed for the Czech sites (Olomouc and Hradec Kralove), whereas, in most cases, Aarhus (Denmark) showed the largest discrepancies between IPAQ-LF and accelerometry-based estimates of PA. This finding is unlikely to have arisen due to the higher prevalence of cycling in the Danish sample, as analyses were adjusted for the self-reported proportion of PA time spent on cycling for transport, and the Belgian sample also reported higher proportions of PA time devoted to cycling for transport. Also, a recent study comparing PA estimates derived from the IPAQ—Short Form with objectively assessed PA using accelerometry plus heart rate monitors found large between-method differences in PA estimates (33). These findings are suggestive of systematic cultural and/or linguistic differences in the interpretation of the IPAQ-LF items, which have implications for the interpretation of international PA and SB surveillance data as well as findings from multicountry studies.
Assuming uncorrelated measurement errors, the fact that relative agreement between IPAQ-LF and accelerometry-based PA and SB variables was not moderated by study city is reassuring as it supports the comparability of site-specific findings on correlates of self-reported and objectively assessed PA and SB across various cultures and linguistic areas. However, the presence of potential culture- and linguistic-specific differences in absolute agreement raises concerns about the comparability of PA prevalence estimates.
As observed in other studies (22,32), the relative and/or absolute agreement between self-reported and accelerometry-based PA and SB variables were age, sex, education, and weight status specific. This may be due to differences in fitness level, ability to understand the questionnaire items, adequacy of the accelerometry cut points used in this study, habitual patterns of PA and time use, and other factors. It is an issue that needs to be considered when interpreting sociodemographic differences in levels and correlates of PA and SB.
The types/domains of PA engaged in are another important factor that needs to be considered. Relative and absolute agreement depended on the percentage of total PA time spent on bicycling for transport, leisure-time PA, and occupational PA. As originally hypothesized, larger proportions of PA time spent on cycling for transport and occupational PA were associated with lower levels of agreement between self-report and accelerometry-based variables, whereas the opposite was true for percentage of PA time spent on leisure activities. The negative effect of time spent bicycling is likely due to accelerometers failing to pick up bicycling, whereas the effect of time spent on occupational activities may be a result of respondents likely reporting time spent at work rather than time spent being moderately or vigorously active at work (3). The latter problems may be in part overcome by interview administration of IPAQ-LF or by prompting the participants to avoid reporting light-intensity PA at work, and providing a better description of occupational MVPA.
The present study had several strengths. It was conducted in a large international community sample recruited from a balanced number of high/low socioeconomic status and high/low walkable neighborhoods across six countries. This recruitment strategy enhances the generalizability of the findings. It is the first study to examine an extensive and theoretically justifiable number of measurement-related, sociodemographic, as well as behavioral factors affecting the agreement of self-report and accelerometry-based estimates of PA and SB. Participants were not aware the data would be used for a measurement study, probably enhancing generalizability of the findings. Validity studies may overestimate agreement between self-reports and accelerometry-based estimates of PA and SB because they request participants to wear the accelerometer for 7 d and keep a wear-time diary before completing the questionnaire. This may positively affect the retrieval of information on PA and SB in the past week. Assessing self-reported PA and SB before conducting an objective assessment may provide a more realistic measure of agreement between the two measurement methods and a conservative validity estimate of IPAQ-LF.
The study has also several limitations. Self-reports did not cover the same week of the accelerometer monitoring in all cities except two, so this could have underestimated agreement. We restricted our comparison of IPAQ-LF with accelerometry-based estimates of PA and SB based on the most commonly used Freedson cut points. The use of other cut points would have resulted in different estimates of agreement (36). Waist-worn accelerometers poorly differentiate sitting and reclining from standing (7). Hence, accelerometry-based estimates of SB and self-report measures of sitting time are only weakly conceptually matched. Also, regardless of their placement, these devices have substantial issues in capturing bicycling, water-based activities, upper-body exercise, or resistance activities such as carrying loads or stair climbing (11). Thus, accelerometers are not considered as a “gold standard” method of measurement of PA and SB. Comparisons between study sites using older versus newer accelerometer models might have been somewhat confounded by differences in accelerometer performance (4,31).
CONCLUSIONS
Our findings suggest that, when compared with accelerometry, IPAQ-LF tends to show lower estimates of time spent sitting and higher estimates of total time spent in MVPA. Although relative agreement between methods did not differ across sites, absolute agreement did, even after adjusting for sociodemographic and behavioral moderators (percentage of total PA time spent in specific activities). These issues need to be carefully considered when interpreting PA and SB data collected in diverse cultures, language regions, and sociodemographic groups for the surveillance or investigation of determinants of PA and SB. The findings raise questions about the comparability of PA and SB data across countries and call for further efforts to improve such measures.
Supplementary Material
Acknowledgments
This work was supported by the National Cancer Institute of the National Institutes of Health (R01 CA127296). US data collection and multisite coordinating center processing was supported by the National Institutes of Health (grant nos. R01 HL67350 [NHLBI] and R01 CA127296 [National Cancer Institute] to J.F.S). E.C. is supported by an Australian Research Council Future Fellowship (FT no. 140100085). The contributions of N.O. were supported by an NHMRC Senior Principal Research Fellowship (no. 1003960) and by the Victorian Government’s Operational Infrastructure Support Program. The Danish study was partly funded by the Municipality of Aarhus. Data collection in the Czech Republic was supported by the Ministry of Education, Youth and Sports (grant no. MSM 6198959221). The United Kingdom study was funded by the Medical Research Council under the National Preventive Research Initiative. The Spanish study was partially founded by the Navarra Government Health Department (grant no. 02/09).
Conflicts of interest: K. L. Cain is a consultant for Santech, Inc. J. F. Sallis received grants and personal fees from the Robert Wood Johnson Foundation outside the submitted work and grants and nonfinancial support from Nike, Inc., outside the submitted work; is a Santech, Inc., shareholder; and is a consultant and receiver of royalties from SPARK Programs of School Specialty, Inc.
Results of the present study do not constitute endorsement by the American College of Sports Medicine.
Footnotes
Supplemental digital content is available for this article. Direct URL citations appear in the printed text and are provided in the HTML and PDF versions of this article on the journal’s Web site (www.acsm-msse.org).
REFERENCES
- 1. Bauman A, Ainsworth BE, Sallis JF, et al. The descriptive epidemiology of sitting: a 20 country comparison using the International Physical Activity Questionnaire (IPAQ). Am J Prev Med. 2011; 41(2): 228– 37. [DOI] [PubMed] [Google Scholar]
- 2. Bauman A, Bull FC, Craig CL, et al. The International Prevalence Study on Physical Activity: results from 20 countries. Int J Behav Nutr Phys Act. 2009; 6: 21. [DOI] [PMC free article] [PubMed] [Google Scholar]
- 3. Boon RM, Hamlin MJ, Steel GD, Ross JJ. Validation of the New Zealand Physical Activity Questionnaire (NZPAQ-LF) and the International Physical Activity Questionnaire (IPAQ-LF) with accelerometry. Br J Sports Med. 2010; 44(10): 741– 6. [DOI] [PubMed] [Google Scholar]
- 4. Cain K, Conway TL, Adams MA, Husak LE, Sallis JF. Comparison of older and newer generations of ActiGraph accelerometers with the normal filter and low frequency extension. Int J Behav Nutr Phys Act. 2013; 10: 51. [DOI] [PMC free article] [PubMed] [Google Scholar]
- 5. Cerin E, Barnett A, Cheung MC, Sit C HP, Macfarlane DJ, Chan WM. Reliability and validity of the IPAQ-L in a sample of Hong Kong urban older adults: does neighborhood of residence matter? J Aging Phys Act. 2012; 20(4): 402– 20. [DOI] [PubMed] [Google Scholar]
- 6. Cerin E, Cain KL, Conway TL, et al. Neighborhood environments and objectively measured physical activity in 11 countries. Med Sci Sports Exerc. 2014; 46(12): 2253– 64. [DOI] [PMC free article] [PubMed] [Google Scholar]
- 7. Chastin SF, Culhane B, Dall M. Comparison of self-reported measure of sitting time (IPAQ) with objective measurement (activPAL). Physiol Meas. 2014; 35: 2319– 28. [DOI] [PubMed] [Google Scholar]
- 8. Cohen J. Statistical Power Analysis for the Behavioral Sciences. 2nd ed Hillsdale (NJ): Lawrence Erlbaum; 1988. p. 590. [Google Scholar]
- 9. Craig CL, Marshall AL, Sjöström M, et al. International physical activity questionnaire: 12-country reliability and validity. Med Sci Sports Exerc. 2003; 35(8): 1381– 95. [DOI] [PubMed] [Google Scholar]
- 10. De Bourdeaudhuij I, Van Dyck D, Salvo D, et al. International study of perceived neighbourhood environmental attributes and body mass index: IPEN adult study in 12 countries. Int J Behav Nutr Phys Act. 2015; 12: 62. [DOI] [PMC free article] [PubMed] [Google Scholar]
- 11. Dishman RK, Washburn RA, Schoeller DA. Measurement of physical activity. Quest. 2001; 53(3): 295– 309. [Google Scholar]
- 12. Dyrstad SM, Hansen BH, Holme IM, Anderssen SA. Comparison of self-reported versus accelerometer-measured physical activity. Med Sci Sports Exerc. 2014; 46(1): 99– 106. [DOI] [PubMed] [Google Scholar]
- 13. Ekelund U, Sepp H, Brage S, et al. Criterion-related validity of the last 7-day, short form of the International Physical Activity Questionnaire in Swedish adults. Public Health Nutr. 2006; 9(2): 258– 65. [DOI] [PubMed] [Google Scholar]
- 14. Fox J, Weisberg S. An R Companion to Applied Regression. 2nd ed Thousand Oaks (CA): Sage; 2011. p. 450. [Google Scholar]
- 15. Freedson PS, Melanson E, Sirard J. Calibration of the Computer Science and Applications, Inc. accelerometer. Med Sci Sports Exerc. 1998; 30(5): 777– 81. [DOI] [PubMed] [Google Scholar]
- 16. Freedson PS, Miller K. Objective monitoring of physical activity using motion sensors and heart rate. Res Q Exerc Sport. 2000; 71(2 Suppl): 21S– 9. [PubMed] [Google Scholar]
- 17. Garriguet D, Tremblay S, Colley RC. Comparison of Physical Activity Adult Questionnaire results with accelerometer data. Health Rep. 2015; 26(7): 11– 7. [PubMed] [Google Scholar]
- 18. Hallal PC, Andersen LB, Bull FC, et al. Global physical activity levels: surveillance progress, pitfalls, and prospects. Lancet. 2012; 380(9838): 247– 57. [DOI] [PubMed] [Google Scholar]
- 19. Herman Hansen B, Børtnes I, Hildebrand M, Holme I, Kolle E, Anderssen SA. Validity of the ActiGraph GT1M during walking and cycling. J Sports Sci. 2014; 32(6): 510– 6. [DOI] [PubMed] [Google Scholar]
- 20. Kerr J, Sallis JF, Owen N, et al. Advancing science and policy through a coordinated international study of physical activity and built environments: IPEN adult methods. J Phys Act Health. 2013; 10(4): 581– 601. [DOI] [PubMed] [Google Scholar]
- 21. Kim Y, Park I, Kang M. Convergent validity of the international physical activity questionnaire (IPAQ): meta-analysis. Public Health Nutr. 2013; 16(3): 440– 52. [DOI] [PMC free article] [PubMed] [Google Scholar]
- 22. Lee PH, Yu YY, McDowell I, Leung GM, Lam TH, Stewart SM. Performance of the International Physical Activity Questionnaire (short form) in subgroups of the Hong Kong Chinese population. Int J Behav Nutr Phys Act. 2011; 8: 81. [DOI] [PMC free article] [PubMed] [Google Scholar]
- 23. Macfarlane D, Chan A, Cerin E. Examining the validity and reliability of the Chinese version of the International Physical Activity Questionnaire, Long Form (IPAQ-LC). Public Health Nutr. 2011; 14(3): 443– 50. [DOI] [PubMed] [Google Scholar]
- 24. Mâsse LC. Reliability, validity, and methodological issues in assessing physical activity in a cross-cultural setting. Res Q Exerc Sport. 2000; 71(2 Suppl): 54S– 8. [PubMed] [Google Scholar]
- 25. Matthews CE, Chen KY, Freedson PS, et al. Amount of time spent in sedentary behaviors in the United States, 2003–2004. Am J Epidemiol. 2008; 167(7): 875– 81. [DOI] [PMC free article] [PubMed] [Google Scholar]
- 26. McAdams MA, Van Dam RM, Hu FB. Comparison of self-reported and measured BMI as correlates of disease markers in US adults. Obesity. 2007; 15(1): 188– 96. [DOI] [PubMed] [Google Scholar]
- 27. Nang EE, Gitau Ngunjiri SA, Wu Y, et al. Validity of the International Physical Activity Questionnaire and the Singapore Prospective Study Program physical activity questionnaire in a multiethnic urban Asian population. BMC Med Res Methodol. 2011; 11: 141. [DOI] [PMC free article] [PubMed] [Google Scholar]
- 28. Pedišić Ž, Bauman A. Accelerometer-based measures in physical activity surveillance: current practices and issues. Br J Sports Med. 2015; 49(4): 219– 23. [DOI] [PubMed] [Google Scholar]
- 29. Plasqui G, Bonomi AG, Westerterp KR. Daily physical activity assessment with accelerometers: new insights and validation studies. Obes Rev. 2013; 14(6): 451– 62. [DOI] [PubMed] [Google Scholar]
- 30.R Core Team. R: A language and environment for statistical computing. Vienna (Austria): R Foundation for Statistical Computing; [cited 2015 Jun 8]. Available from: http://www.R-project.org/.
- 31. Sasaki JE, John D, Freedson PS. Validation and comparison of ActiGraph activity monitors. J Sci Med Sport. 2011; 14: 411– 6. [DOI] [PubMed] [Google Scholar]
- 32. Scholes S, Coombs N, Pedisic Z, et al. Age- and sex-specific criterion validity of the health survey for England Physical Activity and Sedentary Behavior Assessment Questionnaire as compared with accelerometry. Am J Epidemiol. 2014; 179(12): 1493– 502. [DOI] [PMC free article] [PubMed] [Google Scholar]
- 33. Steene-Johannessen J, Anderssen SA, van der Ploeg HP, et al. Are self-report measures able to define individuals as physically active or inactive? Med Sci Sports Exerc. 2016; 48(2): 235– 44. [DOI] [PMC free article] [PubMed] [Google Scholar]
- 34. Terwee CB, Mokkink LB, van Poppel MN, Chinapaw MJ, van Mechelen W, de Vet HC. Qualitative attributes and measurement properties of physical activity questionnaires: a checklist. Sports Med. 2010; 40(7): 525– 37. [DOI] [PubMed] [Google Scholar]
- 35. Troiano RP. Translating accelerometer counts into energy expenditure: advancing the quest. J Appl Physiol. 2006; 100(4): 1107– 8. [DOI] [PubMed] [Google Scholar]
- 36. Tudor-Locke C, Camhi SM, Troiano RP. A catalog of rules, variables and definitions applied to accelerometry data in the National Health and Nutrition Examination Survey 2003–2006. Prev Chronic Dis. 2012; 9: E113. [DOI] [PMC free article] [PubMed] [Google Scholar]
- 37. Vandelanotte C, De Bourdeaudhuij I, Philippaerts RM, Sjöström M, Sallis JF. Reliability and validity of a computerized and Dutch version of the International Physical Activity Questionnaire (IPAQ). J Phys Act Health. 2005; 2(1): 63– 75. [Google Scholar]
- 38. Vuillemin A, Oppert J, Guillemin F, et al. Self-administered questionnaire compared with interview to assess past-year physical activity. Med Sci Sports Exerc. 2000; 32(6): 1119– 24. [DOI] [PubMed] [Google Scholar]
- 39. Wolin KY, Heil DP, Askew S, Matthews CE, Bennett GG. Validation of the International Physical Activity Questionnaire-Short among Blacks. J Phys Act Health. 2008; 5(5): 746– 60. [DOI] [PMC free article] [PubMed] [Google Scholar]
- 40. Wood S. Generalized Additive Models: An Introduction with R. Boca Raton (FL): Chapman and Hall; 2006. p. 392. [Google Scholar]
Associated Data
This section collects any data citations, data availability statements, or supplementary materials included in this article.