Coregistered correlative histopathologic data were used as the “ground truth” for development of quantitative multiparametric MR imaging models yielding voxel-wise predictors for detection of prostate cancer that outperform single quantitative MR imaging parameters, particularly when the models were assessed at the individual level.
Abstract
Purpose
To develop multiparametric magnetic resonance (MR) imaging models to generate a quantitative, user-independent, voxel-wise composite biomarker score (CBS) for detection of prostate cancer by using coregistered correlative histopathologic results, and to compare performance of CBS-based detection with that of single quantitative MR imaging parameters.
Materials and Methods
Institutional review board approval and informed consent were obtained. Patients with a diagnosis of prostate cancer underwent multiparametric MR imaging before surgery for treatment. All MR imaging voxels in the prostate were classified as cancer or noncancer on the basis of coregistered histopathologic data. Predictive models were developed by using more than one quantitative MR imaging parameter to generate CBS maps. Model development and evaluation of quantitative MR imaging parameters and CBS were performed separately for the peripheral zone and the whole gland. Model accuracy was evaluated by using the area under the receiver operating characteristic curve (AUC), and confidence intervals were calculated with the bootstrap procedure. The improvement in classification accuracy was evaluated by comparing the AUC for the multiparametric model and the single best-performing quantitative MR imaging parameter at the individual level and in aggregate.
Results
Quantitative T2, apparent diffusion coefficient (ADC), volume transfer constant (Ktrans), reflux rate constant (kep), and area under the gadolinium concentration curve at 90 seconds (AUGC90) were significantly different between cancer and noncancer voxels (P < .001), with ADC showing the best accuracy (peripheral zone AUC, 0.82; whole gland AUC, 0.74). Four-parameter models demonstrated the best performance in both the peripheral zone (AUC, 0.85; P = .010 vs ADC alone) and whole gland (AUC, 0.77; P = .043 vs ADC alone). Individual-level analysis showed statistically significant improvement in AUC in 82% (23 of 28) and 71% (24 of 34) of patients with peripheral-zone and whole-gland models, respectively, compared with ADC alone. Model-based CBS maps for cancer detection showed improved visualization of cancer location and extent.
Conclusion
Quantitative multiparametric MR imaging models developed by using coregistered correlative histopathologic data yielded a voxel-wise CBS that outperformed single quantitative MR imaging parameters for detection of prostate cancer, especially when the models were assessed at the individual level.
© RSNA, 2016
Introduction
Multiparametric magnetic resonance (MR) imaging continues to evolve as an increasingly valuable tool in the diagnosis and treatment of prostate cancer (1–3). Even with the recognized potential of multiparametric MR imaging demonstrated in the literature, the detection of prostate cancer in clinical practice remains challenging, because diagnostic performance is highly dependent on reader experience and expertise (4–6). This variability in performance persists (7) even with the development and use of early standards for the interpretation and reporting of multiparametric MR imaging prostate data such as the Prostate Imaging Reporting and Data System, or PI-RADS, (8). Although these standards are being adopted clinically, they continue to evolve, and it is still unclear how best to weight the relative importance of each acquisition comprising the multiparametric MR imaging examination. In addition, there is a need to standardize diagnostic performance so that it is more independent of interpreter skill and experience. The development of quantitative models for reliably and objectively interpreting and combining the data from multiparametric MR imaging may provide a way to address both issues.
Predictive models, which can be created to help identify disease from the multiparametric MR imaging data, are a possible alternative or adjunct to direct radiologic interpretation (9–20). Constructing such models requires the use of a “ground truth” from correlative histopathologic examination of biopsies (9,16,19,20) or of the complete prostate after prostatectomy (11–15,17,18). Postprostatectomy histopathologic examination has the potential to provide the most comprehensive correlative data, because access to tissue from the complete prostate can provide the location and extent of both cancerous and noncancerous tissue and a more accurate assessment of grade. However, to capitalize on the full potential of the postprostatectomy histopathologic results, registration of the excised tissue with in vivo imaging is needed, a challenge that has not been undertaken to date.
In this study we developed multiparametric MR imaging models to generate a quantitative, user-independent, voxel-wise composite biomarker score (CBS) for detection of prostate cancer by using coregistered correlative histopathologic results, and we compared detection performance of the models with that of single quantitative MR imaging parameters.
Materials and Methods
Study Design and Population
This prospectively designed, single-institution study was approved by the local institutional review board; informed consent was obtained from each patient. Between November 2009 and August 2012, all patients at our institution with biopsy-proven prostate cancer and an indicated preference for surgery as definitive therapy were recruited to participate in an MR imaging study performed with the use of an endorectal coil. Patient selection was solely dictated by a patient’s willingness to consent to the research procedure along with our ability to schedule examinations with the MR imaging systems we used for research at least 6 weeks after biopsy and before surgery.
Inclusion of a patient’s data in the final analysis required (a) a complete multiparametric MR imaging dataset free from significant motion artifacts, (b) whole-organ tissue procured at definitive surgery free from sectioning artifacts, (c) lesion volumes defined at pathologic examination to be greater than or equal to 0.2 cm3, and (d) anatomic correspondence between the postsurgical histopathologic and in vivo MR imaging data based on visual inspection. Poor sectioning, which caused some patients to be excluded, was primarily the result of incorrect placement of the prostate in the sectioning box, resulting in gross sections not matching the orientation of in vivo imaging planes. Decisions on MR imaging quality and anatomic correspondence were made by the study physicist (G.J.M., with 13 years of experience in prostate imaging).
MR Imaging and Parametric Mapping
Multiparametric MR imaging data were acquired by using a clinical 3-T imager (Tim TRIO; Siemens Medical Solutions, Erlangen, Germany). A surface array coil combined with an inflatable endorectal coil (Medrad, Whippany, NJ) was used for signal reception. Perfluorocarbon (Fluorinert; 3M, Saint Paul, Minn) was used for coil inflation to minimize susceptibility mismatches. An 18-F (6.0 mm) urethral catheter (Robinson Model; C.R. Bard, Murray Hill, NJ) was inserted into the rectum parallel and posterior to the endorectal coil to deflate gases proximal to the coil. No antiperistalsis drugs were used in the course of these studies.
After confirming adequate positioning of the endorectal coil on scout images, we performed anatomic and functional MR imaging sequences as summarized in Table 1. All imaging series were performed in the axial orientation perpendicular to the prostate-rectum border, with the exception of two additional anatomic imaging series run with sagittal and coronal orientations. In addition, for the dynamic contrast material–enhanced MR imaging acquisition, 50 dynamic volumes were acquired with 6-second temporal resolution. Three volume series were performed before the administration of 0.1 mmol/kg of gadopentetate dimeglumine (Magnevist; Bayer Schering AG, Berlin, Germany) at a rate of 3 mL/sec followed by a 30-mL saline flush at the same rate.
Table 1.
MR Imaging Acquisition Parameters
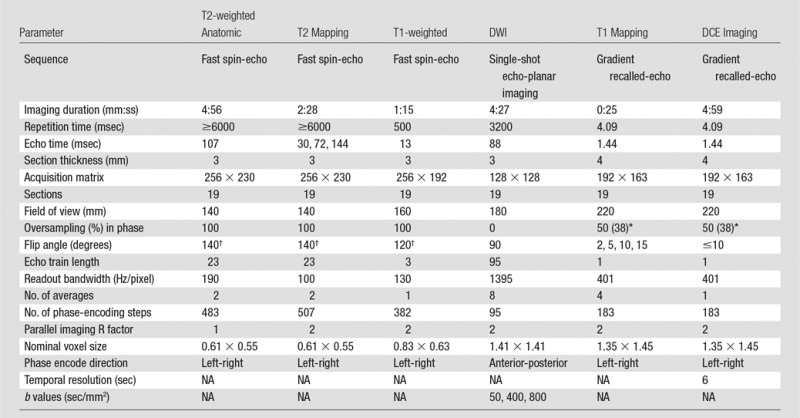
Note.—DCE = dynamic contrast enhanced, DWI = diffusion-weighted imaging, NA = not applicable.
*Data in parentheses report the oversampling in section direction.
†Reported flip angles are for the refocusing rather than the excitation radiofrequency pulses.
Parametric Mapping
The acquired data allowed for the calculation of quantitative maps including T1, apparent T2, apparent diffusion coefficient (ADC), and pharmacokinetic parameters such as forward volume transfer constant (Ktrans), reflux rate constant (kep), fractional extravascular extracellular space (ve), and area under the gadolinium concentration time curve at 90 seconds (AUGC90). This set of calculated parameters will be collectively referred to herein as the quantitative MR imaging data. Maps of prostate T2 values were calculated from the multiple echo time fast spin-echo data sets by using methods previously described and validated by Liney et al (21) and Gibbs et al (22). T1 maps were generated by using the three-dimensional driven equilibrium single-pulse observation of T1 method (23). ADC maps were generated by using the manufacturer’s standard reconstruction from the single-shot echo-planar imaging acquisitions and multidirectional encoding (manufacturer’s three-scan trace). Pharmacokinetic maps were generated by using a modified Toft model (24) with a previously published population-averaged arterial input function (25). The fitted model provided the following pharmacokinetic parameters: Ktrans, kep, fractional extravascular extracellular space (Ktrans/kep), and AUGC90. The T2 mapping, T1 mapping, and pharmacokinetic modeling performed with software written in-house (IDL; ITT, Boulder, Colo).
Development of Correlative Histopathology
Resected prostates were sectioned, and resulting slides were digitized and annotated (ie, manual marking of cancer extent and grade). Study pathologists (L.M., A.D.J., and S.C.S., with 3, 4, and 13 years of experience, respectively) performed the annotations manually, blinded to the MR images, by following a previously published protocol developed to improve the correspondence between the pathologic sectioning and in vivo MR imaging section planes (26). Final validation of all annotations was performed by S.C.S. The digitized and annotated histopathologic specimens were then assembled into pseudo–whole-mount sections (Fig 1, A) and were volumetrically reassembled (Fig 1, D; Appendix E1 [online]).
Figure 1:
A, Digitized and annotated pathologic specimens assembled into a pseudo-whole mount from four quarter-mount slides. B, Annotated region of cancer from histopathologic examination is shown deformably registered to the corresponding anatomic T2-weighted image by using local affine transformation guided by internal structures. C, Prostate pseudocapsule and central gland on anatomic T2-weighted images (yellow circle) provide zonal information. D, Volumetrically reassembled prostate annotations from histopathologic examination including the capsule (green) and regions of graded cancer (pink and purple) allowing annotation grouping for lesion identification and volume determination.
Generating the data needed for the development of voxel-wise models involved first identifying the center section of the qualifying lesions at pathologic examination and deformably mapping pathologist-annotated regions of disease to the corresponding MR imaging section by using the local affine transformation guided by internal structures (LATIS) registration method (26) (Fig 1, B). To provide zonal information, the prostate pseudo-capsule, central gland (consisting of the transitional and central zones), and peripheral zone were identified on the anatomic T2-weighted images by using semiautomated segmentation software (Segasist, Ontario, Canada) (Fig 1, C) (G.J.M.). The annotations from histologic examination and MR imaging were combined to define the following regions: the noncancer peripheral zone, the noncancer central gland, the cancer peripheral zone, and the cancer central gland. These regions were subsequently transferred from the T2-weighted anatomic images onto each of the corresponding quantitative MR imaging datasets. By using the transferred regions, two data pools were generated from the quantitative MR imaging data: the first including only the cancer and noncancer peripheral zones for generating the peripheral-zone model, and the second including all four zones for generating the whole- gland model (Appendix E1 [online]).
Predictive Modeling
For the two data pools, both single-parameter and multiple-parameter analyses were performed. The data pools were individually filtered to remove parameter values of zero (resulting primarily from failed parametric mapping of the dynamic contrast-enhanced MR imaging and T2 data). A value of zero for one parameter did not exclude other nonzero parameters for that voxel from the single-parameter analysis, but only voxels with nonzero values for all parameters were included in the multivariate analysis. Single parameters were summarized for cancer and noncancer voxels by using the median values. Confidence intervals for the median and corresponding P values were calculated by using the bootstrap procedure that accounts for the correlation between voxels from the same subject (27) (Appendix E1 [online]). Only the individual parameters that showed a significant difference between cancer and noncancer voxels after a Bonferoni multiple comparisons adjustment (ie, P ≤ .0036 = .05/14) were included as candidates in the development of the subsequent multiparametric MR imaging model. The classification accuracy of each individual parameter was evaluated by using the receiver operating characteristic curve and was summarized by using the area under the receiver operating characteristic curve (AUC) values.
Multiparametric modeling was performed by means of logistic regression with the least absolute shrinkage and selection operator (LASSO) penalty implemented in an open source statistical environment (R Software, glmnet package; R Foundation for Statistical Computing, Vienna, Austria) (28). LASSO enables the development of models with increasing numbers of quantitative MR imaging parameters. The classification accuracy of these “n” parameter models was evaluated using the receiver operating characteristic curve estimated by leave-one-out cross-validation. Leave-one-out cross validation provides a bias-adjusted estimate that represents the performance we would expect to observe in an independent validation data set. Details on the use of the LASSO and cross-validation procedure are provided in Appendix E1 (online). From the n-parameter multiparametric models, a CBS was calculated for each voxel by using a linear combination of the multiple quantitative MR (qMR) imaging parameters, such that:
where β0 and βqMR are the regression parameters estimated from the LASSO.
The classification accuracy of CBS was compared with the best-performing single parameter (ie, the parameter with the highest AUC) both throughout all subjects (ie, aggregate analysis) and on a subject-by-subject basis (ie, individual-level analysis). Aggregate performance was summarized with the AUC and sensitivity corresponding to 90% specificity (S90) from the cross-validation–adjusted receiver operating characteristic curve. Confidence intervals and P values for comparing the single best quantitative MR imaging parameter and the multiparametric MR imaging models were calculated by using a bootstrap procedure that accounted for the correlation between voxels within a subject (Appendix E1 [online]). The individual-level improvement also was assessed by comparing the AUC of the CBS to the best single quantitative MR imaging predictor with confidence intervals and P values calculated by using the bootstrap procedure. A Bonferroni adjustment for multiple comparisons was used to determine if a significant improvement occurred in the individual analysis.
The voxel-wise application of the multiparametric MR imaging model allowed the construction of CBS maps. Predictive maps of cancer were subsequently determined from CBS maps by using model-dependent (ie, peripheral-zone and whole-gland models) thresholds that provided 90% specificity. Predictive CBS maps were compared with those generated by using the best-performing single parameter in each data pool.
Results
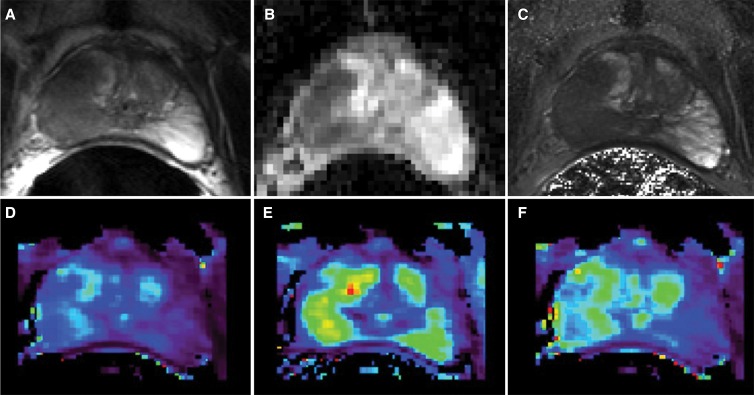
A total of 77 consecutive patients provided informed consent and were imaged. From the original 77 patients enrolled, 53 received surgery as treatment. Four from this group were excluded because of excessive motion and/or incomplete dynamic contrast-enhanced MR imaging. After excluding eight additional patients for sections with poor anatomic correspondence of imaging and pathologic results and seven with cancer lesions measuring less than 0.2 cm3, we had a final population that included 34 patients. Demographic data, serum prostate-specific antigen value, time between MR imaging and surgery, and pathologic tumor stage for the 34 patients are reported in Table 2. Voxels from a total of 41 lesions in these patients were included in the construction of the predictive models. The Gleason scores, volumes of the included lesions, and the number of available voxels of each grade are reported in Table 3. An example of the quantitative MR imaging parametric maps obtained from these patients is shown in Figure 2.
Table 2.
Clinical-Pathologic Features in the Study Population
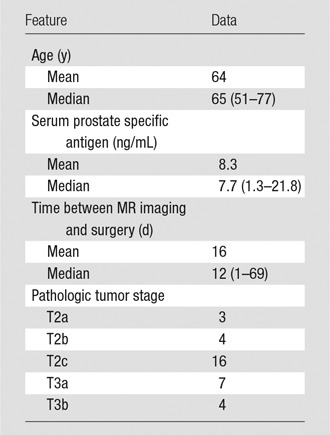
Note.—Data in parentheses are the range.
Table 3.
Cancer Features
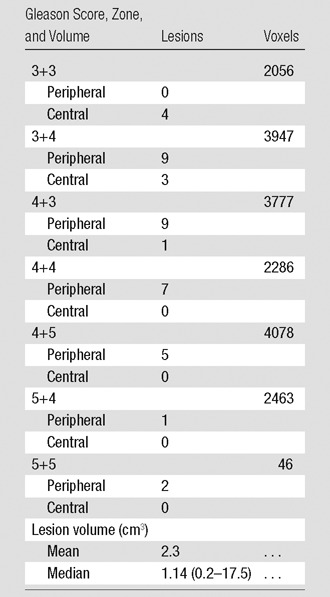
Note.—Values reported on a per lesion basis. Data in parentheses are the range. There were a total of 41 lesions from the 34 patients.
Figure 2:
Examples of parametric maps used in multiparametric MR imaging analysis. A, Reference anatomic T2-weighted fast spin-echo image followed by corresponding maps of, B, ADC, C, T2, D, Ktrans, E, kep, and, F, AUGC90.
Results from the single-parameter voxel-wise analyses are shown in Table 4. Presented are the number of nonzero voxels for each parameter, the medians for cancer and noncancer voxels, P values for comparing the medians between cancer and noncancer voxels, and AUCs for discriminating between cancer and noncancer voxels. Significant differences between cancer and noncancer voxels were observed for quantitative T2, ADC, Ktrans, kep, and AUGC90 for both the peripheral -zone and whole-gland pools (P < .001, in all cases), therefore these were included in the subsequent multiparametric analysis. Because ADC was the best single discriminator between cancer and noncancer voxels for both the peripheral-zone and whole-gland pools, it served as the primary basis for comparison with the multiparametric results.
Table 4.
Comparison of Median Parameter Values between Cancer and Noncancer Voxels
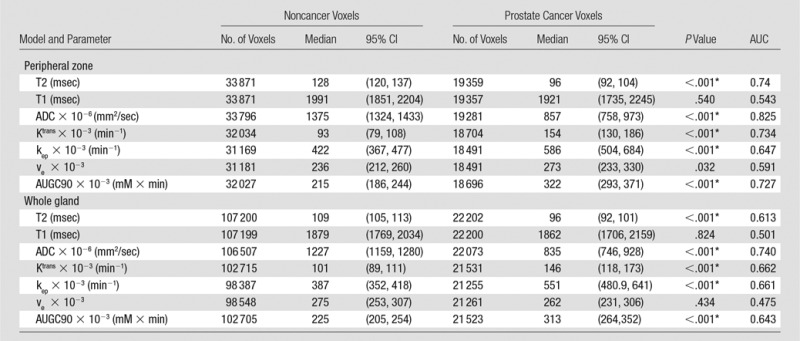
Note.—P values are comparisons of prostate cancer with noncancer. CI = confidence interval, ve = fractional extravascular extracellular space.
*Indicates a significant difference.
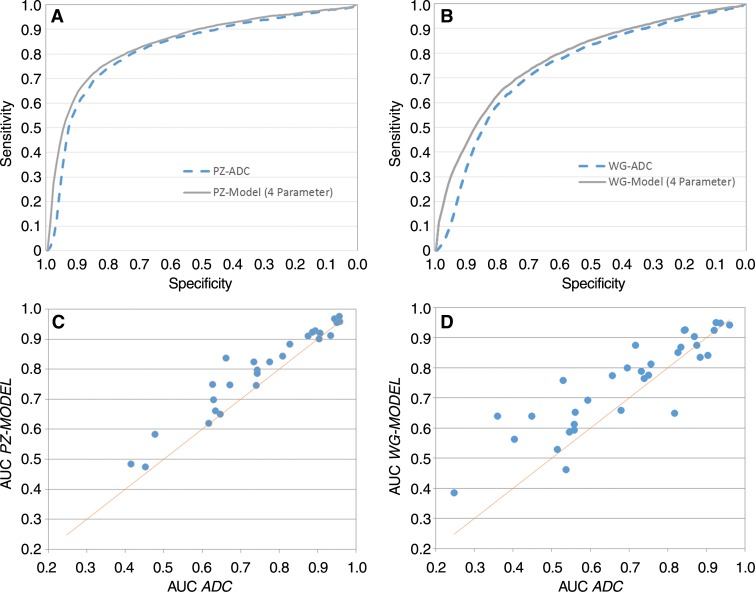
Results of the aggregate analyses of the n–parameter multiparametric models for the peripheral zone and whole-gland pools can be found in Table 5. All comparisons were with ADC, the best-performing single parameter. The multiparametric model resulted in an improved AUC and S90 for the peripheral-zone pool regardless of the number of parameters greater than or equal to two. The peripheral-zone model with four parameters, which included ADC, AUGC90, kep, and quantitative T2, performed the best, with an AUC of 0.850 (vs 0.82 [P = .010]) and an S90 of 0.65 (vs 0.60, [P = .063]). For the whole-gland pool, the multiparametric model resulted in an improved AUC and S90 for greater than or equal to three parameters. Of the whole-gland models, the four-parameter model consisting of ADC, kep, AUGC90, and Ktrans performed the best, with an AUC of 0.771 (vs 0.742 for ADC; P = .043) and an S90 of 0.427 (vs 0.34 for ADC, P = .101). The receiver operating characteristic curves for the aggregate analysis of ADC and the four-parameter multiparametric models are shown for the peripheral-zone and whole-gland data pools in Figure 3, A and B, respectively. These data characterize the ability of the different models to differentiate pixels as cancer or noncancer throughout all subjects in aggregate.
Table 5.
AUC and S90 for Combinations of MR Imaging Parameters
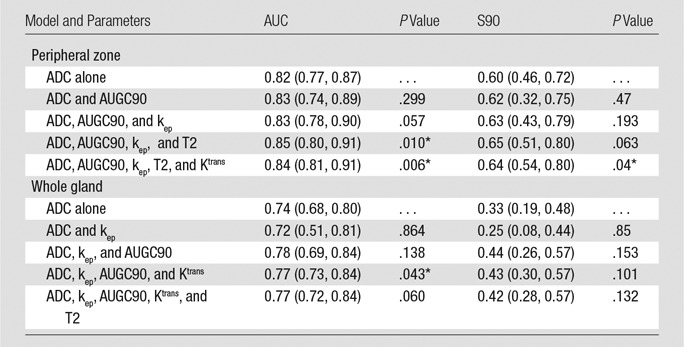
Note.—Data in parentheses are 95% confidence intervals. P values are for comparison of the ADC versus the model.
*Indicates a significant difference between the given model and ADC.
Figure 3:
Receiver operating characteristic curves for, A, peripheral-zone (PZ) model and, B, whole-gland (WG) models (solid curves) compared with best performing single quantitative parameters, ADC (broken curve). Scatterplots for individual subjects show comparison of, C, AUCs generated with peripheral zone model and ADC in voxels from peripheral zone tissue and, D, AUCs generated with whole-gland model and ADC in voxels from whole gland.
The individual-level analyses are shown in the scatterplots of Figure 3, C and D. These data demonstrate the difference between the AUC obtained with a single-parameter (ADC) and that of a four-parameter model for both the peripheral-zone and whole-gland pools. The AUC for the four-parameter model was greater than the AUC for ADC in patients above the unity line, while those below performed worse. We observed a statistically significant improvement in the AUC for the four-parameter model compared with ADC in 82% (23 of 28) of cases with the peripheral-zone model and 71% (24 of 34) of cases with the whole-gland model.
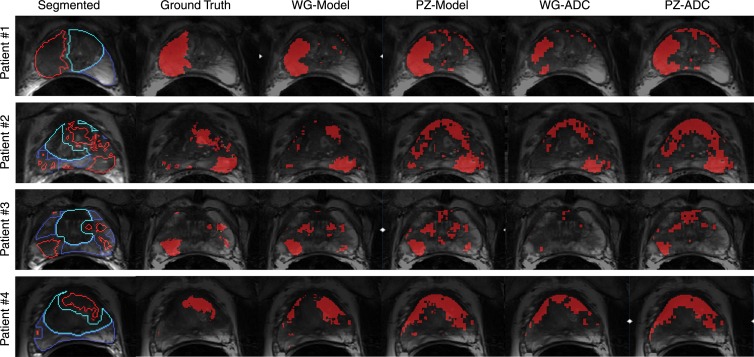
Figure 4 shows several representative patients in this study whose images are used to compare the ability of ADC and CBS to predict cancer location and extent compared with the mapped areas of cancer from pathologic results (ie, the ground truth). The regression coefficients estimated from the four-parameter regression models were used to calculate voxel-wise CBS with the peripheral-zone and whole-gland models. Detection thresholds for ADC and CBS values were chosen to achieve a specificity value of 90%. Pixels exceeding the 90% specificity threshold were identified as cancer and displayed as red.
Figure 4:
Images in four representative patients show segmented anatomic data (column 1), ground truth maps of cancer from registered cancer regions from histopathologic examination (column 2), thresholded CBS maps of predicted cancer from the whole-gland (WG) model (column 3) and the peripheral zone (PZ) model (column 4), and thresholded ADC maps of cancer with thresholds determined from whole-gland data (column 5) and from the peripheral zone data (column 6). Different contours in segmented anatomic data (column 1) represent cancer (red contour), noncancer in peripheral zone (dark blue contour), and noncancer central gland (light blue contour). Pixels within these contoured regions were used when defining data pools for whole-gland and peripheral-zone model construction and analyses. Ground truth maps of cancer (column 2) are composed of filled red contours from the segmented anatomic data and facilitate comparison with predicted cancer maps in columns 3–6. Goal is for predicted cancer maps to match ground truth maps as closely as possible. Maps of predicted cancer (solid red regions) overlaid on corresponding anatomic T2-weighted images in columns 3–6 use model-specific thresholds of CBS and ADC appropriate for achieving overall specificity of 90%.
The multiple patients included in Figure 4 show regions of cancer originating from a single focus in the peripheral zone (patient 1), multiple peripheral-zone and central-gland foci (patients 2–3), and a single central-gland focus (patient 4). For these cases, the whole-gland–model CBS was the most consistent for detection and evaluation of the extent of cancer compared with the ground truth maps. Although the other models showed reasonable results, they allowed cancer to be missed (patient 3: whole-gland ADC), allowed underestimation of cancer extent (patient 1: whole-gland ADC), or allowed overestimation of cancer extent (patient 4: peripheral-zone model, whole-gland ADC, peripheral-zone ADC).
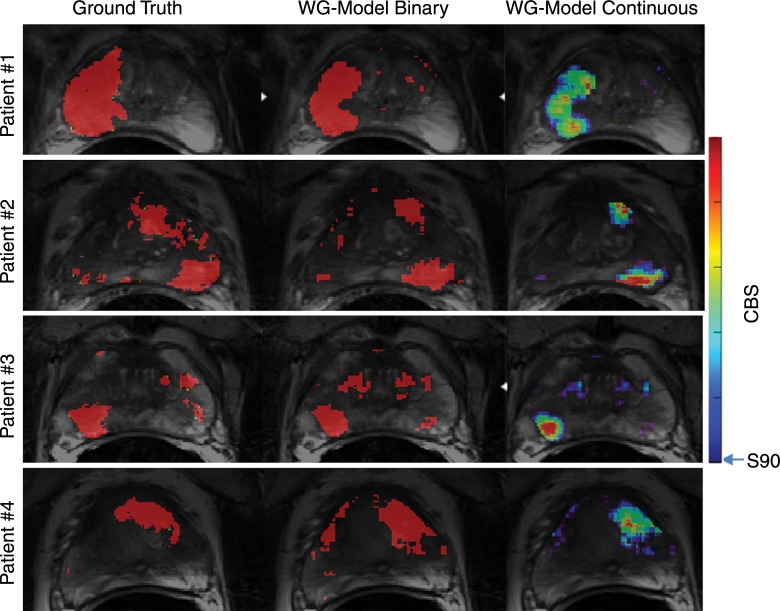
The CBS values calculated with the presented equation are continuous in nature and can be displayed as color scale maps rather than as the binary detection maps shown in Figure 4. Figure 5 shows maps of CBS as a color map in comparison to the ground truth and binary prediction maps for the whole-gland model.
Figure 5:
Registered areas of disease from pathologic evaluation used as the ground truth (red regions left column) are compared with whole-gland (WG) model CBS maps overlaid on anatomic T2-weighted images as a binary map used for cancer detection (red regions, middle column) and as a map of continuous quantitative values (color map, right column) as proposed for use in monitoring disease progression or treatment response. The 90% specificity limit was used as the lower threshold in both representations of whole-gland model CBS maps. Upper limit of color bar represents maximum CBS value in data presented.
Discussion
Coregistered, correlative histopathologic data were used as the ground truth for development of quantitative multiparametric MR imaging models to yield voxel-wise predictors for detection of prostate cancer that outperform single quantitative MR imaging parameters, particularly when the models were assessed at the individual level. The individual-level analysis illustrates that there are patients for whom ADC is adequate for discriminating between cancer and noncancer and therefore little improvement can be made by adding additional parameters. However, it also demonstrates that there are patients for whom ADC performs poorly, and in these patients, the use of CBS results in substantial improvements in AUC, with the potential for real clinical effect. Therefore, while the aggregate results are a valid way to assess model performance, averaging data for all patients results in only modest performance gains, as evidenced by small, albeit significant, increases in AUC. Focusing only on the aggregate results overshadows the considerable advantages the models may have for individual patients, which is arguably more clinically important.
The major difference between the aggregate and individual analysis is how the two analyses account for the between- and within-subject variability. Although the whole-gland model produced a significant improvement in the AUC for 71% of patients compared with ADC in the individual-level analysis, the difference barely reached statistical significance in the aggregate analysis (P = .043). In the individual-level analysis, only the voxels within an individual were compared, which eliminates the effect of the between-subject variability, resulting in less variability and more power to discriminate between cancer and noncancer voxels. In comparison, in the aggregate analysis voxels both within and between subjects were compared and thus, incorporated both between- and within-subject variability into the analysis, reducing power. Although the within-subject variability was well characterized in the current analysis, increased patient numbers would have allowed us to better characterize the between-subject variability and would have resulted in a more precise classifier and more power for evaluating its performance.
With respect to model performance, the advantage of the whole-gland model is that it can be applied to the whole prostate without segmentation of the prostate’s zonal anatomy, as required for the peripheral-zone model. Whole-gland ADC by itself performs poorly because of its heterogeneity in the transitional zone. By calculating CBS with the whole-gland model, ADC was combined with multiple pharmacokinetic parameters (kep, AUGC90, and Ktrans), resulting in improved performance in the whole gland. The benefit can be appreciated in the detection maps, where the whole-gland model with the 90% specificity threshold best depicts the location and extent of disease identified by using the pathologic ground truth. In the peripheral zone, the results of this study also support the growing clinical consensus, as reflected in the ACR Prostate Imaging Reporting and Data System version 2 (PI-RADS v2), that the ADC value is the most important single factor in lesion identification. However, while ADC had the largest AUC of any quantitative MR imaging parameter, the multiparametric MR imaging models did demonstrate improved detection compared with ADC alone.
Our approach, in which we used correlative data, is unique, because we use it to map areas of pathologically defined disease to the MR imaging space, making it possible to consider the data from whole-prostate sections when training and testing the predictive models. This aspect of the study is important because it allows the heterogeneity of both cancer and noncancer regions to be considered. Despite the presence of several previously presented registration frameworks to map postprostatectomy tissue onto MR images (29–31), such methods have not been used for development of multiparametric MR imaging models, most likely because of the challenges of obtaining and registering such data. Instead of directly mapping areas of pathologically identified cancer, correlative pathologic results have been used in other ways, including the manual transfer of pathologically defined regions to MR images (11,13,14) or using the pathologic results to identify positive or negative sextants or octants for model development and evaluation (13,18). While these are reasonable strategies, they can both bias the use of the pathologic reference standard and/or limit the ability to reliably assign a ground truth status to each voxel in the imaging space, thus necessitating a region-based analysis. These region-based strategies cannot capture tissue and cancer heterogeneity, which leads to poorer prospective performance compared with models that can distinguish between all cancer and noncancer in the whole gland. In addition, the prospective applicability of some models is further hindered because they require the a priori identification of regions of interest on which the models are applied (9,12,15), a requirement not needed for the calculation of CBS with our models.
A potential limitation of the current models was that they did not take into consideration some anatomic and structural information used by an experienced radiologist. For example, the well-defined nature of nodules of stromal hyperplasia or the “smudged charcoal” appearance of cancer in the central gland were not considered in the models. For these reasons, the specific performance of T2 data in our models may underperform compared to interpretation by an experienced radiologist. To address this issue, additional parameters could be added to the predictive models such as previously demonstrated structural features derived from the T2-weighted anatomic data (9,14,20). A second limitation was that the number of subjects included only partially captured the between-subject heterogeneity, while the voxel-wise data fully captured the within-subject heterogeneity of the quantitative MR imaging parameters. Ideally both would be well represented, and this will be the focus of future studies. A third limitation was that the full heterogeneity in the prostate is also not accounted for, because only a single representative section through the center of each lesion was used to capture both cancer and noncancer voxels. Restricting data to these select sections was necessary because of the absence of adequate three-dimensional registration methods between MR imaging and pathologic results and the desire to avoid mislabeling voxels due to lower through-plane resolution at both MR imaging and pathologic evaluation and subsequent partial-volume effects. A fourth limitation was that the registration procedures assumed coincidental section locations between imaging and histopathologic results and user interaction to define internal structures for guiding the deformable registration methods when developing the correlative data. While prone to some error and user variability, these were arguably less biased than other methods proposed in the literature for using correlative histopathologic results during multiparametric MR imaging model development.
To validate and assess the potential clinical utility of the current models for cancer detection, further studies are needed to compare the diagnostic accuracy of this model to that of a blinded radiologist or a radiologist informed by the CBS maps. Potential synergies may exist when this model is used not alone, but as complimentary information to assist the radiologist’s interpretation of multiparametric MR imaging of the prostate. A true validation study would require an independent population of patients that were not included in model development. In our study we used the same population through a leave-one-out analysis. While continuous maps of CBS would potentially add value in certain applications such as monitoring disease progression or treatment response, we focused on the binary detection maps in our study to attempt to accomplish the same task as a radiologist but in a quantitative, user-independent manner. We envisioned that the current detection threshold, corresponding to a specificity value of 90%, would be optimized for sensitivity and specificity depending on the application of interest such as biopsy or focal therapy targeting. Finally, although we performed our study at 3 T with an endorectal coil, we expect that the models will be accurate for data acquired with a surface coil alone if they are obtained at the same field strength. However, validation of these data also is warranted.
In conclusion, we demonstrate the development of predictive models for prostate cancer detection by using voxel-size multiparametric MR imaging data and coregistered histopathologic results. Both peripheral-zone and whole-gland models showed improved performance compared with that of ADC for detection of prostate cancer, while the whole-gland model improved visualization of disease extent throughout the prostate. More importantly, the individual-level analysis demonstrated that the increased sensitivity and specificity of the models benefitted some subjects more than others, the clinical effect of which must be evaluated in future studies.
Advances in Knowledge
■ A correlative histopathologic dataset has been constructed to develop and test quantitative voxel-based MR imaging models for detection of prostate cancer in the peripheral zone alone and in the whole gland.
■ Five individual quantitative MR imaging parameters (apparent diffusion coefficient [ADC], quantitative T2, and the pharmacokinetic parameters volume transfer constant [Ktrans], reflux rate constant [kep], and area under the gadolinium concentration curve at 90 seconds [AUGC90]) show significant differences between cancer and noncancer (P < .001).
■ ADC is the best single parameter for accurately classifying prostate cancer when compared with quantitative T2 and pharmacokinetic parameters, with area under the receiver operating characteristic curve (AUC) ADC values of 0.82 in the peripheral zone and 0.74 in the whole gland.
■ Composite biomarker score (CBS) values derived from multiparametric models of quantitative MR imaging data outperformed single-parameter predictors for detection of prostate cancer; in the individual-level analysis (ie, assessed subject by subject), the CBS resulted in a statistically significant improvement in AUC for 82% (23 of 28) and 71% (24 of 34) of subjects for the peripheral zone and whole gland, respectively.
■ In the aggregate analysis (ie, averaging across all individuals) the AUC value in the peripheral zone model was 0.85 vs 0.82 for ADC alone (P = .010) and 0.77 vs 0.74 for the whol-gland model versus ADC alone (P = .043).
Implications for Patient Care
■ The CBS is a quantitative and user-independent means to evaluate quantitative multiparametric MR imaging voxel-wise data for determining the location and extent of prostate cancer.
■ While not yet evaluated for this purpose, the CBS may also provide a noninvasive means to improve treatment and biopsy targeting to track disease progression in a way that is not possible with current standard clinical methods.
APPENDIX
Received May 18, 2015; revision requested June 22; revision received August 7; accepted September 11; final version accepted October 16.
Supported by University of Minnesota Interdisciplinary Informatics seed grant funding, Digital Technology Center funding, Doctoral Dissertation Fellowship and Foundation Bridge Grant funding through the Institute for Prostate and Urologic Cancer. Biospecimen handling and whole slide digital imaging was also supported by using University of Minnesota BioNet core facilities. This research was supported by the National Institutes of Health (grants R01-CA131013, R01-CA131013-S1, R01-CA155268, and P41-EB015894).
An earlier incorrect version of this article appeared online. This article was corrected on January 26, 2016.
Disclosures of Conflicts of Interest: G.J.M. Activities related to the present article: disclosed no relevant relationships. Activities not related to the present article: grant pending from the Department of Defense. Other relationships: disclosed no relevant relationships. C.K. Activities related to the present article: disclosed no relevant relationships. Activities not related to the present article: four patents pending. Other relationships: disclosed no relevant relationships. B.S. disclosed no relevant relationships. P.J.B. Activities related to the present article: disclosed no relevant relationships. Activities not related to the present article: consultancy for Breast-Med. Other relationships: disclosed no relevant relationships. X.L. disclosed no relevant relationships. D.H. disclosed no relevant relationships. J.W.N. disclosed no relevant relationships. A.D.J. disclosed no relevant relationships. J.C.H. disclosed no relevant relationships. L.M. disclosed no relevant relationships. B.K. disclosed no relevant relationships. C.A.W. Activities related to the present article: disclosed no relevant relationships. Activities not related to the present article: patent pending, grant pending from the Department of Defense. Other relationships: disclosed no relevant relationships. S.C.S. Activities related to the present article: disclosed no relevant relationships. Activities not related to the present article: patent pending, grant pending from the Department of Defense. Other relationships: disclosed no relevant relationships. J.S.K. Activities related to the present article: disclosed no relevant relationships. Activities not related to the present article: patent pending. Other relationships: disclosed no relevant relationships.
Abbreviations:
- ADC
- apparent diffusion coefficient
- AUC
- area under the receiver operating characteristic curve
- AUGC90
- area under the gadolinium concentration curve at 90 seconds
- CBS
- composite biomarker score
- kep
- reflux rate constant
- Ktrans
- volume transfer constant
- LASSO
- least absolute shrinkage and selection operator
- S90
- sensitivity corresponding to 90% specificity
References
- 1.Kurhanewicz J, Vigneron D, Carroll P, Coakley F. Multiparametric magnetic resonance imaging in prostate cancer: present and future. Curr Opin Urol 2008;18(1):71–77. [DOI] [PMC free article] [PubMed] [Google Scholar]
- 2.Dickinson L, Ahmed HU, Allen C, et al. Magnetic resonance imaging for the detection, localisation, and characterisation of prostate cancer: recommendations from a European consensus meeting. Eur Urol 2011;59(4):477–494. [DOI] [PubMed] [Google Scholar]
- 3.Hedgire SS, Oei TN, McDermott S, Cao K, Patel M Z, Harisinghani MG. Multiparametric magnetic resonance imaging of prostate cancer. Indian J Radiol Imaging 2012;22(3):160–169. [DOI] [PMC free article] [PubMed] [Google Scholar]
- 4.Garcia-Reyes K, Passoni NM, Palmeri ML, et al. Detection of prostate cancer with multiparametric MRI (mpMRI): effect of dedicated reader education on accuracy and confidence of index and anterior cancer diagnosis. Abdom Imaging 2015;40(1):134–142. [DOI] [PMC free article] [PubMed] [Google Scholar]
- 5.Mullerad M, Hricak H, Wang L, Chen HN, Kattan MW, Scardino PT. Prostate cancer: detection of extracapsular extension by genitourinary and general body radiologists at MR imaging. Radiology 2004;232(1):140–146. [DOI] [PubMed] [Google Scholar]
- 6.Ruprecht O, Weisser P, Bodelle B, Ackermann H, Vogl TJ. MRI of the prostate: interobserver agreement compared with histopathologic outcome after radical prostatectomy. Eur J Radiol 2012;81(3):456–460. [DOI] [PubMed] [Google Scholar]
- 7.Rosenkrantz AB, Kim S, Lim RP, et al. Prostate cancer localization using multiparametric MR imaging: comparison of Prostate Imaging Reporting and Data System (PI-RADS) and Likert scales. Radiology 2013;269(2):482–492. [DOI] [PubMed] [Google Scholar]
- 8.Barentsz JO, Richenberg J, Clements R, et al. ESUR prostate MR guidelines 2012. Eur Radiol 2012;22(4):746–757. [DOI] [PMC free article] [PubMed] [Google Scholar]
- 9.Chan I, Wells W, 3rd, Mulkern RV, et al. Detection of prostate cancer by integration of line-scan diffusion, T2-mapping and T2-weighted magnetic resonance imaging; a multichannel statistical classifier. Med Phys 2003;30(9):2390–2398. [DOI] [PubMed] [Google Scholar]
- 10.Morton MJ, Whaley DH, Brandt KR, Amrami KK. Screening mammograms: interpretation with computer-aided detection—prospective evaluation. Radiology 2006;239(2):375–383. [DOI] [PubMed] [Google Scholar]
- 11.Langer DL, van der Kwast TH, Evans AJ, Trachtenberg J, Wilson BC, Haider MA. Prostate cancer detection with multi-parametric MRI: logistic regression analysis of quantitative T2, diffusion-weighted imaging, and dynamic contrast-enhanced MRI. J Magn Reson Imaging 2009;30(2):327–334. [DOI] [PubMed] [Google Scholar]
- 12.Vos PC, Hambrock T, Barenstz JO, Huisman HJ. Computer-assisted analysis of peripheral zone prostate lesions using T2-weighted and dynamic contrast enhanced T1-weighted MRI. Phys Med Biol 2010;55(6):1719–1734. [DOI] [PubMed] [Google Scholar]
- 13.Delongchamps NB, Rouanne M, Flam T, et al. Multiparametric magnetic resonance imaging for the detection and localization of prostate cancer: combination of T2-weighted, dynamic contrast-enhanced and diffusion-weighted imaging. BJU Int 2011;107(9):1411–1418. [DOI] [PubMed] [Google Scholar]
- 14.Tiwari P, Viswanath S, Kurhanewicz J, Sridhar A, Madabhushi A. Multimodal wavelet embedding representation for data combination (MaWERiC): integrating magnetic resonance imaging and spectroscopy for prostate cancer detection. NMR Biomed 2012;25(4):607–619. [DOI] [PMC free article] [PubMed] [Google Scholar]
- 15.Niaf E, Rouvière O, Mège-Lechevallier F, Bratan F, Lartizien C. Computer-aided diagnosis of prostate cancer in the peripheral zone using multiparametric MRI. Phys Med Biol 2012;57(12):3833–3851. [DOI] [PubMed] [Google Scholar]
- 16.Vos PC, Barentsz JO, Karssemeijer N, Huisman HJ. Automatic computer-aided detection of prostate cancer based on multiparametric magnetic resonance image analysis. Phys Med Biol 2012;57(6):1527–1542. [DOI] [PubMed] [Google Scholar]
- 17.Shah V, Turkbey B, Mani H, et al. Decision support system for localizing prostate cancer based on multiparametric magnetic resonance imaging. Med Phys 2012;39(7):4093–4103. [DOI] [PMC free article] [PubMed] [Google Scholar]
- 18.Matulewicz L, Jansen JF, Bokacheva L, et al. Anatomic segmentation improves prostate cancer detection with artificial neural networks analysis of 1H magnetic resonance spectroscopic imaging. J Magn Reson Imaging 2014;40(6):1414–1421. [DOI] [PMC free article] [PubMed] [Google Scholar]
- 19.Stember JN, Deng FM, Taneja SS, Rosenkrantz AB. Pilot study of a novel tool for input-free automated identification of transition zone prostate tumors using T2- and diffusion-weighted signal and textural features. J Magn Reson Imaging 2014;40(2):301–305. [DOI] [PubMed] [Google Scholar]
- 20.Litjens G, Debats O, Barentsz J, Karssemeijer N, Huisman H. Computer-aided detection of prostate cancer in MRI. IEEE Trans Med Imaging 2014;33(5):1083–1092. [DOI] [PubMed] [Google Scholar]
- 21.Liney GP, Knowles AJ, Manton DJ, Turnbull LW, Blackband SJ, Horsman A. Comparison of conventional single echo and multi-echo sequences with a fast spin-echo sequence for quantitative T2 mapping: application to the prostate. J Magn Reson Imaging 1996;6(4):603–607. [DOI] [PubMed] [Google Scholar]
- 22.Gibbs P, Tozer DJ, Liney GP, Turnbull LW. Comparison of quantitative T2 mapping and diffusion-weighted imaging in the normal and pathologic prostate. Magn Reson Med 2001;46(6):1054–1058. [DOI] [PubMed] [Google Scholar]
- 23.Homer J, Beevers MS. Driven-equilibrium single-pulse observation of T1 relaxation. A reevaluation of a rapid “new” method for determining NMR spin-lattice relaxation times. J Magn Reson (1969) 1985;63(2):287–297. [Google Scholar]
- 24.Tofts PS. Modeling tracer kinetics in dynamic Gd-DTPA MR imaging. J Magn Reson Imaging 1997;7(1):91–101. [DOI] [PubMed] [Google Scholar]
- 25.Parker GJ, Roberts C, Macdonald A, et al. Experimentally-derived functional form for a population-averaged high-temporal-resolution arterial input function for dynamic contrast-enhanced MRI. Magn Reson Med 2006;56(5):993–1000. [DOI] [PubMed] [Google Scholar]
- 26.Kalavagunta C, Zhou X, Schmechel SC, Metzger GJ. Registration of in vivo prostate MRI and pseudo-whole mount histology using Local Affine Transformations guided by Internal Structures (LATIS). J Magn Reson Imaging 2015;41(4):1104–1114. [DOI] [PMC free article] [PubMed] [Google Scholar]
- 27.Efron B, Tibshirani RJ. An introduction to the bootstrap. Boca Raton, Fla: Chapman & Hall/CRC, 1994. [Google Scholar]
- 28.Friedman J, Hastie T, Tibshirani R. Regularization Paths for Generalized Linear Models via Coordinate Descent. J Stat Softw 2010;33(1):1–22. [PMC free article] [PubMed] [Google Scholar]
- 29.Chappelow J, Bloch BN, Rofsky N, et al. Elastic registration of multimodal prostate MRI and histology via multiattribute combined mutual information. Med Phys 2011;38(4):2005–2018. [DOI] [PMC free article] [PubMed] [Google Scholar]
- 30.Xiao G, Bloch BN, Chappelow J, et al. Determining histology-MRI slice correspondences for defining MRI-based disease signatures of prostate cancer. Comput Med Imaging Graph 2011;35(7-8):568–578. [DOI] [PubMed] [Google Scholar]
- 31.Orczyk C, Mikheev A, Rosenkrantz AB, Melamed J, Taneja SS, Rusinek H. Imaging of prostate cancer: a platform for 3D co-registration of in-vivo MRI ex-vivo MRI and pathology. Proc SPIE Int Soc Opt Eng 2012;8316:83162M. [DOI] [PMC free article] [PubMed] [Google Scholar]
Associated Data
This section collects any data citations, data availability statements, or supplementary materials included in this article.


