

Abstract
Aiming toward an improved understanding of the regulation of proteins in cancer, recent studies from the Clinical Proteomic Tumor Analysis Consortium (CPTAC) have focused on analyzing cancer tissue using proteomic technologies and workflows. Although many proteogenomics approaches for the study of cancer samples have been proposed, serious methodological challenges remain, especially in the identification of multiple mutational variants or structural variations such as fusion gene events. In addition, although immune system genes play an important role in cancer, identification of IgG peptides remains challenging in proteomic data sets. Here, we describe an integrative proteogenomic method that extends the limit of proteogenomic searches to identify multiple variant peptides as well as immunoglobulin gene variations/rearrangements using customized mining of RNA-seq data. Our results also provide the first extensive characterization of tumor immune response and demonstrate the potential of this method to improve the molecular characterization of tumor subtypes.
Keywords: Proteogenomics, cancer proteogenomics, cancer, CPTAC, TCGA, RNA-seq
Graphical Abstract
INTRODUCTION
Cancers are marked by a progression of somatically acquired genomic lesions. Advanced genomic technologies have led to deep insights into the molecular basis of these diseases as well as to a better understanding of the mutations that drive their progression.1–3 The impact of mutations at the protein level, however, is not as well understood.
To close this gap, recent studies, including publications from the Clinical Proteomic Tumor Analysis Consortium (CPTAC),4 have focused on analyzing cancer tissue using proteomic (mainly mass spectrometry-based) technologies and workflows, with large-scale direct comparisons between transcript and proteomic expression patterns.5 The results confirm large differences between protein and transcript expression and underscore the need for robust proteomic technologies, particularly in the identification of variant peptides as translational evidence for genomic events such as mutations, splicing, structural variation, and others. Since peptides are typically identified by comparing acquired spectra against theoretical spectra from candidate peptides, a customized database of candidate peptides must be created in order to include variants observed in genomic tumor samples and cell lines. The term proteogenomics often refers to searching mass spectra against these specialized databases.6–9 However, recent developments in this field have broadened its definition to include various types of proteogenomic-like approaches.10
Although many proteogenomic methods have been recently proposed,11–17 serious methodological challenges remain. Many methodologies focus on identifying single amino-acid polymorphisms (SAP) by adding peptides that capture the alternative allele.5,13–17 However, a large portion of mutational variants, such as insertions, deletions, substitutions, fusion genes, and immunoglobulin genes, is not captured systematically by such an approach. Transcript evidence is, therefore, increasingly being used both as a means of reducing reference database size5 and for the identification of junction peptides, which are peptides that span noncontiguous parts of the genome. However, the problem of identifying all mutated peptides is not completely solved. For instance, searches are usually conducted against sample-matched transcript data to reduce search space and lower false discovery rates (FDR).5,13–17 Sample-matched data may not always be available, and our own results below suggest increased sensitivity by searching a composite database of multiple RNA-seq data sets. However, this database search leads to a big data problem. For colorectal cancer, The Cancer Genome Atlas3 (TCGA) project alone lists more than 1300 RNA-seq data sets (~5.31 TB).
In this article, we ask if it is feasible to search a large cancer proteome data set against a composite RNA-seq database. We systematically address the challenges of computational tractability, FDR controls, and novel variant detection. Starting from our previous database creation algorithms,6,7 we efficiently build a comprehensive and compact database that non-redundantly stores variant peptide information, and we made further methodological developments to identify complex immunoglobulin peptides. In addition to reducing database size, a crucial step in proteogenomic searches is controlling the number of false positive novel peptide identifications. We demonstrate how the richness (defined below) of the database determines the FDR, and we extend our own previous approaches7–9,18 to develop a conservative strategy for proteogenomic event handling and multi-stage-search false discovery control. We observe that the use of improper false discovery rate (FDR) strategies, such as traditional combined methods, leads to overestimation of novel peptide identifications.7,10 These improper strategies can result in over ~47% of the actual FDR when calculated separately. Our proposed multi-stage-search FDR strategy strictly maintains FDR to the desired rate at the protein level (1%).
In addition to improving the identification of proteogenomic events, we also introduce a novel approach to identify rearranged immunoglobulin genes, a task that has been infeasible in proteogenomic studies to date. Although the role of T-lymphocytes in tumor immunology is well-understood,19,20 recent reports have highlighted the role of B-cells in this context, which also aggregate in tumors. Once there, they form germinal centers, undergo class switching, and differentiate into plasma cells,21 producing multiple antibodies that are part of proteome extracts. However, B-cells remain unexplored because standard databases are unable to represent the highly divergent sequences induced by B-cell differentiation.
We developed a customized RNA-seq antibody database built from mapped RNA-seq reads and partial assemblies using de Bruijn graphs.22–24 These customized databases permit the identifications of tumor antibodies, and they explore their potential role in the molecular characterization of colorectal cancers. We show that over 50% of our novel proteogenomic event identifications derive from immunoglobulin gene database search. This result underscores the importance of our proposed immunoglobulin peptide search when analyzing cancer samples, adding a host immune dimension to our analysis.
The value of proteomic evidence over transcript or genomic evidence has been debated, with recent reports supporting the complementary information available from proteomic data. Our proteogenomic pipeline maintains summary-level information on transcript-derived databases that allows for seamless querying of the relative frequencies of specific variants in DNA/transcript data. By reanalyzing 90 distinct colorectal tumors from the CPTAC project, we have identified twice as many variations as that from the initial CPTAC study5 and also addressed questions regarding frequently occurring somatic mutations in tumor genomes. Software for our tool is available at http://proteomics.ucsd.edu/software-tools/.
METHODS
Figure 1a shows the overall flow of our proteogenomic pipeline, which can largely be divided into the following major steps: NGS data-driven database creation, MS/MS search and FDR control, and postprocessing analysis.
Figure 1.

(a) Diagram of our proteogenomic pipeline. The proposed pipeline used in this method integrates database creation, spectra search, and event-level analysis. (b) Illustration of proteogenomic database construction for immunoglobulin peptide identifications. (c) Diagram illustrating the peptide identifications of V(D)J recombination junctions. We identified clusters of peptides in the immunoglobulin region that connect various V(D)J segments. Examples of immunoglobulin rearrangement peptide identifications plotted in the UCSC genome browser can be found in Figure S11.
In database creation, we generate a unified database from multiple sample RNA-seq data sets encoding all types of expressed junctions and mutations (short-length substitutions, insertions, and deletions).6,7 We can then search the resulting FASTA-formatted database using any existing MS/MS search tool. Next, we identify peptide spectrum matches (PSMs) resulting from MS/MS search results by applying the multistage-search FDR strategy proposed below. Finally, we group identified mutated peptides into proteogenomic events, and we perform postprocessing analysis of cancer-related clinical metadata.
Data Sets
We downloaded MS/MS spectra of adenocarcinoma (COAD) and rectum adenocarcinoma (READ) from the CPTAC data portal,4 for a total of 12 827 616 spectra collected from 90 distinct tumor samples. For genomic data, we acquired RNA-seq data that matched the downloaded CPTAC samples from the TCGA1,2 repository (90 overlapping samples, 151.08 GB of sequence data). In addition, we downloaded MS/MS data sets from normal colon/rectal25 tissue and colon cell lines26 to obtain test controls for our immunoglobulin analysis.
Database Construction
In previous studies,6,7 we developed a RNA-seq data-driven proteogenomic database creation method that can identify novel splice junctions and various mutated peptides, including insertions, deletions, and substitutions. Moreover, by applying the SpliceDB method,7 we were able to identify some peptides resulting from immunoglobulin rearrangements. However, we reasoned that further development would be needed in order to increase the number of identifications of immunoglobulin gene-related peptides. In this study, we introduce a proteogenomic database construction method that aims to identify immunoglobulin (Ig) gene-related peptides. Figure S1 illustrates the different types of database construction methods employed in this study. The following sections illustrate a detailed method of creating an immunoglobulin database (Figure S1c). Note that the database construction method described below contains a novel Ig database approach introduced in this study, and the methodology for SpliceDB (Figure S1a,b) creation can be found in our previous studies.6,7
Database Creation for Immunoglobulin Regions
First, to identify peptides from IgH constant regions, we parsed amino acid sequences that relate to the IgH constant regions from reference DNA and performed a six-frame translation. This curated database serves as an Ig database for peptide identification without any mutations or rearrangements.
In our previous study, we showed that our MutationDB database7 can encode all types of mutations using genomic-level (RNA-seq) mutation calls. However, due to the imprecise junction of V/D and D/J gene segments and the high mutation rates of IgHV gene segments, it is challenging for RNA-seq alignment algorithms to properly align transcripts to the immunoglobulin heavy chain (IgH) locus. Figure S2a shows potentially missed reads from a somatically recombined heavy chain transcript in gray and mapping reads in black. This figure illustrates mapping reads for some parts of the variable (V) gene segment and the constant region, but we need a different approach for the junction region and highly mutated areas of the V gene segment. Therefore, we propose an extended proteogenomic database for identifying peptides from the Ig variable region.
Filtering IgH Locus from TCGA Data
Since the majority of mRNA sequences are from colon tumor cells and we are only interested in identifying variable regions using the extended Ig database, we must first select those reads mapping to the IgH. Any transcript mapping to the IgH locus suggests that it originated from a B-cell, specifically a tumor-infiltrating B-cell (TIB). Therefore, we employ a two-step procedure for selecting RNA-seq reads for the IgH locus. On the first pass, we filter, and retain, any reads that map to the IgH locus. The majority of these reads map to the constant (C) and V gene segments. Additionally, we retain any unmapped reads whose first or last 10 bp map to any of the V, D, J, or 5′ end of C reference gene segments, now called IgH reference gene segments. A second filtering step is performed by checking for at least one 10-mer within the read that matches to any of the IgH reference gene segments. We then perform quality filtering on the selected reads, remove any reads containing an N, filter a mean quality value lower than 25, and perform trimming on the 3′ end of any base pairs containing a quality value below 10. If more than 67% of the read is trimmed, then the entire read is removed. This set of remaining reads is referred to as the putative IgH read set. Although the above filtering is not very stringent, it will eliminate most non-IgH-originating reads. Further pruning is performed in the de Bruijn graph data structure.
Constructing the Repertoire Graph
We are able to construct the de Bruijn graph over the k-mers of these reads in the following manner. Nodes in this graph represent all (k − 1)-mers over the putative IgH read set. Nodes u, v in set V are connected by a directed edge (arc) (u, v) ∈ E if u is a prefix, and v is a suffix of some k-mer in a read. This graph, G = (V, E), is called the repertoire graph, as it is built over the putative IgH read set. Figure S2b is a simple example of the de Bruijn graph built on 6-mers from the two sequences shown, whereas a value of k = 21 is used to construct the repertoire graph. More detailed explanations of de Bruijn graphs for assembly can be found elsewhere.24 The putative IgH read set is assumed to contain only reads originating from the IgH locus. Unfortunately, the repertoire graph on these raw reads can be large due to multiple clones, reads originating from light chain loci, and errors within the reads. We attempt to remove non-IgH transcripts by retaining only the largest connected component when considering the repertoire graph as an undirected graph. This operation removes small, unconnected graphs likely arising from spurious matching to l-mers in the filtering step.
We further attempt to mitigate any sequencing errors by performing tip clipping and bulge removal, similar to what is performed in the literature. For transcript assembly, pruning on a uniform level of coverage can be detrimental to rescuing lower-abundance transcripts. We use a proportional approach, similar to the one employed by Trinity27 and IDBA-tran,28 first and then also use a small uniform coverage threshold.
Once a single, large, pruned, connected component has been isolated, the graph is converted into a splice graph format for use as a database to search for spectra using the existing pipeline. PSMs from this database search are then mapped back onto the repertoire graph. These PSMs are represented as subpaths within the repertoire graph. Furthermore, reference V and J gene segments are added to the graph to aid in identification of these variable gene segments. Reference V and J gene segments are added to the graph, noting the arc to which each one is assigned. These shared arcs can be used to determine from where reads/peptides originate, but, in this case, they are used only as a rough guide of V or J gene segment usage.
Search Parameters
We used GATK29,30 (version 2.5-2) tool for variant calling analysis with parameters “-stand_call_conf 30.0 -stand_emit_conf 10.0”. For MS/MS search, MSGF+31,32 (version 20130403) was used with the following parameters: parent mass tolerance of 20 ppm, fixed carbamidomethyl C, and optional oxidized methionine. Reversed sequence decoy databases were generated as the same size of each target proteogenomic database. MS/MS search results were merged together according to the best SpecProb score (output by MSGF+31,32) per spectrum match. Using 100 CPU nodes of the cluster server in parallel, the total search took 486 wall clock hours.
MS/MS Search and FDR Calculation
A target-decoy-based FDR strategy is commonly deployed to control the FDR of peptide identifications. The traditional approach to FDR calculation33 creates a single, combined target database and a similar-sized reversed (or permuted) decoy database to estimate the FDR. However, when this traditional approach is applied to proteogenomic searches, it may lead to a possible overestimation of FDR measurements in novel identifications.7,10
To understand the behavior of FDR controls on databases of different sizes, consider a database of a specific size and a richness parameter α, where the richness corresponds to the fraction of PSMs that are correctly mapped to the peptide. Thus, the value of α is high for known proteins, but it is low for many of the variant encoding databases. Let C, I, T, and D be randomly chosen peptides spectrum match scores from correct, incorrect, target-database, and decoy-database PSMs, respectively. These random variables are distributed according to fC, fI, fT, and fD, respectively. Furthermore, let denote the cumulative tail probability. To control the FDR, we would like to identify the minimum threshold τ such that
| (1) |
where 0.01 is the desired FDR. We assume that fD(x) = fI(x) for all x and note that
| (2) |
By integrating and substituting, the goal is to find a minimum threshold τ such that
| (3) |
The denominator of the known protein database is larger than that of the proteogenomic DB, and vice versa for the numerator. Therefore, if the proteogenomic DB has larger size and smaller α, then the FDR of the known protein DB will be smaller than the FDR of the proteogenomic DB, so the same cutoff cannot be applied to the two databases (see Supporting Information Methods and Figure S3).
Although it is challenging to theoretically obtain the value of α introduced above, we can estimate α according to the number of peptide identifications obtained separately from each database. Figure S4 shows the estimated value of α calculated by dividing the number of unique peptide identifications to each database search space.
In large-scale proteogenomic studies, where databases are generated from multiple sources, we can expect that the resulting databases will have different characteristics. Figure S5 shows the decoy score distribution in different databases and reveals a clear discrimination, indicating that different FDR thresholds must be applied in each database.7,10
To solve this problem, we employ a conservative, multistage-search FDR strategy with a 1% FDR cutoff at each stage. We searched the databases in a specific order starting with a known protein database first, followed by Ig Database, MutationDB, SpliceDB, and six-frame, in order. Spectra that passed the FDR threshold in an earlier database were not considered for subsequent searches (see Supporting Information Methods). The consecutive order of proteogenomic database searches was chosen according to the estimation of richness shown in Figure S4.
Figure S6 shows a comparison of the two strategies, where the combined strategy results in more identifications, but it does so with a higher FDR(47.44%) for the novel (variant) peptides.
Novel Peptide Identification to Proteogenomic Events
The final step of our pipeline is to assign proteogenomic events to our novel peptide identifications and perform postprocessing analysis using various cancer-related metadata information. Here, we define a proteogenomic event as a set of reading frame compatible novel peptide identifications that explain a certain type of novel (i.e., mutation) discovery. The following paragraphs illustrate the procedure of event-level classification and grouping methods.
Classification of Novel Peptides
After we obtain original genomic locations restored for each peptide identification7 (see Supporting Information Methods), we perform an initial classification of each novel peptide identification to a proteogenomic event (see Table S1). To determine the rough category of an identified peptide, we iterate through the information from RefSeq34 gene lists (in GFF format, which contains information on known gene names, CDS regions, UTR regions, and junction coordinates) in order to search for overlapping known gene regions against each identified novel peptide. In this study, we indicate transcript genes as the set of genes listed without a CDS region and pseudo genes as the set of genes that are marked as pseudo genes within the RefSeq GFF file.
In order to assign classes of events to each novel peptide, we sort all the RefSeq genes according to the beginning coordinate of each gene region. Then, for each novel peptide, we iterate through the sorted RefSeq gene lists to parse out all overlapping isotopic forms of transcripts listed in the RefSeq GFF file. Next, we assign a certain class of event to each novel peptide using information from parsed overlapping gene lists. Figure S7 describes the flowchart of event classification, and Figure S8 illustrates the criteria to remove ambiguities between novel events; more details can be found in the Supporting Information Methods.
Grouping Novel Peptides into Proteogenomic Events
In large-scale proteogenomic analysis, we observe multiple novel peptide identifications within an adjacent region that support an identical proteogenomic finding (i.e., splice junctions or mutations). In this case, we group those novel peptides together and assign them to a single proteogenomic event (see Figure S9 and Table S2). In this stage, novel peptides that can be mapped to more than three genomic locations are filtered out, and peptides having multiple (two or three) possible locations are used as a member of proteogenomic event group that serves only as supporting evidence for uniquely mapped novel peptides. Specific rules and details of this grouping procedure are illustrated in the Supporting Information Methods.
Comprehensive Cancer-Related Analysis Utilizing Various Information
Finally, in order to deliver a comprehensive cancer-related analysis, we utilize all types of available metadata information obtained from cancer samples. In this step, we utilize TCGA3 barcode id and read depth of junctions/mutations (the method for efficient retrieval of sample-specific metadata is described in our previous study7). We used external genomic-level mutation/variant databases, such as dbSNP,35 COSMIC,36 and lists of mutation reports from the TCGA colon cancer study,3 to provide supportive evidence from the literature. Full-list TCGA3 somatic mutation reports were used to distinguish somatic versus germline mutations of our peptide-level mutation identifications (TCGA reported variant calls from 243 colon cancer samples, of which 224 had normal/blood paired samples available, whereas the CPTAC4 colon cancer study had no matched normal protein samples available).
RESULTS
Proteogenomic Database Creation for Splice Junction and Mutation Search
We used RNA-seq data from the TCGA1,2 repository (90 overlapping samples, 151.08 GB of sequence data) to create specialized splice junction databases. We separated junction variants and mutational variants into separate databases. In the case of junction variants, we used mapped reads to identify recurrent junctions and mutations, and we developed specialized FASTA-formatted databases encoding all coding region and junction information, while we ignored mutational data to create a compact database (1.43 GB) encoding 1 245 069 novel splice junctions and 85.29% of all known splicing events. In the case of mutational variants, we used single nucleotide variant (SNV) and short substitution/insertion/deletion information from the RNA-seq alignments (from TCGA project), encoded in VCF files, to construct a 1.14 GB MutationDB FASTA database encoding putative variant peptides. The compact databases, critical to maintaining a low FDR, can be attributed to (a) building a splice graph to encode junctions in a nonredundant fashion and (b) creating a specialized FASTA database derived from the splice graph to enable efficient database search (see Supporting Information Methods and our previous approaches6,7).
Extended Proteogenomic Database for Immunoglobulin Peptide Search
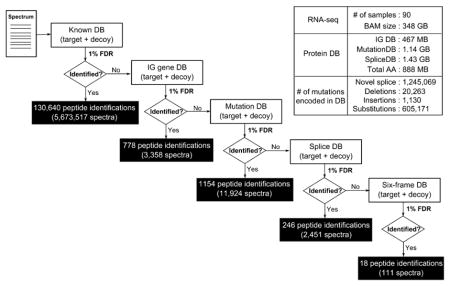
Database construction for immunoglobulin genes is more challenging, as the antibodies are the result of genomic recombination, splicing, and nontemplated DNA insertion, making it difficult to map them to the standard reference sequence. As illustrated in the Methods (Figure 1b), we developed a customized proteogenomic database targeted to Ig gene peptide identifications. The specialized Ig gene database derived from the larger corpus of 150 Gbp RNA-seq reads was only 467 Mbp. Figure 2 contains the overall statistics of the database’s size and the number of genomic variations encoded in our final proteogenomic database. The complete search also used a database of known proteins from Ensembl37 (version GRCh37.70).
Figure 2.

Multi-stage-search FDR strategy. Every spectrum will be searched against the known peptide database first, and the results are reported as known peptides. In the following stages, only the unidentified portion of the spectra is searched and assigned a new FDR threshold. A similar procedure is applied in the following order: Immunoglobulin DB → Mutation DB → Splice DB → Six-frame DB. Calcluated FDR thresholds (MSGF+ SpecEValue) in each stage are as follows: 3.2807645 × 10⁻⁹ (Known DB), 9.221085 × 10⁻¹² (Ig DB), 5.2870187 × 10⁻¹³ (Mutation DB), 5.707075 × 10⁻¹⁴ (Splice DB), 4.360826 × 10⁻¹⁹ (Six-frame DB).
MS/MS Search Results
We searched the 12 827 616 adenocarcinoma (COAD) and rectum adenocarcinoma (READ) tumor MS/MS spectra against the known protein and specialized proteogenomic database using MSGF+.31,32
This multistage search resulted in 130 640 known peptide identifications (5 673 517 PSMs) and 2196 novel peptides in total (17 844 PSMs) at a 1% PSM-level multi-stage-search FDR cutoff. A detailed distribution of novel peptide identifications in each stage can be found in Figure 2.
Comparisons with Different MS/MS Database Search Approaches
We benchmarked our search against previous searches of the same MS data, including Zhang et al.,5 who used their own databases (CanProVar), and against a second search tool using Comet38 on our specialized databases as a control. The Comet results showed 357 novel peptide identifications, whereas over 70% of the peptide overlapped with MSGF+31,32 results (Figure S10). In generating novel events reported in this article, we used only the results from MSGF+,31,32 excluding the additional 104 peptides gained from the Comet search. In general, our tools are nonbiased to the choice of a specific search tool.
When comparing against CanProVar results (Figure 3), we note that, in both the multistage search and combined search, we predicted an excess of junction peptides and Ig peptides. These peptides were ignored by previous approaches due to the challenge in identifying them. The number of mutations was comparable in both studies, with 276 overlapping mutations. Among the mutated peptides predicted by CanProVar alone, 290 were not represented in our database, as their databases included public sources encoding variation,3,35,36 whereas our customized databases were created directly from matching sample RNA-seq data sets. The remaining missed identifications were mainly due to FDR controls (211 of 230) and could have been discovered via the combined FDR search, although this would have come at the cost of a higher FDR (Figure 3b).
Figure 3.

(a) Comparison of novel peptide identifications against previous findings using multi-stage-search FDR (b) Comparison of overlapping novel peptide identifications using combined FDR. Our proteogenomic database was created from raw RNA-seq alignments from the TCGA repository, and the database used in Zhang et al.5 was created from SNV information reported by dbSNP,35 COSMIC,36 and TCGA somatic mutation calls.3
Peptide Identifications to Proteogenomic Events
We grouped novel variations by location and automatically classified them into distinct events. Peptides mapping to two locations were used only to support other events, ensuring that each event had at least one uniquely mapping peptide. Table 1 describes the breakdown of 1884 distinct events based on 2367 novel peptide identifications as well as Ig peptides (using multistage-search FDR). Proteognomic events generated from the combined FDR strategy can be found in Table S3.
Table 1.
Characterization of Novel Peptide Eventsa
| type of novel findings | no. of novel findings |
|---|---|
| somatic substitution | 105 |
| germline substitution | 314 |
| uncategorized substitution | 221 |
| somatic insertion | 1 |
| uncategorized insertion | 3 |
| deletion | 4 |
| transcript gene | 10 |
| fusion gene | 7 |
| translated-UTR | 17 |
| alternative splice | 11 |
| novel splice | 90 |
| exon boundary | 6 |
| frame shift | 4 |
| novel exon | 2 |
| novel gene | 4 |
| reverse strand | 1 |
| pseudo gene | 16 |
| Ig gene variable region | 899 |
Sixty one out of 90 had blood (normal) samples available as a matched reference. Using DNA-level normal sample mutation calls, we were able to distinguish 105 somatic and 314 germline mutations among 640 substitutions (221 substitutions remained uncategorized due to the absence of either normal reference samples or overlapping report from dbSNP). Transcript genes include translations of non-coding RNAs, and novel genes indicate translated peptides in originally untranslated regions.
Comparisons in Protein- and Genome-Level Mutation Analysis
Initial comparisons between the expression and occurrence of variant peptides suggested that there were significant differences.5 As we did not have matched proteomic data from normal samples, we used an earlier study from TCGA3 to call somatic variations. The TCGA study paired 224 of 243 tumor samples with matched blood samples, whereas the MS data had 90 samples that overlapped with TCGA and 61 that had matched blood. We identified 105 SNV mutations and one insertion that were called somatic in the TCGA study, and we compared their occurrence versus genomic mutations.
Figure 4a shows the top 30 most frequently mutated genes reported by the TCGA study.3 However, these genes have extremely low protein expression (as measured by spectral counts) even for nonmutated peptides (Figure 4b). In contrast, the most frequently occurring proteins with somatic mutations show very different gene lists (Figure 4c), but the list identifies many genes of interest. Genes such as TNC,39 HSPG2,40 PML,41 GBP-1,42 TF,43 and NES44 have all been implicated in colorectal tumor angiogenesis.
Figure 4.

(a) Genes containing the most frequent somatic mutations reported by the TCGA study. (b) RefSeq identified spectra per gene in log10 scale. The most frequently mutated genes at the DNA level are underexpressed at the protein level. COL6A3 had 35 463 spectra counts; TTN, 188; KRAS, 71; DMD, 76; SYNE1, 43; LRP1B, 37; ANK2, 59; and rest of the DNA-level highly mutated genes had less than 25 spectra counts. (c) Percentage of samples containing identified somatic mutations in the topmost frequently mutated genes at the protein level. Note that this plot refers to mutations classified as somatic in genomic analysis and recurrently discovered in tumor proteomes. While most of the DNA-level top frequently mutated genes were underexpressed at the protein level, we observed that some genes showed even higher mutation frequencies across samples at the protein level.
Identifying Mutated Peptides for Follow-Up
The TCGA transcript analysis largely identified somatic mutations with low occurrence, except for a few key genes. Moreover, the frequently occurring mutated genes (e.g., APC) are tumor suppressors and exhibited reduced protein expression; mutations are, therefore, not seen in the proteome. Thus, we focused here on identifying nonsynonymous SNV mutations (single amino acid variants) and other events that were not highly occurring but that together could be part of targeted proteomic studies characterizing colorectal cancer subtypes.
Our study revealed 640 identified substitutions, of which 105 SNV mutations overlapped with the TCGA reported somatic mutations in colon cancer samples and 424 SNV mutations are reported in dbSNP.
Exemplars of Somatic SNV Mutations
The tumor suppressor SMAD4 mediates the TGFbeta signaling pathway, suppressing epithelial cell growth, and inactivation of the Smad4 gene through an intragenic mutation occurs frequently in association with malignant progression.49,50 We identified a single PSM, VPSSCPIVTVDGYVDPSGGD:H:FCLGQLSNVHR (R361H, Figure 5a), supporting a known mutation in colorectal cancer,36 that appeared with low frequency in the transcript data (7 of 243 TCGA samples).
Figure 5.

(a) Identification of somatic mutation in the SMAD4 gene. This mutation had 1 spectra count with unique genomic location and 15 RNA-seq read depth. This mutation is also reported as a somatic mutation in 7 different samples from the TCGA colon cancer study,3 and an overlapping mutation existed in COSMIC36 database. (b) Identification of somatic mutation in the KRAS gene. TCGA colon cancer study3 reported this mutation as somatic in 25 different colon cancer samples, and it was also reported by COSMIC36 and dbSNP.35 Peptide LVVVGAG:D:VGK (G → D) had 1 spctra count and a unique genomic location. (c) Identification of somatic mutation in the pIgR gene. Total spectra count of both peptides was 137, and the RNA-seq read depth of this mutation was 11 005. We found these two mutated peptides in a single protein sample that was categorized as subtype C (subtype with high-Ig peptide identification rate). Matching mutation of this region was found in both COSMIC36 and dbSNP.35
The wild-type KRAS gene is required for anti-EGFR drug efficacy in metastatic colorectal cancer.51 We identified a known, low-frequency mutated peptide, LVVVGAG:D:VGK (G12D, Figure 5b), in 4 of 90 proteome samples, matching the low transcript frequency (25 of 243 transcript samples).
Expression of the polymeric immunoglobulin receptor (pIgR), a transporter of polymeric IgA and IgM, is commonly increased in response to viral or bacterial infections, linking innate and adaptive immunity. Abnormal expression of pIgR in cancer was also observed.52 We identified a mutation (Figure 5c) with strong overlapping peptide identification. We also identified overlapping peptides in the FGA gene, which has been proposed to be a marker for other cancers.53
Alternative Splice Junctions
We categorized identified splice junctions as novel when both splice sites do not overlap with any known splice junctions; we characterized junctions as alternative junctions if at least one splice site is shared with a known junction. We identified 97 novel splice junctions and 11 alternative splice junctions. Figure 6a shows an example of the alternative splice junction peptide VKEENPE:G:PPNANEDYR in STK39 (a cellular stress response pathway gene54) along with its spectral alignment.
Figure 6.

(a) Identified alternative splice junction peptide. Peptide VKEENPE:G:PPNANEDYR (junction existing in the middle of amino acid G) had 11 spectra counts (with unique genomic location), and a total 386 RNA-seq reads were mapped to this alternative splice junction. (b) Identified deletion and two neighboring SNP mutated peptides. This peptide with the deletion had 7 spectra counts (across 6 different tumor protein samples) with unique genomic location and 996 RNA-seq read depth (across 10 different tumor DNA samples). (c) Two additional SNV mutations within the exon of the above deletion example. All mutations had external supporting evidence from dbSNP. SNV mutation of the peptide K.NLPSLA:E:QGASDPPTVASR.L (K → E) was also reported by TCGA3 colon cancer somatic mutation calls, with a read depth of 10 711. (d) Identified fusion gene peptides. This shows a possible gene fusion region where two junctional peptides are identified accross two different genes (HBA1 and HBA2). Two fusion peptides shown in this region had unique genomic locations and a total of 15 spectra counts. HBA1 and HBA2 are hemoglobin-related genes.
Deletions
Figure 6b shows an example of a mutated peptide identified with the presence of a deletion (from four deleted peptides in total) in the Ladinin-1 gene across six samples. As shown in Figure 6c, a related SNV mutation of the peptide K.NLPSLA:E:QGASDPPTVASR.L (K → E) was also reported by TCGA3 colon cancer somatic mutation calls with a read depth equal to 10 711.
Fusion Genes
Figure 6d shows a possible gene fusion region (selected from eight possible gene fusion peptide identifications) where we identified two junctional peptides across two different genes (HBA1 and HBA2). Two fusion peptides shown in this region had unique genomic locations and a total of 15 spectra counts from two protein samples. These hemoglobin-related genes act as antioxidants, attenuating oxidative stress-induced damage in cervical cancer cells.55
Peptide Identifications from Immunoglobulin Rearrangements
Our search also resulted in a large number of Ig peptides, including 439 peptides (58 778 PSMs) mapping to the Ig constant region and 1094 peptides (8701 PSMs) mapping to the Ig variable region. Figure 1c shows a diagram of peptides supporting specific V(D)J recombination (actual examples plotted in the UCSC genome browser can be found in Figure S11). The complexity of these peptides suggests that there could be bias in their discovery patterns. To test for bias, we compared the Ig peptide spectral counts to RNA-seq read counts, and we observed a strong correlation (Figure S12a). The high correlation extended to spectral counts between heavy and constant regions in each sample (Figure S12a; ρ = 0.77). Finally, although there is variation in the location of Ig constant region peptides, all regions with tryptic digestion sites are well-sampled (Figure S12c). As there is no specific bias, we used the data to investigate Ig peptide concentrations within cancer subtypes. As mature antibodies are expressed only in differentiated lymphocytes, the excess of Ig peptides is indicative of an immune response mediated by B-lymphocyte infiltration into the tumor. Although the role of T-lymphocytes in tumor immunology is well-understood,19 the role of B-cells is still being elucidated, although some reports suggest that B-cells aggregate in tumors,45,46 where they form germinal centers, undergo class switching, and differentiate into plasma cells.20,21
Distribution of Ig Peptides Across Colorectal Subtypes
The CPTAC study classified the 90 samples into five subtypes, marked A–E,5 based on expression patterns. Figure 7 shows the plot of Ig gene peptide spectra counts (normalized by the total number of known spectrum identifications in each group) between each sample subtype. In addition, we used the MS/MS data sets from normal colon/rectal25 tissue in addition to colon cell lines26 as controls. We observed that Ig peptide identification rates in all subtypes were similar to the normal sample compared to the majority of cancer samples (except for samples within group C), whereas the cell line sample showed a markedly lower number of Ig peptide identifications. The one exception was the significant overexpression of Ig peptides in subtype C (p < 0.0001, χ2 = 2927.71), comprising samples that are hypermutated, with high microsatellite instability (MSI). Moreover, samples in subtype C also show substantial overlap with both the stem-like and colon cancer subtype3 groups defined by Sadanandam et al.47 and De Sousa E Melo et al.48 Our results suggest that a strong immune response could be a molecular marker of CRC subtypes.
Figure 7.

Percentage of Ig gene peptide identifications in each sample normalized by the number of known peptide identifications across sample subtypes. This percentile ratio is calculated by dividing the number of known peptide identifications from the total number of Ig peptide identifications within each sample. (ratio = (no. of Ig peptides)/(no. of known peptides) × 100). Different kinds of Ig gene segments are colored. Subtype C (sample groups showing both hypermutation and CIMP characteristics) showed a high number of Ig gene peptide identifications compared to that of other sample subtypes. Chi-squared test of this plot showed p < 0.0001, χ2 = 2927.71.
We also tested the distribution of somatic mutations across sample subtypes (Figure S.13) and observed a slightly higher frequency of somatic mutation identifications in subtype B (p <0.0001, χ2 = 40.39). In the initial TCGA3 and CPTAC5 colon cancer study, samples in both the B and C subtypes are reported as hypermutated, whereas group C is characterized as showing both MSI-high and hypermutated samples. Our results support this partitioning based on differential distribution of variant peptides in the two subtypes.
DISCUSSION AND CONCLUSIONS
We have presented a systematic pipeline for identifying mutated peptides in cancers, focusing on many challenging issues such as a compact, integrated transcript-derived database for searching, FDR controls, and event calling. In addition, we have also developed customized databases to search for Ig peptides, allowing us to quantify the antibody-mediated response to cancer.
Our results follow other results in suggesting a significant gap between genomic- and protein-level mutation identifications, mediated by the fact that frequently occurring mutations in transcripts may not be observed in the proteome due to reduced protein expression of the mutated gene. Thus, the development of protein-based biomarkers must be prefaced by proteome-related studies. The mutations observed during transcription and translation have different characteristics. However, a pipeline such as ours, which searches a comprehensive database of transcript-derived mutations against spectra, allows for a joint exploration of the proteogenomic space.
The notion of a novel peptide in this study refers to peptides that do not appear in the known database, which is Ensembl37 in our analysis. The fact that it is not present in a major database suggests that it is truly novel or that its appearance is not sufficiently robust to be considered unambiguous. We used Ensembl as a conservative measure for addressing novelty since it also contains large portion of previously known genomic differences.
Our results also show that only 18 novel peptides were identified from the six-frame translation database. This finding indicates that the usage of multiple sample-unified RNA-seq databases is robust enough to cover most of the potential novel peptide identifications, which significantly reduces the importance of a traditional six-frame DB.
While we suggested the use of multi-stage-search FDR as a valid FDR strategy in proteogenomic studies, we reason that further improvements are possible. The order of the searched databases was decided by a heuristic based on perceived richness and the size of the databases. As a crude measure of the effect of possible interference introduced by our sequential FDR strategy, we performed an additional experiment by changing the order of database search from Known Protein → Ig DB → MutationDB → SpliceDB → six-frame to Known Protein → SpliceDB → MutationDB → Ig DB → six-frame. This change resulted in a 0.5% decrease in the number of novel peptide identifications with 99.9% overlap compared to the original results. This suggests that the possible interference between different search spaces seems to be minimal at this stage, but more experiments will be required to understand the dependence.
In this study, we focused on a PTM-restricted database search, allowing only for fixed carbamidomethyl C and optional oxidized methionine. Therefore, there is an unexplored possibility that the novel peptides identified might have an alternative explanation as PTMs of known peptides. In this study, we have taken steps to reduce this possibility by grouping compatible novel peptides into events and using clustered identifications as strong supporting evidence. However, the integration of PTM searches should be done carefully in subsequent studies since it leads to an increase in the size of the search space, increasing the possibility of false-positive identifications.
We used the recently published data from a study of normal colorectal samples, mainly as test controls to the cancer subtype analysis. Separately, we have provided the proteogeonomic results on this data set in Table S4. However, we refrained from making a direct comparison with the study of Kim et al.25 They used different set of search tools with a different FDR strategy and worked toward experimental validation of their novel findings using synthetic peptides. Moreover, they focused on the analysis of diverse normal tissues rather than tumors, whereas our study looked for mutated peptides in tumors.
In this study, only 61 out of 91 TCGA samples had normal (blood) genomic data available. Moreover, the proteomic data did not have matched normal control samples. Due to the insufficient data for somatic mutation labeling, we applied a more relaxed criterion: labeling a mutation as somatic if it had previously been identified as somatic in TCGA analysis from any sample. This certainly leads to an overestimate of the number of somatic changes in an individual, but it is helpful in identifying peptides that are important for tumor growth. As proteomic data collection of matched tumor and control samples from each individual become more common, we will refine our analysis to identify truly somatic mutations in each individual.
The significant number of peptide identifications in immunoglobulin regions points to active immunoglobulin responses within certain subtypes of cancers and provides a new direction toward molecular subtyping of cancers. Implicitly, our results can also lead to an analysis of antibody subtype switching as well as to the prediction of the host response to infections. These avenues will be fully investigated in future studies. Finally, our proteogenomic analysis leads to the identification of a number of novel peptide identifications that will serve as candidates for targeted studies of tumor subtyping and tumor progression.
Supplementary Material
Acknowledgments
V.B., P.A.P., S.W., S.C., S.B., and N.S. were supported by a grant from the NIH (5 P41 GM103484-07). D.T. was supported by NIH U24 CA159988. The authors would like to acknowledge Sangwoo Kim for discussions on utilizing cancer-related mutations and genomic information. Phillip Compeau and Edward Siegel, M.D., proofread the manuscript.
Footnotes
Author Contributions
S.W. designed, coordinated the overall workflow development, performed proteogenomic searches, and wrote the manuscript. S.W.C. implemented algorithms and modules applied throughout the pipeline and performed postprocessing analysis. S.B. implemented extended immunoglobulin peptide database and contributed in Ig gene analysis. S.N. supported on useful discussions for selecting accurate FDR control. D.T. provided Comet database search results. V.B. and P.A.P. supervised the design and implementations and helped to write the manuscript. V.B. is a partner in Digital Proteomics, LLC (DP) which licenses and sells MS related software. DP was not involved in any aspect of this research.
Notes
The authors declare the following competing financial interest(s): V.B. and P.A.P. hold equity position in Digital Proteomics, LLC, a company that licenses and sells UCSD software for proteomic analysis. The terms of this arrangement have been reviewed and approved by the University of California, San Diego, in accordance with its conflict of interest policies.
Detailed method description. Spectra alignment figures. Figure S1: Illustration of three different types of database structure used in this study. Figure S2: Potentially missed (in RNA-seq read alignment) reads from a somatically recombined heavy chain transcript and example de Bruijn graph showing how differences in sequence manifest as differences in topology. Figure S3: PSM score distribution and FDR threshold. Figure S4: Richness estimated from the number of peptide identification results obtained by applying the FDR calculation in each database separately. Figure S5: Decoy score distribution of different proteogenomic databases. Figure S6: Parsed PSMs from known target and known decoy versus novel target and novel decoy database from the concatenated PSM list. Figure S7: Flowchart of event classification. Figure S8: Classification priority example. Figure S9: Proteogenomic event level grouping of novel peptides. Figure S10: Comparison between results obtained using MSGF+ and Comet MS/MS search tools. Figure S11: Examples of immunoglobulin rearrangement peptide identifications plotted in UCSC genome browser. Figure S12: RNA-seq read counts from Ig variable region versus Ig constant region, spectra counts of peptide identifications from Ig constant versus variable region, and plot of spectra counts covering IgG constant region. Figure S13: Percentage of peptide identifications with somatic mutations in each sample normalized by the number of known peptide identifications across sample subtypes. Table S1: Applied categorical definitions in assigning novel peptide identifications into proteogenomic events. Table S2: Novel peptide grouping rules applied to different type of events. Table S3: Statistics of identified novel events using combined FDR 1% cutoff. Table S4: Statistics of identified novel events in normal colon/rectal data using multi-stagesearch FDR 1% cutoff. CPTAC_Colon_-Proteogenomic_Events.xlsx: List of reported proteogenomic events. Columns are self-explanatory as in the caption. Mutations in peptides are marked with ‘:’, where the colon follows the mutation position in case of forward strand peptide translations. In the case of reverse strand peptide translations, the mutation position is followed by the colon. Multiple mutations within a peptide are represented as multiple colons. CPTAC_Colon_Ig_DB_novel_peptide_PSM_result.tsv: PSM results from Ig DB. CPTAC_Colon_Mutation_DB_novel_peptide_PSM_result.tsv: PSM results from Mutation DB. CPTAC_Colon_Splice_DB_novel_-peptide_PSM_result.tsv: PSM results from Splice DB. CPTAC_Colon_Sixframe_DB_-novel_peptide_PSM_result.tsv: PSM results from Sixframe DB. The Supporting Information is available free of charge on the ACS Publications website at DOI: 10.1021/acs.jproteome.5b00264.
References
- 1.Koboldt DC, Fulton RS, McLellan MD, Schmidt H, et al. Comprehensive molecular portraits of human breast tumours. Nature. 2012;490:61–70. doi: 10.1038/nature11412. [DOI] [PMC free article] [PubMed] [Google Scholar]
- 2.Bell D, Berchuck A, Birrer M, Chien J, et al. Integrated genomic analyses of ovarian carcinoma. Nature. 2011;474:609–615. doi: 10.1038/nature10166. [DOI] [PMC free article] [PubMed] [Google Scholar]
- 3.Muzny DM, et al. Comprehensive molecular characterization of human colon and rectal cancer. Nature. 2012;487:330–337. doi: 10.1038/nature11252. [DOI] [PMC free article] [PubMed] [Google Scholar]
- 4.Clinical Proteomic Tumor Analysis Consortium. http://proteomics.cancer.gov.
- 5.Zhang B, et al. Proteogenomic characterization of human colon and rectal cancer. Nature. 2014;513:382–387. doi: 10.1038/nature13438. [DOI] [PMC free article] [PubMed] [Google Scholar]
- 6.Woo S, Cha SW, Merrihew G, He Y, et al. Proteogenomic database construction driven from large scale RNA-seq data. J Proteome Res. 2014;13:21–28. doi: 10.1021/pr400294c. [DOI] [PMC free article] [PubMed] [Google Scholar]
- 7.Woo S, Cha SW, et al. Proteogenomic strategies for identification of aberrant cancer peptides using large-scale Next Generation Sequencing data. Proteomics. 2014;14:2719–2730. doi: 10.1002/pmic.201400206. [DOI] [PMC free article] [PubMed] [Google Scholar]
- 8.Castellana NE, Shen Z, He Y, Walley JW, et al. An automated proteogenomic method uses mass spectrometry to reveal novel genes in Zea mays. Mol Cell Proteomics. 2014;13:157–167. doi: 10.1074/mcp.M113.031260. [DOI] [PMC free article] [PubMed] [Google Scholar]
- 9.Castellana N, Bafna V. Proteogenomics to discover the full coding content of genomes: a computational perspective. J Proteomics. 2010;73:2124–2135. doi: 10.1016/j.jprot.2010.06.007. [DOI] [PMC free article] [PubMed] [Google Scholar]
- 10.Nesvizhskii AI. Proteogenomics: concepts, applications and computational strategies. Nat Methods. 2014;11:1114–1125. doi: 10.1038/nmeth.3144. [DOI] [PMC free article] [PubMed] [Google Scholar]
- 11.Branca RM, Orre LM, Johansson HJ, Granholm V, Huss M, Perez-Bercoff A, Forshed J, Kall L, Lehtio J. HiRIEF LC-MS enables deep proteome coverage and unbiased proteogenomics. Nat Methods. 2013;11:59–62. doi: 10.1038/nmeth.2732. [DOI] [PubMed] [Google Scholar]
- 12.Uszkoreit J, Plohnke N, Rexroth S, Marcus K, Eisenacher M. The bacterial proteogenomic pipeline. BMC Genomics. 2014;15:S19. doi: 10.1186/1471-2164-15-S9-S19. [DOI] [PMC free article] [PubMed] [Google Scholar]
- 13.Li J, Duncan DT, Zhang B. CanProVar: a human cancer proteome variation database. Hum Mutat. 2010;31:219–228. doi: 10.1002/humu.21176. [DOI] [PMC free article] [PubMed] [Google Scholar]
- 14.Li J, Su Z, Ma ZQ, Slebos RJ, et al. A bioinformatics workflow for variant peptide detection in shotgun proteomics. Mol Cell Proteomics. 2011;10:M110.006536. doi: 10.1074/mcp.M110.006536. [DOI] [PMC free article] [PubMed] [Google Scholar]
- 15.Wang X, Slebos RJ, Wang D, Halvey PJ, et al. Protein identification using customized protein sequence databases derived from RNA-Seq data. J Proteome Res. 2012;11:1009–1017. doi: 10.1021/pr200766z. [DOI] [PMC free article] [PubMed] [Google Scholar]
- 16.Wang X, Zhang B. customProDB: an R package to generate customized protein databases from RNA-Seq data for proteomics search. Bioinformatics. 2013;29:3235–3237. doi: 10.1093/bioinformatics/btt543. [DOI] [PMC free article] [PubMed] [Google Scholar]
- 17.Fearon ER. Molecular genetics of colorectal cancer. Annu Rev Pathol: Mech Dis. 2011;6:479–507. doi: 10.1146/annurev-pathol-011110-130235. [DOI] [PubMed] [Google Scholar]
- 18.Castellana NE, Payne SH, Shen Z, Stanke M, et al. Discovery and revision of Arabidopsis genes by proteogenomics. Proc Natl Acad Sci U S A. 2008;105:21034–21038. doi: 10.1073/pnas.0811066106. [DOI] [PMC free article] [PubMed] [Google Scholar]
- 19.Nzula S, Going JJ, Stott DI. Antigen-driven clonal proliferation, somatic hypermutation, and selection of B lymphocytes infiltrating human ductal breast carcinomas. Cancer Res. 2003;63:3275–3280. [PubMed] [Google Scholar]
- 20.Nelson BH. CD20+ B cells: the other tumor-infiltrating lymphocytes. J Immunol. 2010;185:4977–4982. doi: 10.4049/jimmunol.1001323. [DOI] [PubMed] [Google Scholar]
- 21.Ogino S, Nosho K, Irahara N, Meyerhardt JA, Baba Y, Shima K, Glickman JN, Ferrone CR, Mino-Kenudson M, Tanaka N, Dranoff G, Giovannucci EL, Fuchs CS. Lymphocytic reaction to colorectal cancer is associated with longer survival, independent of lymph node count, microsatellite instability, and CpG island methylator phenotype. Clin Cancer Res. 2009;15:6412–6420. doi: 10.1158/1078-0432.CCR-09-1438. [DOI] [PMC free article] [PubMed] [Google Scholar]
- 22.Pevzner PA, Tang H, Waterman MS. An Eulerian path approach to DNA fragment assembly. Proc Natl Acad Sci U S A. 2001;98:9748–9753. doi: 10.1073/pnas.171285098. [DOI] [PMC free article] [PubMed] [Google Scholar]
- 23.Zerbino DR, Birney E. Velvet: algorithms for de novo short read assembly using de Bruijn graphs. Genome Res. 2008;18:821–829. doi: 10.1101/gr.074492.107. [DOI] [PMC free article] [PubMed] [Google Scholar]
- 24.Compeau PE, Pevzner PA, Tesler G. How to apply de Bruijn graphs to genome assembly. Nat Biotechnol. 2011;29:987–991. doi: 10.1038/nbt.2023. [DOI] [PMC free article] [PubMed] [Google Scholar]
- 25.Kim MS, et al. A draft map of the human proteome. Nature. 2014;509:575–581. doi: 10.1038/nature13302. [DOI] [PMC free article] [PubMed] [Google Scholar]
- 26.Fanayan S, Smith JT, Lee LY, Yan F, Snyder M, Hancock WS, Nice E. Proteogenomic analysis of human colon carcinoma cell lines LIM1215, LIM1899, and LIM2405. J Proteome Res. 2013;12:1732–1742. doi: 10.1021/pr3010869. [DOI] [PubMed] [Google Scholar]
- 27.Grabherr MG, Haas BJ, Yassour M, Levin JZ, Thompson DA, Amit I, Adiconis X, Fan L, Raychowdhury R, Zeng Q, et al. Full-length transcriptome assembly from RNA-Seq data without a reference genome. Nat Biotechnol. 2011;29:644–652. doi: 10.1038/nbt.1883. [DOI] [PMC free article] [PubMed] [Google Scholar]
- 28.Peng Y, Leung HC, Yiu SM, Lv MJ, Zhu XG, Chin FY. IDBA-tran: a more robust de novo de Bruijn graph assembler for transcriptomes with uneven expression levels. Bioinformatics. 2013;29:i326–i334. doi: 10.1093/bioinformatics/btt219. [DOI] [PMC free article] [PubMed] [Google Scholar]
- 29.McKenna A, Hanna M, Banks E, Sivachenko A, et al. The Genome Analysis Toolkit: a MapReduce framework for analyzing next-generation DNA sequencing data. Genome Res. 2010;20:1297–1303. doi: 10.1101/gr.107524.110. [DOI] [PMC free article] [PubMed] [Google Scholar]
- 30.DePristo MA, Banks E, Poplin R, Garimella KV, et al. A framework for variation discovery and genotyping using next-generation DNA sequencing data. Nat Genet. 2011;43:491–498. doi: 10.1038/ng.806. [DOI] [PMC free article] [PubMed] [Google Scholar]
- 31.Kim S, Mischerikow N, Bandeira N, Navarro JD, et al. The generating function of CID, ETD, and CID/ETD pairs of tandem mass spectra: applications to database search. Mol Cell Proteomics. 2010;9:2840–2852. doi: 10.1074/mcp.M110.003731. [DOI] [PMC free article] [PubMed] [Google Scholar]
- 32.Kim S, Pevzner PA. MS-GF+ makes progress towards a universal database search tool for proteomics. Nat Commun. 2014;5:5277. doi: 10.1038/ncomms6277. [DOI] [PMC free article] [PubMed] [Google Scholar]
- 33.Elias JE, Gygi SP. Target-decoy search strategy for increased confidence in large-scale protein identifications by mass spectrometry. Nat Methods. 2007;4:207–214. doi: 10.1038/nmeth1019. [DOI] [PubMed] [Google Scholar]
- 34.Pruitt KD, Tatusova T, Klimke W, Maglott DR. NCBI Reference Sequences: current status, policy and new initiatives. Nucleic Acids Res. 2009;37:D32–36. doi: 10.1093/nar/gkn721. [DOI] [PMC free article] [PubMed] [Google Scholar]
- 35.Sherry ST, Ward MH, Kholodov M, Baker J, et al. dbSNP: the NCBI database of genetic variation. Nucleic Acids Res. 2001;29:308–311. doi: 10.1093/nar/29.1.308. [DOI] [PMC free article] [PubMed] [Google Scholar]
- 36.Forbes SA, Bindal N, Bamford S, Cole C, et al. COSMIC: mining complete cancer genomes in the Catalogue of Somatic Mutations in Cancer. Nucleic Acids Res. 2011;39:D945–950. doi: 10.1093/nar/gkq929. [DOI] [PMC free article] [PubMed] [Google Scholar]
- 37.Flicek P, Ahmed I, Amode MR, Barrell D, et al. Ensembl 2013. Nucleic Acids Res. 2013;41:48–55. doi: 10.1093/nar/gks1236. [DOI] [PMC free article] [PubMed] [Google Scholar]
- 38.Eng JK, Jahan TA, Hoopmann MR. Comet: an open-source MS/MS sequence database search tool. Proteomics. 2013;13:22–24. doi: 10.1002/pmic.201200439. [DOI] [PubMed] [Google Scholar]
- 39.Takahashi Y, et al. Tumor-derived tenascin-C promotes the epithelial-mesenchymal transition in colorectal cancer cells. Anticancer Res. 2013;33:1927–1934. [PubMed] [Google Scholar]
- 40.Jiang X, Couchman JR. Perlecan and tumor angiogenesis. J Histochem Cytochem. 2003;51:1393–1410. doi: 10.1177/002215540305101101. [DOI] [PMC free article] [PubMed] [Google Scholar]
- 41.Vincenzi B, et al. PML as a potential predictive factor of oxaliplatin/fluoropyrimidine-based first line chemotherapy efficacy in colorectal cancer patients. J Cell Physiol. 2012;227:927–933. doi: 10.1002/jcp.22801. [DOI] [PubMed] [Google Scholar]
- 42.Britzen-Laurent N, Lipnik K, Ocker M, Naschberger E, Schellerer VS, Croner RS, Vieth M, Waldner M, Steinberg P, Hohenadl C, Sturzl M. GBP-1 acts as a tumor suppressor in colorectal cancer cells. Carcinogenesis. 2013;34:153–162. doi: 10.1093/carcin/bgs310. [DOI] [PubMed] [Google Scholar]
- 43.Sheng JQ, Li SR, Wu ZT, Xia CH, Wu X, Chen J, Rao J. Transferrin dipstick as a potential novel test for colon cancer screening: a comparative study with immuno fecal occult blood test. Cancer Epidemiol Biomarkers Prev. 2009;18:2182–2185. doi: 10.1158/1055-9965.EPI-09-0309. [DOI] [PubMed] [Google Scholar]
- 44.Teranishi N, Naito Z, Ishiwata T, Tanaka N, Furukawa K, Seya T, Shinji S, Tajiri T. Identification of neovasculature using nestin in colorectal cancer. Int J Oncol. 2007;30:593–603. [PubMed] [Google Scholar]
- 45.Linnebacher M. Tumor-infiltrating B cells come into vogue. World journal of gastroenterology: WJG. 2013;19:8. doi: 10.3748/wjg.v19.i1.8. [DOI] [PMC free article] [PubMed] [Google Scholar]
- 46.Nielsen JS, Sahota RA, Milne K, Kost SE, Nesslinger NJ, Watson PH, Nelson BH. CD20+ tumor-infiltrating lymphocytes have an atypical CD27− memory phenotype and together with CD8+ T cells promote favorable prognosis in ovarian cancer. Clin Cancer Res. 2012;18:3281–3292. doi: 10.1158/1078-0432.CCR-12-0234. [DOI] [PubMed] [Google Scholar]
- 47.Sadanandam A, et al. A colorectal cancer classification system that associates cellular phenotype and responses to therapy. Nat Med. 2013;19:619–625. doi: 10.1038/nm.3175. [DOI] [PMC free article] [PubMed] [Google Scholar]
- 48.de Sousa E Melo F, et al. Poor-prognosis colon cancer is defined by a molecularly distinct subtype and develops from serrated precursor lesions. Nat Med. 2013;19:614–618. doi: 10.1038/nm.3174. [DOI] [PubMed] [Google Scholar]
- 49.Miyaki M, Kuroki T. Role of Smad4 (DPC4) inactivation in human cancer. Biochem Biophys Res Commun. 2003;306:799–804. doi: 10.1016/s0006-291x(03)01066-0. [DOI] [PubMed] [Google Scholar]
- 50.Liu F. SMAD4/DPC4 and pancreatic cancer survival. Commentary re: M. Tascilar et al., The SMAD4 protein and prognosis of pancreatic ductal adenocarcinoma. Clin. Cancer Res., 7:4115–4121, 2001. Clin Cancer Res. 2001;7:3853–3856. [PubMed] [Google Scholar]
- 51.Amado RG, Wolf M, Peeters M, Van Cutsem E, Siena S, Freeman DJ, Juan T, Sikorski R, Suggs S, Radinsky R, Patterson SD, Chang DD. Wild-type KRAS is required for panitumumab efficacy in patients with metastatic colorectal cancer. J Clin Oncol. 2008;26:1626–1634. doi: 10.1200/JCO.2007.14.7116. [DOI] [PubMed] [Google Scholar]
- 52.Ai J, et al. The role of polymeric immunoglobulin receptor in inflammation-induced tumor metastasis of human hepatocellular carcinoma. J Natl Cancer Inst. 2011;103:1696–1712. doi: 10.1093/jnci/djr360. [DOI] [PMC free article] [PubMed] [Google Scholar]
- 53.Tao YL, et al. Identifying FGA peptides as nasopharyngeal carcinoma-associated biomarkers by magnetic beads. J Cell Biochem. 2012;113:2268–2278. doi: 10.1002/jcb.24097. [DOI] [PubMed] [Google Scholar]
- 54.Pruitt KD, et al. RefSeq: an update on mammalian reference sequences. Nucleic Acids Res. 2014;42:D756–763. doi: 10.1093/nar/gkt1114. [DOI] [PMC free article] [PubMed] [Google Scholar]
- 55.Li X, Wu Z, Wang Y, Mei Q, Fu X, Han W. Characterization of adult α- and β-globin elevated by hydrogen peroxide in cervical cancer cells that play a cytoprotective role against oxidative insults. PLoS One. 2013;8:e54342. doi: 10.1371/journal.pone.0054342. [DOI] [PMC free article] [PubMed] [Google Scholar]
Associated Data
This section collects any data citations, data availability statements, or supplementary materials included in this article.