Abstract
We have developed a set of chemometric methods to address two critical issues in quality control of a precious traditional Chinese medicine (TCM), Dong’e Ejiao (DEEJ). Based on near infrared (NIR) spectra of multiple samples, the genuine manufacturer of DEEJ, e.g. Dong’e Ejiao Co., Ltd., was accurately identified among 21 suppliers by the fingerprint method using Hotelling T2, distance to Model X (DModX), and similarity match value (SMV) as discriminate criteria. Soft independent modeling of the class analogy algorithm led to a misjudgment ratio of 6.2%, suggesting that the fingerprint method is more suitable for manufacturer identification. For another important feature related to clinical efficacy of DEEJ, storage time, the partial least squares-discriminant analysis (PLS-DA) method was applied with a satisfactory misjudgment ratio (15.6%) and individual prediction error around 1 year. Our results demonstrate that NIR spectra comprehensively reflect the essential quality information of DEEJ, and with the aid of proper chemometric algorithms, it is able to identify genuine manufacturer and determine accurate storage time. The overall results indicate the promising potential of NIR spectroscopy as an effective quality control tool for DEEJ and other precious TCM products.
Keywords: Dong’e Ejiao, Near infrared spectroscopy, Manufacturer identification, Storage time identification, Quality control
1. Introduction
Colla corii asini (Ejiao in Chinese), which is made from the hide of Equus animus L., is a precious traditional Chinese medicine (TCM) widely used in China for thousands of years. As recorded in many classic monographs on TCM and in ancient poetry, Ejiao displays a great efficacy in enriching blood and staunching bleeding, being mainly used for the treatment of gynecological diseases, such as menoxenia and post-partum uterine bleeding (Gao and Zhong, 2012). It is no surprise that multiple pharmaceutical factories manufacture Ejiao under different brand names in China; however, it is well accepted that Dong’e donkey-hide glue (Dong’e Ejiao, DEEJ), with a history of use spanning more than 2500 years, is one of the brands with the highest quality. DEEJ is made from the hide of Dezhou donkey and groundwater from Dong’e county, which is located in the west of Shandong Province, China; it is currently the largest brand of Ejiao in China.
Two problems occur in the quality control of DEEJ: manufacturer identification and storage time determination. There are many manufacturers of Ejiao using different raw materials and production processes, and the quality of their products varies wildly, affecting medical efficacy and also price. However, there is no consensus on which brand is best, because of the complexity of the material basis of Ejiao and the relative lack of regulatory standards in the Chinese Pharmacopoeia (Ministry of Public Health of the People’s Republic of China, 2015). Vendors urgently need a way of discriminating Ejiao for the purpose of brand protection and competitive advantage. There is a proverb in TCM that “new ginseng is better than old, while old Ejiao is better than new,” implying that the medicinal properties of Ejiao vary with storage time, which is confirmed by clinical experience. However, storage time is often difficult to determine from product labels, so a rapid way of determining storage time is also needed.
Near infrared (NIR) spectroscopy is a rapid, information-rich, non-destructive analytical technology, which is admirably suitable for the quality control of natural products. In recent years, NIR spectroscopy has been increasingly applied in TCMs, which are used as both food and medicine. Several articles have reported the use of NIR spectroscopy for the brand-protection of agricultural products (Wang et al., 2008; Latorre et al., 2013; Teye et al., 2014) and the determination of storage time of wine (Yu et al., 2008; Fernández-Novales et al., 2009; Ghasemi-Varnamkhasti and Forina, 2014).
We proposed combining NIR spectroscopy with chemometrics to address the two aforementioned issues. For the discriminant analysis of DEEJ, NIR spectroscopy-based fingerprint method was established, and three statistics, Hotelling T2, distance to Model X (DmodX), and similarity match value (SMV), were used for identification. For the storage time determination, partial least squares-discriminant analysis (PLS-DA) method was developed and DEEJ with different storage time was accurately classified. The methodology was found to be helpful for the quality control of DEEJ, and shows promise of addressing similar needs in other precious TCM products in future.
2. Materials and methods
2.1. Samples
The collection of representative samples is a key step in the development of the manufacturer discriminant model. In the present study, 152 Ejiao samples were collected through various channels from almost all the Ejiao manufacturers in China. To expand the scope of the established models, 36 samples of other animal glues, made from antlers (Colla Cornus Cervi), tortoise beetles (Colla Carapacis et Plastri Testudinis), and cowhide (Oxhide Gelatin), produced by the Shandong Dong’e Ejiao Co., Ltd. were also collected. Detailed information on all the samples is listed in Table 1.
Table 1.
Detailed information on the samples used in the research
| Sample | Abbreviation | Manufacturer | Sample No. |
| Colla Cornus Cervi | LJJ | Shandong Dong’e Ejiao Co., Ltd. | 1–10 |
| Colla Carapacis et Plastri Testudinis | GJJ | Shandong Dong’e Ejiao Co., Ltd. | 11–18 |
| Oxhide Gelatin | HMJ | Shandong Dong’e Ejiao Co., Ltd. | 19–36 |
| Dong’e Ejiao | DEEJ | Shandong Dong’e Ejiao Co., Ltd. | 37–98 |
| Ejiao (Colla Corii Asini) | OEJ | Other 20 different manufacturers | 99–188 |
To determine DEEJ storage time, 240 samples produced from 2005 to 2012 (30 samples for each year) were collected.
2.2. NIR spectral collection
After optimization of NIR spectral collecting conditions (detailed information can be found in the Results and Discussion section), an Antaris II Fourier transform (FT)-NIR analyzer (Thermo Scientific, Madison, WI, USA) equipped with integrating-sphere attachments, was used to collect diffuse reflectance spectra. Instrument resolution was specified at 8 cm−1 between 10 000 cm−1 and 4000 cm−1 and each spectrum was collected by adding a total of 128 scans, using air as the reference. During the acquisition of the spectra of all samples, the environment temperature was kept at (25±0.5) °C. Result workflow-based software was used to collect the NIR spectra.
2.3. Chemometrics methods
To discriminate between manufacturers, two kinds of fingerprint analysis were conducted: SMV obtained using the Gram-Schmidt algorithm and principal component analysis (PCA) with Hotelling T2 and DModX as criteria. The thresholds for these three statistics were determined according to the 3σ principle. For storage time determination, the PLS-DA algorithm was adopted.
2.3.1. Similarity match algorithm
Consider a spectral data matrix X, in which there are m standard samples and n data points (wavenumbers) for each spectrum,
 . .
|
If the rank of X is r, the matrix can be orthogonally decomposed into score matrix T and loading matrix P through the Gram-Schmidt algorithm
 , ,
|
(1) |
where pj=[pj 1, pj 2, …, pjn] (j=1, 2, …, r) is a set of vectors orthogonal to each other. Therefore, the following formula is established,
 . .
|
(2) |
If the spectral data of the sample to be evaluated is x new, its score vector t new can be calculated according to Eq. (2),
 . .
|
(3) |
When j=1, define ei 1=|s 1−ti 1|2 (i=1, 2, …, m) and find the minimum from e 11, e 21, …, em 1, written as ek 1, and the associated tk 1 is written as t 1′. With the same method, calculate t 2′, t 3′, …, tr′, when j=2, 3, …, r. The residual spectrum e can be obtained according to the following formula,
 . .
|
(4) |
The residual spectrum e represents the difference between the sample to be evaluated and the standard sample. The SMV can be obtained according to the following formula,
 . .
|
(5) |
SMV can range from 0 to 100; the higher the SMV, the greater the similarity between the sample to be evaluated and the standard sample (McCarthy, 1992; Li et al., 2013).
It is important to determine the distribution of SMV because if it follows a normal distribution, its threshold can be determined according to the 3σ principle in the statistical process control (Zhang et al., 2009). If the SMV is normally distributed, the threshold can be set as the average value of SMV minus three standard deviations (SD). The SMV of the sample to be evaluated can be compared with the threshold: if it is greater than or equal to the threshold, the sample can be considered to be in conformity with the standard sample, and vice versa.
2.3.2. Principal component analysis
There is a great deal of correlated or redundant information in data obtained from NIR spectra. PCA is a favorite tool for data compression and information extraction, which can significantly aid interpretation and further analysis. Soft independent modeling of class analogy (SIMCA) is a PCA-based discriminant analysis algorithm. Hotelling T2 and DModX are two important statistics associated with SIMCA models. Thus, SIMCA was adopted here for the discriminant analysis of DEEJ, and Hotelling T2 and DModX were taken as the criteria for the consistency test.
2.3.3. Partial least squares-discriminant analysis
To determine the storage time of DEEJ, the PLS-DA method was used. PLS-DA is a straightforward extension of partial least squares regression (PLSR), which combines PLSR with the discrimination power of Bayesian classification (González-Arjona et al., 1999), and has been widely used in TCM research (Ortiz et al., 2006; Liu et al., 2008; Niu et al., 2008).
All spectral pre-treatments and chemometric analyses were implemented using the TQ analyst (V8.0, Thermo Fisher, USA), the Unscrambler (V9.6, CAMO PROCESS AS, Oslo, Norway), and the SIMCA-P+12.0 (MKS Umetrics AB, Umeå, Sweden).
3. Results and discussion
3.1. Spectral collection
3.1.1. Spectral collecting mode
Two spectral collecting modes, an integrating-sphere mode and a fibre-optical mode, were compared. Spectra of five randomly chosen samples were collected using each of the two modes, shown in Fig. 1. It can be seen that the spectra obtained using the fibre-optical mode are marked by indentations in the waveband of 7000–4000 cm−1, which may result from fibre-optical absorption. We therefore decided to collect the spectra using the integrating-sphere mode.
Fig. 1.
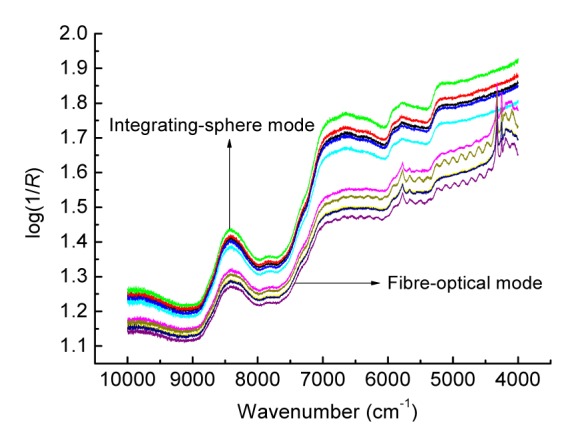
NIR spectra collected using integrating-sphere mode and fibre-optical mode on five Ejiao samples
3.1.2. Optimization of resolution and number of scans
The collection of spectra with better signal-to-noise ratio and repeatability is a key step in establishing NIR spectroscopy analytical methods. We thus optimized the conditions for spectral collection, including resolution and number of scans. In order to characterize the stability and repeatability of the NIR spectra, Ni et al. (2009) reported a method that used the standard variance spectrum of repeat spectra (SVSRS) under the same collecting condition to reflect the repeatability of the NIR spectra. However, there is still no quantitative index that can be used as a criterion. In this research, we adopted Mahalanobis distance for this purpose. Spectra were collected repeatedly for different resolutions and numbers of scans, and then the average Mahalanobis distance (AMD), which represents the average distance of every spectrum to the average spectrum, was calculated and compared. The spectral collection condition, which resulted in the minimum AMD, was subsequently adopted. The AMDs of the spectra gained with different resolutions and for five scans are listed in Table 2.
Table 2.
Average Mahalanobis distance (AMD) of the spectra with different resolutions and for five scans
| Spectral collecting condition | AMD |
| Spectrum resolution (cm−1) | |
| 2 | 1.154 |
| 4 | 1.015 |
| 8 | 0.485 |
| 16 | 0.823 |
| Number of repetition | |
| 16 | 1.055 |
| 32 | 1.006 |
| 64 | 0.473 |
| 128 | 0.400 |
3.1.3. Character of the NIR spectra
Spectra of all the samples were collected using the conditions described above. The stacked spectra of the Ejiao from different manufacturers are shown in Fig. 2a, and the average spectra of the DEEJ samples with different storage time are shown in Fig. 2b. As can be seen, Fig. 2a indicated that the Ejiao samples from different manufacturers have similar spectral shapes, and from Fig. 2b, it was observed that the spectral absorption decreased with increased storage time. In the DEEJ spectra, four characteristic absorption peaks can be viewed and interpreted as: OH stretch+OH deformation of water (5151 cm−1), N–H (2ν) in CONH2 (6735 cm−1), CONH2 specifically due to C=O hydrogen bonded to the N–H of the peptide link termed the α-helix structure (5738 cm−1), N–H (3ν) methyl C–H (8377 cm−1) (Workman and Weyer, 2008). All these bonds are abundant in the molecular structures of water, amino acids, peptides, proteins, and fatty acids (which exist in soybean oil, a raw material for Ejiao), so the NIR spectra can be considered to reflect the chemical information of the Ejiao sufficiently.
Fig. 2.
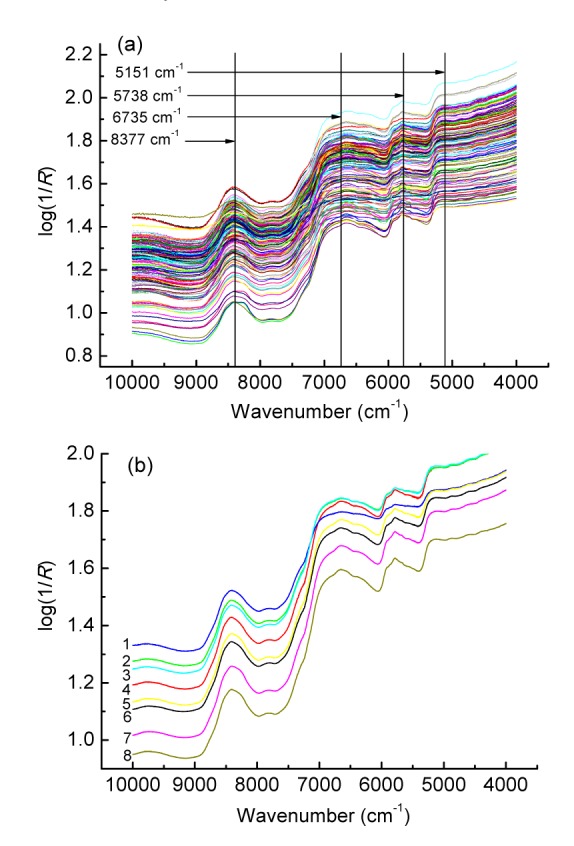
NIR spectra of the Ejiao samples from different manufacturers (a) and storage time (1–8 years) (b)
3.2. Fingerprint analysis
Currently, the chromatographic fingerprint is widely used in the quality control of natural products. The analysis is often based on chromatographic separation techniques such as gas chromatography (GC), high-performance liquid chromatography (HPLC), and capillary electrophoresis (CE), combined with ultraviolet (UV), diode array detector (DAD), evaporative light scattering detector (ELSD), or mass spectrometry (MS) (Xie et al., 2006; Liu et al., 2007; Alaerts et al., 2010; Ding et al., 2011). Such fingerprints can reflect the information of a few compounds with specific chromatographic properties and characteristic detection signals, but are unsuitable for holistic chemical composition. Spectroscopic analysis, such as mid-infrared (MIR) (Sun et al., 2003) and NIR (Woodcock et al., 2009; Lucio-Gutiérrez et al., 2011), can supplement and provide a more comprehensive analysis than the chromatographic fingerprint alone. The NIR spectrum is sensitive to organic molecules containing molecular bonds, such as C–H, N–H, and O–H. Thus the NIR spectroscopy-based fingerprint of the sample reflects the complex attributes of Ejiao, which are related to raw material content and technical processing.
The calculation of the evaluation index is the key stage in fingerprint analysis. Cosine ratio, correlation coefficient, and Euclidean distance are three commonly used indicators. However, these parameters are often calculated by comparing the chromatogram of the new sample with the average spectrum of standard samples, which does not reflect the inherent flexibility of the standard samples. We therefore adopted two new evaluation methodologies for the NIR spectroscopy-based fingerprint analysis.
3.2.1. Similarity match model
Qu et al. (2006) reported the satisfactory use of the SMVs of the NIR spectroscopy-based method for the identification of donkey hide glue (Ejiao). However, the method has only been applied to the identification of authentic Ejiao samples and counterfeits, but not to the identification of Ejiao from individual manufacturers with different brands.
In the present research, 30 DEEJ samples were used as standard samples, and the similarity match model was established with the Gram-Schmidt algorithm after the spectra were pre-treated with a combination of the “MSC+2nd D+Norris derivative filter (15, 5),” that is a multiplicative scattering correction followed by a 2nd derivative and Norris derivative filter (window width=15, polynominal order=5). The SMVs of other samples were calculated and are shown in Fig. 3.
Fig. 3.
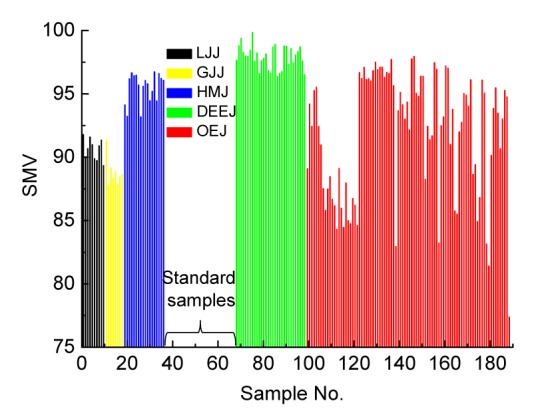
Similarity match values (SMVs) of the validation samples
LJJ, black; GJJ, yellow; HMJ, blue; DEEJ, green; OEJ, red (Note: for interpretation of the references to color in this figure legend, the reader is referred to the web version of this article). The same for the following Figs. 4 and 5
It can be seen that the remaining 32 DEEJ samples had higher SMVs, with 96.52 as the minimum value. A normality test (α=0.05) indicated that the SMVs were normally distributed with P=0.691 (>0.05). We therefore set the threshold SMV at 97.91−3×0.89=95.24. Samples from other manufacturers possessed lower SMVs, which were distributed in a range between 77.38 and 97.97. The maximum SMVs reached for the three other animal glues (Colla Cornus Cervi, Colla Carapacis et Plastri Testudinis, Oxhide Gelatin) were 91.79, 91.35, and 96.73, respectively. Although the SMVs vary with the different samples, the DEEJ samples cannot be completely differentiated from other Ejiao samples or other kinds of animal glue. From the SMV calculations, it can also be seen that samples from the same manufacturer can vary greatly between batches, indicating a relatively low production level. A different data processing method is required to distinguish the DEEJ.
3.2.2. SIMCA model
SIMCA is a supervised classification technique, which describes each class separately in a principal component (PC) space. New measurements are considered to belong to the class if their Euclidean distance towards the constructed PC space is not significantly larger than the Euclidean distance of the class objects towards their PC space (de Maesschalck et al., 1999). In our research, 30 DEEJ samples and 45 OEJ (Ejiao (Colla Corii Asini)) samples were used as the calibration set to establish the PC space and the corresponding Euclidean distance. Other samples were used as the validation set to challenge the established model. The optimum PC number (n=4) was determined using leave-one-out (LOO) cross validation. Fig. 4 gives the t 1–t 2 scattergram of the established SIMCA model. Among the 113 validation samples, three other kinds of animal glue were accurately distinguished; only 2 DEEJ samples and 5 other OEJ samples were incorrectly categorized, the misjudgment rate being 6.2%.
Fig. 4.
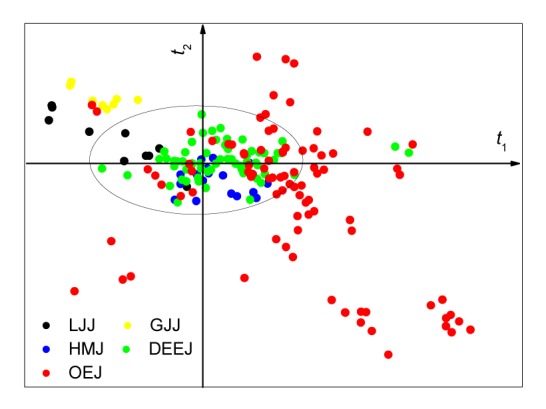
t 1–t 2 scattergram of the established SIMCA model
3.2.3. Evaluation by Hotelling T2 and DModX
After the PC spaces were established with 30 DEEJ samples randomly selected for the fingerprint analysis, Hotelling T2 and DModX were used to evaluate quality consistency and fast recognition of abnormal samples (Setarehdan et al., 2002; Kourti, 2005; Chiang and Colegrove, 2007). Fig. 5 gives the Hotelling T2 and DModX control charts of the samples. It can be concluded that all the DEEJ samples are kept within the control limit and also the warning limit. Several other samples also have Hotelling T2 or DModX values lower than the control limit.
Fig. 5.
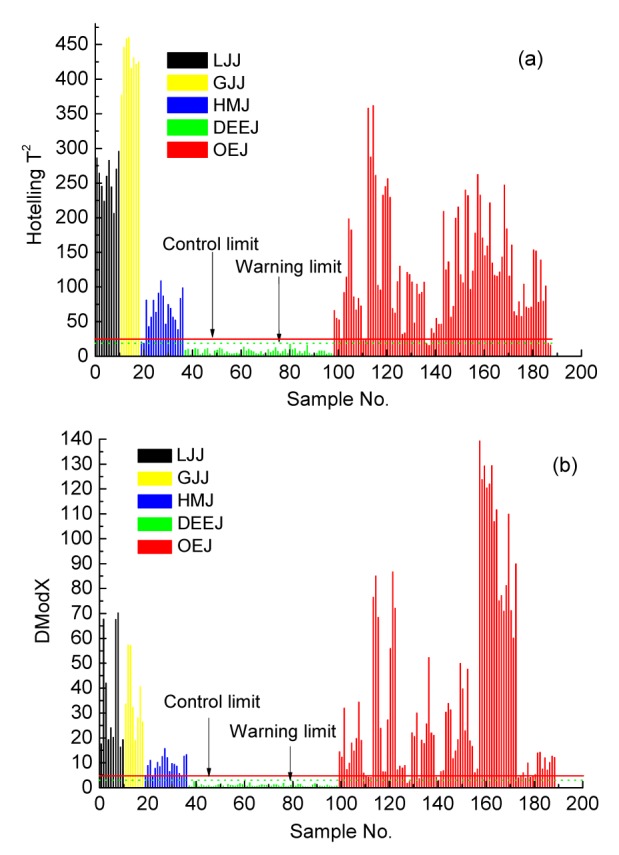
Hotelling T2 (a) and DModX (b) control charts of the samples
All the above mentioned methods indicate that some OEJ samples are close to the authentic DEEJ with similar statistics, but it is interesting to note that if we use SMV, Hotelling T2, and DModX as discriminate criteria simultaneously, no other samples will be recognized as authentic DEEJ, which indicates that the NIR spectroscopy-based fingerprint can be used as a brand-protection technology for DEEJ.
3.3. Storage time determination
3.3.1. Division of the sample sets and spectral data preprocessing
About 20 samples a year from each of the last 8 years were randomly selected to construct the calibration set (n=163), the remaining samples being used as the validation set (n=77). The outliers were detected using Dixon’s test: spectral data were processed with PCA, and the Mahalanobis distance (MD) between the average spectrum and each spectrum was calculated with the first few PCs. Samples were then sorted in descending order according to MD value, the samples with extreme MD values being considered as outliers. Using Dixon’s test, 6 samples were removed from the calibration set as outliers.
Different wavenumber ranges and spectral pre-treatment methods were compared in accordance with the predictive ability of corresponding calibration models. The waveband of 8664.36–5066.06 cm–1 and the pretreatment combination of “MSC+2nd D+Norris derivative filter (15, 5)” were chosen.
3.3.2. Calibration and validation of the PLS-DA model
After the division of sample sets, waveband selection, and spectral data preprocessing, the spectral data matrix of the calibration set was used for the PLS-DA modeling, and based upon the LOO cross validation, an optimal model was built on the first 4 PCs, which have cumulative variance contribution rates of 99.6%. Among 77 samples of the validation set used to evaluate the established model, 65 samples were predicted correctly, giving an accuracy rate of 84.4%, and the deviations of the other 12 samples were all within ±1 year. The correlation coefficients of the calibration set and the validation set reached 0.9736 and 0.9707, respectively, which indicated that the established model fits satisfactorily. Correlation plots of actual values versus NIR predictions are shown in Fig. 6.
Fig. 6.
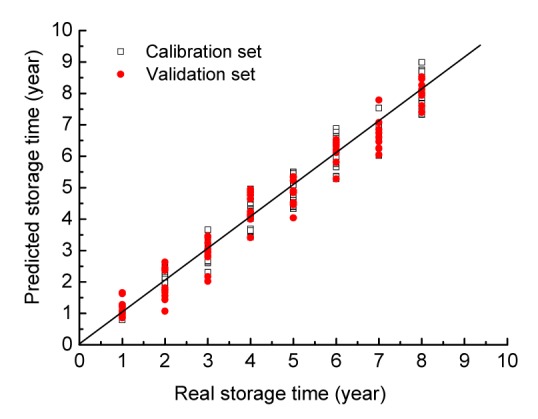
Correlation plots of the real storage time and the NIR predictions of DEEJ
In conclusion, the quality of DEEJ with different storage time can be determined by NIR spectroscopy. The storage time difference has confirmed the rationality of the proverb in the TCM theory: “new ginseng is better than old, while old Ejiao is better than new.” We speculate that such a difference originates from degradation of the collagen protein as well as polymerization of amino acids in DEEJ, which results in DEEJ’s characteristic peptide with strong pharmacological activity. However, the reaction process often takes a long time to complete, which also provides evidence for why there was no significant difference between the samples produced in neighboring years. The change in DEEJ with different storage time is reflected in the NIR spectra. To verify this speculation, we are now conducting research using size exclusion chromatography, which can separate collagen protein, peptides, and amino acids effectively.
4. Conclusions
NIR spectra can comprehensively provide quality information about DEEJ, addressing two important issues: discriminant analysis among different manufacturers and storage time determination. The use of NIR spectroscopy and chemometric algorithms indicates that NIR spectroscopy can be used as a brand protection tool for DEEJ, and the proposed methods may be equally applicable to the quality control of other precious TCM products.
Acknowledgements
We sincerely thank the collaborators from Shandong Dong’e Ejiao Co., Ltd., Liaocheng, China, for supporting this work and for permission to publish the above results.
Footnotes
Project supported by the National Science and Technology Major Project (No. 2011ZX09201-201-10), China
Compliance with ethics guidelines: Wen-long LI, Hai-fan HAN, Lu ZHANG, Yan ZHANG, and Hai-bin QU declare that they have no conclict of interest.
This article does not contain any studies with human or animal subjects performed by any of the authors.
References
- 1.Alaerts G, Merino-Arévalo M, Dumarey M, et al. Exploratory analysis of chromatographic fingerprints to distinguish rhizoma chuanxiong and rhizoma ligustici. J Chromatogr A. 2010;1217(49):7706–7716. doi: 10.1016/j.chroma.2010.10.010. (Available from: http://dx.doi.org/10.1016/j.chroma.2010.10.010) [DOI] [PubMed] [Google Scholar]
- 2.Chiang LH, Colegrove LF. Industrial implementation of on-line multivariate quality control. Chemometr Intell Lab. 2007;88(2):143–153. (Available from: http://dx.doi.org/10.1016/j.chemolab.2007.02.005) [Google Scholar]
- 3.de Maesschalck R, Candolfi A, Massart DL, et al. Decision criteria for soft independent modelling of class analogy applied to near infrared data. Chemometr Intell Lab. 1999;47(1):65–77. (Available from: http://dx.doi.org/10.1016/S0169-7439(98)00159-2) [Google Scholar]
- 4.Ding Y, Wu EQ, Liang C, et al. Discrimination of cinnamon bark and cinnamon twig samples sourced from various countries using HPLC-based fingerprint analysis. Food Chem. 2011;127(2):755–760. doi: 10.1016/j.foodchem.2011.01.011. (Available from: http://dx.doi.org/10.1016/j.foodchem.2011.01.011) [DOI] [PubMed] [Google Scholar]
- 5.Fernández-Novales J, López MI, Sánchez MT, et al. Shortwave-near infrared spectroscopy for determination of reducing sugar content during grape ripening, winemaking, and aging of white and red wines. Food Res Int. 2009;42(2):285–291. (Available from: http://dx.doi.org/10.1016/j.foodres.2008.11.008) [Google Scholar]
- 6.Gao X, Zhong G. Science of Chinese Materia Medical, 2nd Ed. Beijing, China: People’s Medical Publishing House; 2012. pp. 1756–1761. (in Chinese) [Google Scholar]
- 7.Ghasemi-Varnamkhasti M, Forina M. NIR spectroscopy coupled with multivariate computational tools for qualitative characterization of the aging of beer. Comput Electron Agric. 2014;100:34–40. (Available from: http://dx.doi.org/10.1016/j.compag.2013.10.001) [Google Scholar]
- 8.González-Arjona D, López-Pérez G, González AG. Performing procrustes discriminant analysis with HOLMES. Talanta. 1999;49(1):189–197. doi: 10.1016/s0039-9140(98)00354-3. (Available from: http://dx.doi.org/10.1016/S0039-9140(98)00354-3) [DOI] [PubMed] [Google Scholar]
- 9.Kourti T. Application of latent variable methods to process control and multivariate statistical process control in industry. Int J Adapt Control Signal Pr. 2005;19(4):213–246. (Available from: http://dx.doi.org/10.1002/acs.859) [Google Scholar]
- 10.Latorre CH, Crecente RMP, Martín SG, et al. A fast chemometric procedure based on NIR data for authentication of honey with protected geographical indication. Food Chem. 2013;141(4):3559–3565. doi: 10.1016/j.foodchem.2013.06.022. (Available from: http://dx.doi.org/10.1016/j.foodchem.2013.06.022) [DOI] [PubMed] [Google Scholar]
- 11.Li W, Cheng Z, Wang Y, et al. Quality control of Lonicerae Japonicae Flos using near infrared spectroscopy and chemometrics. J Pharmaceut Biomed Anal. 2013;72(2):33–39. doi: 10.1016/j.jpba.2012.09.012. (Available from: http://dx.doi.org/10.1016/j.jpba.2012.09.012) [DOI] [PubMed] [Google Scholar]
- 12.Liu AH, Lin YH, Yang M, et al. Development of the fingerprints for the quality of the roots of Salvia miltiorrhiza and its related preparations by HPLC-DAD and LC-MSn . J Chromatogr B. 2007;846(1-2):32–41. doi: 10.1016/j.jchromb.2006.08.002. (Available from: http://dx.doi.org/10.1016/j.jchromb.2006.08.002) [DOI] [PubMed] [Google Scholar]
- 13.Liu L, Cozzolino D, Cynkar WU, et al. Preliminary study on the application of visible-near infrared spectroscopy and chemometrics to classify Riesling wines from different countries. Food Chem. 2008;106(2):781–786. (Available from: http://dx.doi.org/10.1016/j.foodchem.2007.06.015) [Google Scholar]
- 14.Lucio-Gutiérrez JR, Coello J, Maspoch S. Application of near infrared spectral fingerprinting and pattern recognition techniques for fast identification of Eleutherococcus senticosus . Food Res Int. 2011;44(2):557–565. (Available from: http://dx.doi.org/10.1016/j.foodres.2010.11.037) [Google Scholar]
- 15.McCarthy WJ. TQ Analyst User’s Guide. Madison, WI, USA: Thermo Nicolet Corp; 1992. pp. 46–47. [Google Scholar]
- 16.Ministry of Public Health of the People’s Republic of China. Pharmacopoeia of the People’s Republic of China. Beijing, China: China Pharmaceutical Technology Press; 2015. pp. 189–190. (in Chinese) [Google Scholar]
- 17.Ni LJ, Zhang LG, Xie J, et al. Pattern recognition of Chinese flue-cured tobaccos by an improved and simplified K-nearest neighbors classification algorithm on near infrared spectra. Anal Chim Acta. 2009;633(1):43–50. doi: 10.1016/j.aca.2008.11.044. (Available from: http://dx.doi.org/10.1016/j.aca.2008.11.044) [DOI] [PubMed] [Google Scholar]
- 18.Niu XY, Yu HY, Ying YB. The application of near-infrared spectroscopy and chemometrics to classify Shaoxing wines from different breweries. Trans ASABE. 2008;51(4):1371–1376. (Available from: http://dx.doi.org/10.13031/2013.25220) [Google Scholar]
- 19.Ortiz MC, Sarabia L, Garcia-Rey R, et al. Sensitivity and specificity of PLS-class modelling for five sensory characteristics of dry-cured ham using visible and near infrared spectroscopy. Anal Chim Acta. 2006;558(s1-2):125–131. (Available from: http://dx.doi.org/10.1016/j.aca.2005.11.038) [Google Scholar]
- 20.Qu HB, Yang HL, Cheng YY. Fast and nondestructive discrimination of donkeyhide glue by near-infrared spectroscopy. Spectrosc Spectr Anal. 2006;26(1):60–62. (in Chinese) [PubMed] [Google Scholar]
- 21.Setarehdan SK, Soraghan JJ, Littlejohn D, et al. Maintenance of a calibration model for near infrared spectrometry by a combined principal component analysis-partial least squares approach. Anal Chim Acta. 2002;452(1):35–45. (Available from: http://dx.doi.org/10.1016/S0003-2670(01)01446-5) [Google Scholar]
- 22.Sun SQ, Tang JM, Yuan ZM, et al. FTIR and classification study on trueborn tuber dioscoreae samples. Spectrosc Spectr Anal. 2003;23(2):258–261. (in Chinese) [PubMed] [Google Scholar]
- 23.Teye E, Huang X, Lei W, et al. Feasibility study on the use of Fourier transform near-infrared spectroscopy together with chemometrics to discriminate and quantify adulteration in cocoa beans. Food Res Int. 2014;55:288–293. (Available from: http://dx.doi.org/10.1016/j.foodres.2013.11.021) [Google Scholar]
- 24.Wang L, Liu F, He Y. Fast detection of white vinegar varieties and pH by Vis/NIR spectroscopy. Spectrosc Spectr Anal. 2008;28(4):813–816. (in Chinese) [PubMed] [Google Scholar]
- 25.Woodcock T, Downey G, Donnell CPO. Near infrared spectral fingerprinting for confirmation of claimed PDO provenance of honey. Food Chem. 2009;114(2):742–746. (Available from: http://dx.doi.org/10.1016/j.foodchem.2008.10.034) [Google Scholar]
- 26.Workman J, Weyer L. Practical Guide to Interpretive Near-Infrared Spectroscopy. Boca Raton: CRC Press; 2008. [Google Scholar]
- 27.Xie P, Chen S, Liang Y, et al. Chromatographic fingerprint analysis–a rational approach for quality assessment of traditional Chinese herbal medicine. J Chromatogr A. 2006;1112(1-2):171–180. doi: 10.1016/j.chroma.2005.12.091. (Available from: http://dx.doi.org/10.1016/j.chroma.2005.12.091) [DOI] [PubMed] [Google Scholar]
- 28.Yu H, Lin H, Xu H, et al. Prediction of enological parameters and discrimination of rice wine age using least-squares support vector machines and near infrared spectroscopy. J Agric Food Chem. 2008;56(2):307–313. doi: 10.1021/jf0725575. (Available from: http://dx.doi.org/10.1021/jf0725575) [DOI] [PubMed] [Google Scholar]
- 29.Zhang F, Liu JS, Liu ZC, et al. Quality control in tobacco flavor by near-infrared transmittance spectroscopy. Acta Tabacaria Sin. 2009;15(3):12–16. [Google Scholar]


