Figure 3.
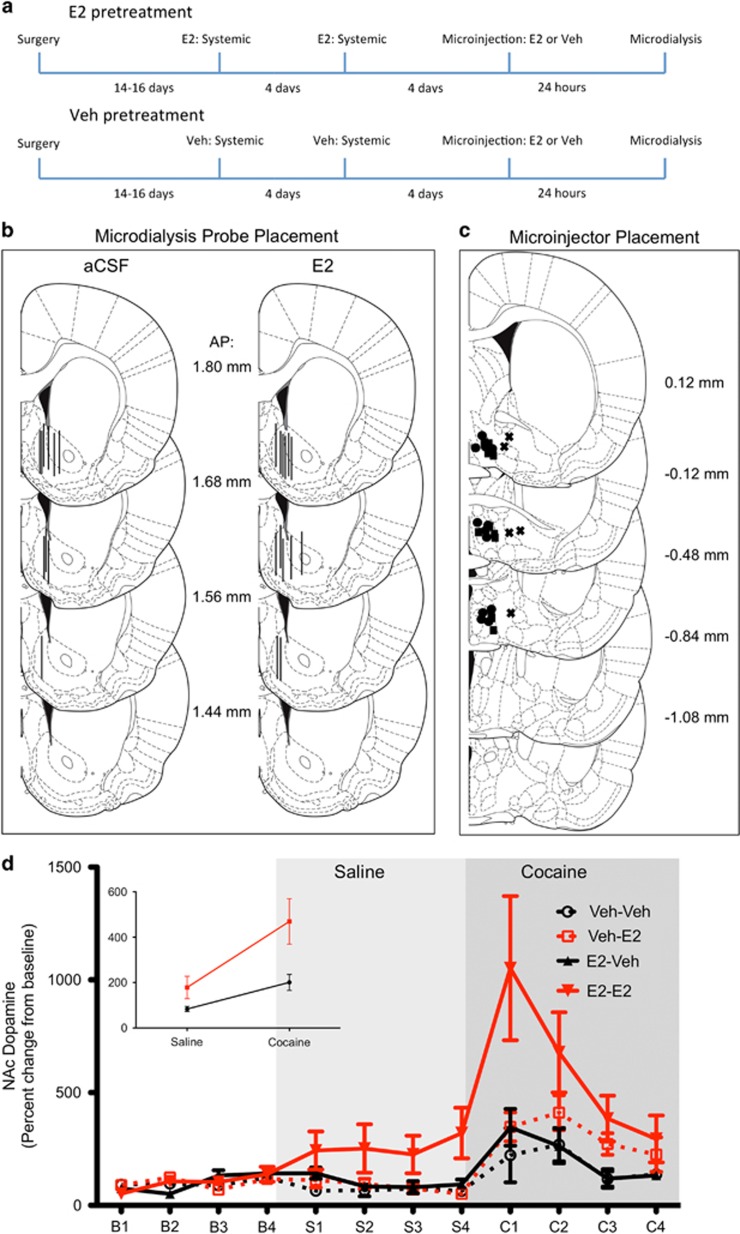
(a) Timeline detailing the time course and hormonal manipulation for animals in the E2 microinjection microdialysis study. E2 was administered 4 days apart via subcutaneous injections. Representations of histological analyses of probe and microinjector placements are depicted in panels b and c. (b) Coronal hemisections through the right side of the nucleus accumbens (NAc; 1.44–1.80 mm anterior to the bregma). Lines represent placement of microdialysis probes in E2- and artificial cerebrospinal fluid (aCSF)-microinjected animals. (c) Coronal hemisections through the medial preoptic area (mPOA; 0.12 mm anterior to 1.08 mm posterior to the bregma). Circles and squares represent microinjector placement for E2- and aCSF-treated animals, respectively, and X's represent misses, adapted from Paxinos et al (2007). (d) E2 administration increases cocaine-induced dopamine (DA) release. DA release changes in percent from baseline between subjects who received aCSF mPOA microinjection and were pretreated with vehicle (n=5; black circle), E2 mPOA microinjection and pretreatment with vehicle (n=6; red square), aCSF mPOA microinjection and were pretreated with E2 (n=5; black triangle), or E2 mPOA microinjection and were pretreated with E2 (n=7; red triangle). Analysis revealed a significant three-way interaction between time, drug, and hormone pretreatment; decomposition of interaction present in Results section. Inset shows significant interaction (F(1,21)=4.71, p<0.05) between hormone microinjection and drug (saline and cocaine) collapsed across time. Values are expressed as mean±SEM. A full color version of this figure is available at the Neuropsychopharmacology journal online.

