

Abstract
Background
Few studies have differentiated risk factors for term-small for gestational age (SGA), preterm-appropriate for gestational age (AGA), and preterm-SGA, despite evidence of varying risk of child mortality and poor developmental outcomes.
Methods
We analyzed birth outcome data from singleton infants, who were enrolled in a large randomized, double-blind, placebo-controlled trial of neonatal vitamin A supplementation conducted in Tanzania. SGA was defined as birth weight <10th percentile for gestation age and sex using INTERGROWTH standards and preterm birth as delivery at <37 complete weeks of gestation. Risk factors for term-SGA, preterm-AGA, and preterm-SGA were examined independently using log-binomial regression.
Results
Among 19,269 singleton Tanzanian newborns included in this analysis, 68.3 % were term-AGA, 15.8 % term-SGA, 15.5 % preterm-AGA, and 0.3 % preterm-SGA. In multivariate analyses, significant risk factors for term-SGA included maternal age <20 years, starting antenatal care (ANC) in the 3rd trimester, short maternal stature, being firstborn, and male sex (all p < 0.05). Independent risk factors for preterm-AGA were maternal age <25 years, short maternal stature, firstborns, and decreased wealth (all p < 0.05). In addition, receiving ANC services in the 1st trimester significantly reduced the risk of preterm-AGA (p = 0.01). Significant risk factors for preterm-SGA included maternal age >30 years, being firstborn, and short maternal stature which appeared to carry a particularly strong risk (all p < 0.05).
Conclusion
Over 30 % of newborns in this large urban and rural cohort of Tanzanian newborns were born preterm and/or SGA. Interventions to promote early attendance to ANC services, reduce unintended young pregnancies, increased maternal height, and reduce poverty may significantly decrease the burden of SGA and preterm birth in sub-Saharan Africa.
Trial registration
Australian New Zealand Clinical Trials Registry (ANZCTR) – ACTRN12610000636055, registered on 3rd August 2010.
Keywords: Risk factors, Birth weight, Term-SGA, Preterm-AGA, Preterm-SGA, Tanzania
Background
Globally, more than 20 million infants (15.5 % of live births) each year are born low birthweight (LBW) or <2500 g [1], with the vast majority occurring in low and middle income countries (LMICs) [2]. LBW is due to preterm birth (PTB) and intrauterine fetal growth restriction (IUGR) or a combination of both [3, 4]. Small-for-gestational-age (SGA; weight less than 10th percentile for sex and gestational age) is the primary measure for IUGR. It is estimated that of the 135 million babies born in 2010 in LMICs, 21.9 % were term-SGA, 8.1 % were preterm-appropriate for gestational age (AGA) and 2.1 % were preterm-SGA [5].
Preterm and SGA births are both well documented to increase the risk of morbidity and mortality, and newborns who are both preterm and SGA have the highest risk [6, 7]. A multi-country analysis of mortality risk in preterm and SGA births from LMICs determined that, compared to babies born term-AGA, the relative risk for neonatal mortality was 2.44 for term-SGA births, 8.05 for preterm-AGA, and 15.4 for preterm-SGA births [6]. In addition to survival implications, preterm and SGA births have increased risk for malnutrition and life-long complications including impaired neurodevelopment, non-communicable diseases, and psychological or emotional distress [8–10].
Despite a significant body of literature that mortality, morbidity, growth and development outcomes vary for preterm and SGA births, few studies have identified risk factors for combinations of preterm and SGA births [11]. In this analysis we sought to differentiate risk factors for term-SGA, preterm-AGA and preterm-SGA births and to our knowledge this is the first study to do so in Sub-Saharan Africa.
Methods
Study design and data collection
This study consist of women and singleton infants enrolled in a randomized double-blind, placebo- controlled neonatal vitamin A supplementation trial conducted in Tanzania between August 2010 and March 2013. Trial recruitment and data collection procedures have been presented elsewhere [12]. Briefly, the trial enrolled participants from urban (Dar es Salaam) and rural (Morogoro) settings in Tanzania. In Dar es Salaam, participants were enrolled at antenatal clinics (ANC) and in labor wards of public health facilities in Kinondoni, Ilala, and Temeke districts. In Morogoro, the study recruited within the Health and Demographic Surveillance System (HDSS) of Ifakara Health Institute which covers approximately 2,400 km2 and allowed for enrollment of both health facility and home births.
Newborns were eligible for randomization if they were able to feed orally, were born within the past 72 h, were not previously enrolled in other clinical trials, the family intended to stay in the study area for at least six months post-delivery, and the parents provided written informed consent to participate. A total of 32,843 mothers and their newborns were screened for inclusion in the parent trial. A total of 844 (2.6 %) were excluded for the following reasons: 237 (0.7 %) were not age eligible (>72 h since birth), 38 (0.1 %) were not able to feed orally and 569 (1.7 %) did not plan to reside in the study area for the next six months after delivery. A total of 31,999 newborns were randomized in the trial of which 11,895 resided in Dar es Salaam and 20,104 in Morogoro. There were 30,891 singleton births, and 1,108 were of multiple gestation.
Trained study staff administered a baseline questionnaire to mothers in order to collect information on demographic, socioeconomic, and environmental factors as well as date of mother’s last menstrual period (LMP). We assessed LMP twice, during pregnancy surveillance and at the time of Vitamin A dosing. All infants had their birthweight measured at the time of dosing (at health facility or home) by study staff using calibrated scales with digital screens. Scale calibration with standard weights and weight standardization for all study staff was completed regularly for quality assurance.
Statistical analysis
We restricted this analysis to 19,269 (62.4 %) singleton infants who had complete data on birth weight and gestational age. Gestational age was calculated from maternal last normal menstrual period (LMP) report and preterm birth was defined as delivery at <37 completed weeks of gestation. SGA was defined as birth weight <10th percentile for gestational age and sex using INTERGROWTH standards [13]. We combined preterm birth and SGA into four mutually exclusive categories; term appropriate-for-gestational age (term-AGA), term small-for-gestational age (term-SGA), preterm appropriate-for-gestational age (preterm-AGA), and preterm small-for-gestational age (preterm-SGA). In sensitivity analyses, we defined preterm as delivery <34 completed weeks of gestation and SGA as <3rd percentile for gestational age and sex using INTERGROWTH standards.
We then examined demographic, socioeconomic, and environmental risk factors of term-SGA, preterm-AGA, and preterm-SGA as compared to reference term-AGA using log-binomial regression models to obtain risk ratio estimates. Variables assessed in univariate and multivariate analyses included location (Dar es Salaam and Morogoro), maternal age (<20, 20–25, 25–30, 30–35 and ≥ 35 years), maternal and paternal education (no formal schooling, some primary, completed primary and secondary plus), wealth quintile, trimester of first ANC visit (1st, 2nd, 3rd trimester), maternal height (<150, 150.0-154.9, 155.0-159.9, and ≥160.0 cm), parity (first born, 2nd–4th, and 5th birth or greater), and infant sex. Home versus facility births were only examined in univariate analyses due to issues of causality (preterm births may lead to home births). Wealth index quintile was defined by a principal component analysis of household assets and characteristics (bicycle, radio, mobile phone, television, motorcycle, car, animal ownership, electricity, and roof type) stratified by Dar es Salaam and Morogoro residence. A priori we decided to examine potential effect modification of all predictors by location (Dar es Salaam vs. Morogoro). Effect modification was assessed through use of interaction terms with statistical significance determined by the log-rank test. If statistically significant effect modification by site was determined in the univariate model, the interaction term was automatically included in the multivariate model. Missing data were retained using the missing indicator method. All p-values were 2–sided with a p < 0.05 considered statistically significant. Statistical analyses were performed using SAS v 9.4 (SAS Institute Inc., Cary, NC, USA).
Results
Baseline characteristics of the 19,269 singleton newborns included in the analysis are presented in Table 1. Briefly, 13,166 newborns (68.3 %) were term-AGA, 3,051 (15.8 %) term-SGA, 2,989 (15.5 %) preterm-AGA, and 63 (0.3 %) were preterm-SGA. Further, 633 newborns (3.3 %) were born <34 weeks gestation and 1,494 newborns (7.8 %) were <3rd percentile for gestational age and sex. The majority of mothers and fathers of newborns in our cohort had at least completed primary school (79.5 and 84.9 % respectively) and most mothers attended their first ANC visit during the second trimester (58.9 %). A total of 1,707 (8.9 %) births took place in the home and there was no difference in mean birthweight for home (mean: 3085 ± 460 g) versus facility births (mean: 3083 ± 476 g) (p = 0.87). Baseline characteristics of singleton mothers unable to recall their LMP and who were excluded from the analysis, were similar to singleton mothers who were able to recall their LMP (Appendix 1).
Table 1.
Baseline characteristics of study participants in total population and stratified by site
| Total Population (n = 19,269) | |
|---|---|
| Mean (SD) or n (%) | |
| Residency | |
| Dar es Salaam region | 7,667 (39.8) |
| Morogoro region | 11,602 (60.2) |
| Maternal age (years) | 25.8 ± 5.9 |
| Maternal education | |
| No formal schooling | 1,445 (7.5) |
| Some primary | 1,311 (6.8) |
| Completed primary | 13,294 (69.0) |
| Secondary and advanced | 2,019 (10.5) |
| Paternal education | |
| No formal schooling | 801 (4.2) |
| Some primary | 926 (4.8) |
| Completed primary | 13,148 (68.2) |
| Secondary and Advanced | 3,209 (16.7) |
| Trimester of first ANC visit | |
| 1st Trimester | 1,858 (9.6) |
| 2nd Trimester | 11,339 (58.9) |
| 3rd Trimester | 1,630 (23.1) |
| Maternal height (cm) | 155.3 ± 5.2 |
| Infant Sex | |
| Male | 9,963 (51.7) |
| Female | 9,306 (48.3) |
| Parity | |
| First born | 4,621 (24.0) |
| 2nd-4th birth | 8,918 (46.3) |
| 5th or greater birth | 1,996 (10.4) |
| Homebirths | 1,707 (8.9) |
| Birth Outcome | |
| Term-AGA | 13,166 (68.3) |
| Term-SGA | 3,051 (15.8) |
| Preterm-AGA | 2,989 (15.5) |
| Preterm-SGA | 63 (0.3) |
AGA Appropriate for gestational age, ANC Antenatal clinic, SD Standard deviation, SGA Small for gestational age
In Table 2 we presented unadjusted risk factors for term-SGA, preterm-AGA, and preterm-SGA as compared to the reference of term-AGA. Significant risk factors for term-SGA include: younger maternal age, small stature, firstborns, and male sex (p < 0.05), with no formal paternal and maternal schooling showing slight protective associations in unadjusted analysis (p < 0.05). There was significant interaction between wealth quintile and study site in the crude analysis. Poverty (lowest wealth quintile) was a significant risk factor for term-SGA in Dar es Salaam (RR = 1.36, p < 0.001) but was slightly protective in Morogoro (RR = 0.94, p = 0.044) (p-value for interaction <0.001). Risk factors for preterm-AGA in unadjusted analysis included: younger maternal age, small stature, firstborns, and low maternal and paternal education (p < 0.05). We also found that decreased wealth was a significant risk factor for preterm-AGA in both Dar es Salaam and Morogoro (p-values 0.001 and <0.001 respectively), but the magnitude of association was significantly greater for Morogoro newborns (p-value for interaction: 0.008). In the unadjusted analysis risk factors for preterm-SGA included: both maternal age less than 25 years and older than 30 years as compared to the 25–30 year reference, being firstborn, and decreased maternal height (p < 0.05).
Table 2.
Unadjusted predictors of term-SGA, preterm-AGA, and preterm-SGA as compared to term-AGA reference
| Characteristic | Term-AGA | Term-SGA | Preterm-AGA | Preterm-SGA | ||||||
|---|---|---|---|---|---|---|---|---|---|---|
| % (n = 13,166) | % (n = 3,051) | Unadjusted RR (95 % CI) | p-value | % (n = 2,989) | Unadjusted RR (95 % CI) | p-value | % (n = 63) | Unadjusted RR (95 % CI) | p-value | |
| Maternal age | ||||||||||
| < 20 years | 12.6 | 21.1 | 1.69 (1.54-1.86) | <0.001 | 16.8 | 1.37 (1.24–1.52) | <0.001 | 12.1 | 2.50 (0.88–7.11) | 0.172 |
| 20–25 years | 30.1 | 32.3 | 1.21 (1.11–1.32) | <0.001 | 33.9 | 1.20 (1.01–1.31) | <0.001 | 43.1 | 3.73 (1.61–8.61) | 0.009 |
| 25–30 years | 28.4 | 24.2 | Ref. | 25.5 | Ref. | 12.1 | Ref. | |||
| 30–35 years | 22.0 | 16.9 | 0.91 (0.82–1.02) | 0.094 | 17.7 | 0.91 (0.82–1.01) | 0.070 | 24.2 | 3.33 (1.35–8.24) | 0.007 |
| ≥ 35 years | 6.9 | 5.6 | 0.96 (0.82–1.12) | 0.582 | 6.1 | 0.99 (0.85–1.15) | 0.920 | 8.6 | 4.55 (1.74–11.94) | 0.002 |
| Maternal education | ||||||||||
| No formal schooling | 8.1 | 6.3 | 0.78 (0.68–0.90) | <0.001 | 9.2 | 1.11 (0.99–1.25) | 0.073 | 9.1 | 1.22 (0.48–3.09) | 0.682 |
| Some primary | 7.1 | 6.9 | 0.95 (0.83–1.08) | 0.448 | 8.5 | 1.17 (1.04–1.32) | 0.010 | 7.3 | 1.12 (0.40–3.14) | 0.828 |
| Completed primary | 73.2 | 76.6 | Ref. | 72.4 | Ref. | 67.3 | Ref. | |||
| Secondary plus | 11.6 | 10.2 | 0.86 (0.77–0.96) | 0.009 | 10.0 | 0.89 (0.79–1.00) | 0.045 | 16.4 | 1.52 (0.74–3.15) | 0.255 |
| Paternal education | ||||||||||
| No formal schooling | 4.4 | 3.4 | 0.78 (0.64–0.94) | 0.009 | 5.8 | 1.23 (1.06–1.41) | 0.005 | 1.8 | 0.42 (0.06–3.07) | 0.394 |
| Some primary | 4.9 | 5.1 | 1.00 (0.86–1.16) | 0.986 | 6.1 | 1.16 (1.01–1.34) | 0.029 | 5.5 | 1.13 (0.35–3.64) | 0.840 |
| Completed primary | 72.1 | 74.8 | Ref. | 73.2 | Ref. | 70.9 | Ref. | |||
| Secondary plus | 18.6 | 16.7 | 0.89 (0.82–0.98) | 0.012 | 15.0 | 0.83 (0.75–0.91) | <0.001 | 21.8 | 1.19 (0.62–2.28) | 0.591 |
| Dar es Salaam wealth quintile | ||||||||||
| Q1 (Poorest) | 15.9 | 16.3 | 1.36 (1.08–1.72) | 15.9 | 1.35 (1.12–1.64) | 28.6 | 3.02 (0.61–14.92) | |||
| Q2 | 20.7 | 26.2 | 1.44 (1.16–1.79) | 20.7 | 1.21 (1.01–1.45) | 28.6 | 2.03 (0.41–10.01) | |||
| Q3 | 14.9 | 17.2 | 1.27 (1.01–1.60) | 14.9 | 1.16 (0.95–1.40) | 4.8 | 0.44 (0.04–4.87) | |||
| Q4 | 25.6 | 28.8 | 1.18 (0.95–1.46) | 25.6 | 1.10 (0.92–1.31) | 28.6 | 1.45 (0.29–7.15) | |||
| Q5 (Richest) | 11.1 | 11.5 | Ref. | <0.001* | 16.8 | Ref. | 0.001* | 9.5 | Ref. | 0.464* |
| Morogoro wealth quintile | ||||||||||
| Q1 (Poorest) | 16.4 | 16.7 | 0.94 (0.83–1.07) | 22.2 | 1.72 (1.49–1.99) | 14.7 | 0.95 (0.30–2.99) | |||
| Q2 | 21.3 | 19.2 | 0.86 (0.76–0.97) | 26.7 | 1.62 (1.41–1.87) | 17.7 | 0.88 (0.30–2.62) | |||
| Q3 | 17.2 | 18.4 | 0.98 (0.87–1.11) | 13.8 | 1.12 (0.95–1.32) | 11.8 | 0.73 (0.21–2.48) | |||
| Q4 | 20.1 | 21.7 | 0.99 (0.88–1.11) | 19.2 | 1.30 (1.12–1.51) | 35.2 | 1.86 (0.73–4.72) | |||
| Q5 (Richest) | 21.9 | 24.0 | Ref. | 0.044* | 15.3 | Ref. | <0.001* | 20.6 | Ref. | 0.544* |
| Trimester of first ANC visit | ||||||||||
| 1st Trimester | 12.9 | 11.9 | 0.96 (0.86–1.08) | 0.513 | 11.4 | 0.90 (0.80–1.01) | 0.074 | 16.0 | 1.40 (0.65–3.01) | 0.393 |
| 2nd Trimester | 76.5 | 76.0 | Ref. | 77.3 | Ref. | 68.0 | Ref. | |||
| 3rd Trimester | 10.7 | 12.2 | 1.09 (0.98–1.22) | 0.125 | 11.3 | 1.03 (0.92–1.16) | 0.567 | 16.0 | 1.68 (0.78–3.61) | 0.187 |
| Maternal height | ||||||||||
| < 150 cm | 7.7 | 12.7 | 1.90 (1.57–2.31) | 9.9 | 1.48 (1.20–1.83) | 23.3 | 6.36 (1.65–24.46) | |||
| 150.0–154.9 cm | 33.1 | 33.5 | 1.31 (1.11–1.54) | 36.8 | 1.33 (1.13–1.55) | 36.7 | 2.35 (0.66–8.41) | |||
| 155.0–159.9 cm | 37.9 | 38.2 | 1.31 (1.11–1.53) | 36.5 | 1.18 (1.01–1.39) | 30.0 | 1.69 (0.46–6.21) | |||
| ≥ 160.0 cm | 21.3 | 15.6 | Ref. | <0.001* | 16.8 | Ref. | <0.001* | 10.0 | Ref. | 0.011 |
| Parity | ||||||||||
| First born | 26.2 | 42.5 | 1.71 (1.59–1.84) | <0.001 | 31.9 | 1.25 (1.16–1.34) | <0.001 | 49.1 | 2.53 (1.51–4.22) | <0.001 |
| 2nd–4th birth | 59.8 | 49.0 | Ref. | 55.9 | Ref. | 43.4 | Ref. | |||
| 5th or greater | 14.0 | 8.6 | 0.78 (0.68–0.89) | <0.001 | 12.2 | 0.95 (0.85–1.06) | 0.386 | 7.6 | 0.73 (0.26–2.06) | 0.553 |
| Infant sex | ||||||||||
| Male | 51.0 | 54.0 | 1.10 (1.03–1.17) | 0.004 | 52.4 | 1.05 (0.98–1.12) | 0.168 | 50.8 | 0.99 (0.61–1.62) | 0.971 |
| Female | 49.0 | 46.0 | Ref. | 47.6 | Ref. | 49.2 | Ref. | |||
| Place of birth | ||||||||||
| Home | 8.5 | 7.4 | 0.89 (0.79–1.01) | 0.06 | 11.8 | 1.34 (1.22–1.48) | <0.001 | 12.7 | 1.56 (0.75–3.27) | 0.236 |
| Facility | 91.5 | 92.6 | Ref. | 88.2 | Ref. | 87.3 | Ref. | |||
*p-value for trend
AGA Appropriate for gestational age, ANC Antenatal clinic, CI Confidence interval, SGA Small for gestational age, RR Relative risk
In the multivariate analysis, we identified several important risk factors for term-SGA, preterm-AGA, and preterm-SGA as compared to the term-AGA reference (Table 3). Significant, independent risk factors for term-SGA include: maternal age <20 years (p = 0.002), late ANC first visit in 3rd trimester as compared to 2nd trimester (p = 0.025), decreased maternal stature under 160 cm (p < 0.001), being firstborn (p < 0.001), and male sex (p = 0.007). Significant protective factors for term-SGA included maternal secondary education (p = 0.018) and no formal paternal schooling (p = 0.028). For preterm-AGA, significant risk factors included: maternal age <25 years, decreased maternal stature (p < 0.001), and being firstborn (p = 0.003). In addition, attending ANC for the first time in the first trimester as compared to second trimester (p = 0.009) and paternal secondary education were associated with significantly reduced risk of preterm-AGA. Decreased wealth was a significant risk factor for preterm-AGA in Morogoro (p < 0.001) and the results indicated a similar, but smaller in magnitude and not statistically significant trend in Dar es Salaam (p = 0.076) (p-value for interaction: 0.024). For preterm-SGA, significant independent risk factors included maternal age >30 years, firstborns, and decreased maternal height (p = 0.042). Figure 1 illustrates the magnitude of risk of term-SGA, preterm-AGA, and preterm-SGA for maternal height. Women with short stature have an increased risk of all three adverse pregnancy outcomes.
Table 3.
Multivariate adjusted predictors of term-SGA, preterm-AGA, and preterm-SGA as compared to term-AGA reference
| Characteristic | Term-SGA | Preterm-AGA | Preterm-SGA | |||
|---|---|---|---|---|---|---|
| Adjusted RR (95 % CI) | p-value | Adjusted RR (95 % CI) | p-value | Adjusted RR (95 % CI) | p-value | |
| Maternal age | ||||||
| < 20 years | 1.19 (1.06–1.32) | 0.002 | 1.24 (1.10–1.39) | <0.001 | 0.90 (0.29–2.80) | 0.860 |
| 20–25 years | 1.07 (0.98–1.17) | 0.135 | 1.16 (1.06–1.27) | 0.001 | 2.22 (0.93–5.29) | 0.072 |
| 25–30 years | Ref. | Ref. | Ref. | |||
| 30–35 years | 0.98 (0.89–1.09) | 0.769 | 0.93 (0.83–1.03) | 0.150 | 3.33 (1.33–8.35) | 0.010 |
| ≥ 35 years | 1.09 (0.93–1.28) | 0.292 | 1.00 (0.86–1.18) | 0.954 | 4.66 (1.39–15.67) | 0.013 |
| Maternal education | ||||||
| No formal schooling | 0.88 (0.76–1.02) | 0.091 | 1.03 (0.91–1.17) | 0.651 | 1.64 (0.61–4.41) | 0.327 |
| Some primary | 1.01 (0.88–1.15) | 0.913 | 1.11 (0.98–1.26) | 0.108 | 1.38 (0.47–4.05) | 0.559 |
| Completed primary | Ref. | Ref. | Ref. | |||
| Secondary plus | 0.87 (0.77–0.98) | 0.018 | 0.95 (0.84–1.07) | 0.387 | 1.33 (0.58–3.01) | 0.499 |
| Paternal education | ||||||
| No formal schooling | 0.80 (0.66–0.98) | 0.028 | 1.08 (0.93–1.26) | 0.319 | 0.39 (0.05–3.06) | 0.374 |
| Some primary | 0.98 (0.84–1.14) | 0.799 | 1.07 (0.93–1.24) | 0.334 | 1.15 (0.34–3.87) | 0.826 |
| Completed primary | Ref. | Ref. | Ref. | |||
| Secondary plus | 0.98 (0.89–1.08) | 0.689 | 0.85 (0.77–0.95) | 0.004 | 1.21 (0.57–2.55) | 0.625 |
| Dar es Salaam wealth quintile | ||||||
| Q1 (Poorest) | 1.26 (1.00–1.60) | 1.21 (1.00–1.46) | 3.00 (0.59–15.27) | |||
| Q2 | 1.34 (1.08–1.67) | 1.10 (0.92–1.32) | 2.06 (0.41–10.39) | |||
| Q3 | 1.18 (0.94–1.49) | 1.08 (0.89–1.31) | 0.43 (0.04–4.73) | |||
| Q4 | 1.15 (0.93–1.42) | 1.08 (0.90–1.29) | 1.40 (0.28–6.97) | |||
| Q5 (Richest) | Ref. | 0.057* | Ref. | 0.076* | Ref. | 0.827* |
| Morogoro wealth quintile | ||||||
| Q1 (Poorest) | 1.00 (0.90–1.12) | 1.49 (1.32–1.68) | 1.67 (0.67–4.25) | |||
| Q2 | 0.95 (0.86–1.06) | 1.39 (1.24–1.56) | 1.34 (0.54–3.29) | |||
| Q3 | 1.00 (0.90–1.11) | 1.13 (1.00–1.28) | 0.66 (0.22–1.99) | |||
| Q4 | 0.95 (0.86–1.05) | 1.23 (1.09–1.37) | 1.64 (0.73–3.67) | |||
| Q5 (Richest) | Ref. | 0.432* | Ref. | <0.001* | Ref. | 0.842* |
| Trimester of first ANC visit | ||||||
| 1st Trimester | 0.98 (0.88–1.09) | 0.712 | 0.86 (0.76–0.96) | 0.009 | 1.33 (0.61–2.89) | 0.475 |
| 2nd Trimester | Ref. | Ref. | Ref. | |||
| 3rd Trimester | 1.13 (1.02–1.26) | 0.025 | 1.06 (0.94–1.19) | 0.323 | 1.83 (0.84–9.98) | 0.127 |
| Maternal height | ||||||
| < 150 cm | 1.60 (1.33–1.94) | 1.34 (1.09–1.66) | 5.92 (1.50–23.30) | |||
| 150.0–154.9 cm | 1.24 (1.06–1.46) | 1.22 (1.04–1.43) | 2.58 (0.72–9.32) | |||
| 155.0–159.9 cm | 1.17 (1.00–1.37) | 1.13 (0.97–1.33) | 1.64 (0.44–6.08) | |||
| ≥ 160.0 cm | Ref. | <0.001* | Ref. | <0.001* | Ref. | 0.042 |
| Parity | ||||||
| First born | 1.56 (1.42–1.70) | <0.001 | 1.15 (1.05–1.26) | 0.003 | 3.21 (1.63–6.33) | 0.001 |
| 2nd–4th birth | Ref. | Ref. | Ref. | |||
| 5th or greater | 0.75 (0.64–0.86) | <0.001 | 0.99 (0.87–1.12) | 0.869 | 0.45 (0.14–1.42) | 0.174 |
| Infant sex | ||||||
| Male | 1.09 (1.02–1.16) | 0.007 | 1.05 (0.98–1.12) | 0.134 | 1.02 (0.62–1.67) | 0.947 |
| Female | Ref. | Ref. | Ref. | |||
*p-value for trend
AGA Appropriate for gestational age, ANC Antenatal clinic, CI Confidence interval, SGA Small for gestational age, RR Relative risk
Fig. 1.
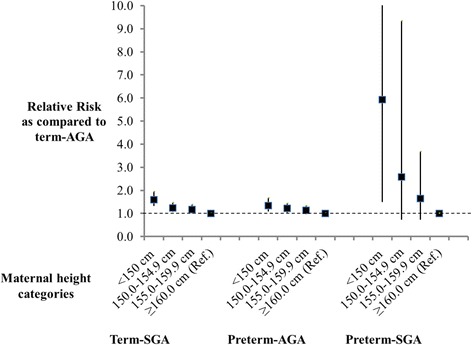
Relative risk of term-SGA, preterm-AGA and preterm-SGA for maternal height categories as compared to ≥160.0 cm reference
Sensitivity analyses utilizing a preterm definition of <34 weeks and SGA as defined by <3rd percentile are presented in Appendix 2: Table 5 and Appendix 3: Table 6. We were unable to present risk factors for preterm-SGA in sensitivity analyses utilizing these more extreme definitions due to the small number of infants in this category (n = 2). Young maternal age, late ANC, short maternal stature, starting ANC in 3rd trimester, and firstborns remained significant risk factors for term-SGA (<3rd percentile) and were of similar magnitude (Appendix 2: Table 5). In addition, maternal secondary education was significantly associated with reduced risk of term-SGA (<3rd percentile). As for preterm (<34 weeks) –SGA, young maternal age and decreased wealth in Morogoro region remained significant predictors (Appendix 3: Table 6). In addition, decreased wealth in Dar es Salaam approached statistical significance as a predictor of preterm (<34 weeks) –SGA.
Discussion
In this analysis we found both common and distinct risk factors for term-SGA, preterm-AGA, and preterm-SGA births. Short maternal stature and being firstborn were significant risk factors for all three pregnancy outcomes. Young maternal age was a risk factor for both term-SGA and preterm-AGA, while advanced maternal age over 30 years was associated with increased risk for preterm-SGA. Additional risk factors for term-SGA were starting ANC late in the third trimester of pregnancy and male sex. Poor socioeconomic status for women residing in the rural setting increased the risk for preterm-AGA, while starting ANC early in the first trimester of pregnancy was protective.
We determined that young maternal age was associated with an increased risk of term-SGA and preterm-AGA, whereas maternal age >30 years was associated with increased risk of preterm-SGA. A similar pattern was also seen in a study differentiating risks of preterm and SGA births in Nepal, but results were not statistically significant [14]. The leading biological mechanisms to explain the high risk of adverse birth outcomes of young mothers include maternal-fetal competition for nutrients or incomplete physical maturation which might contribute to adverse neonatal outcomes [15]. As for the relationship of maternal age above 30 years, older women have increased risk for congenital abnormalities and pregnancy comorbidities including hypertension and gestational diabetes which can increase the risk of preterm and SGA [16, 17]. Family planning interventions to prevent unintended early pregnancies may reduce the risk of preterm-AGA and term-SGA births and their consequences, while access to essential newborn care is critical for pregnant women of advanced maternal age due to risk of preterm-SGA births, which carry the highest risk of mortality.
Consistent with other studies which examined the association of maternal anthropometry with pregnancy outcomes [18, 19], we found that short maternal stature, an indicator of chronic malnutrition, was independently associated with increased risk for term-SGA, preterm-AGA and preterm-SGA. The association of short maternal stature and adverse pregnancy outcomes is likely to be due to a combination of increased risk of cephalo-pelvic disproportion and an indicator of poor supply of nutrients to the fetus due to maternal malnutrition [20, 21]. Our results also confirm the association between short maternal stature and pregnancy outcomes appears to be stronger for SGA as compared to PTB [22].
Being firstborn was associated with risk of all combinations of preterm and SGA birth outcomes. This finding matches with findings from rural Nepal and a meta-analysis examining parity and maternal age as risk factors for PTB and SGA [11, 14]. From the meta-analysis, it was suggested that the association with PTB was largely driven by young maternal age and/or its interaction with null parity. Starting ANC late in the third trimester of pregnancy was associated with increased risk for term-SGA as compared to the second trimester, while starting ANC early in the first trimester of pregnancy reduced risk of preterm-AGA. The mechanism leading to this association may be a combination of early detection and management of pregnancy related health conditions and increased duration of standard pregnancy interventions like iron and folic acid supplementation and sulphadoxine pyrimethamine (SP) for prevention of malaria in pregnancy [23].
There are few limitations to our analysis. First, exclusion of newborns that were unable to feed orally in the parent trial may have underestimated the burden of PTB and SGA, as well as biased associations determined in this paper. Nevertheless, only 38 infants were excluded from the trial due to inability to feed orally, which is likely to have a negligible effect on our estimates based on 19,269 births. In addition, we were limited by data collected in the primary neonatal vitamin A supplementation trial and did not have information to evaluate or control for other known risk factors for adverse birth outcomes including: pre-pregnancy BMI, weight gain during pregnancy, history of chronic diseases like hypertension and diabetes, birth intervals, and previous history of PTB and SGA [24, 25]. Lastly, preterm and SGA were defined using maternal report of LMP, which likely lead to some misclassification. Nevertheless, errors in maternal report of LMP are likely not systematically related to both birth outcomes and risk factors of interest which would lead to underestimation of the associations of interest.
Conclusion
This study identified common and unique risk factors for term-SGA, preterm-AGA and preterm-SGA ranging from anthropometric, economic, demographic and behavioral factors. Some of the risk factors like late ANC attendance, young maternal age at conception, short maternal stature, and poverty are potentially modifiable, and provide an opportunity to improve birth outcomes. In addition, due to high burden of preterm and SGA births in both urban and rural settings in Tanzania, it is vital to advocate for universal access to essential newborn care within the country and similar settings. Overall, targeted combinations of prevention and treatment interventions during pregnancy may decrease the burden of preterm and SGA births and provide substantial reductions in child mortality, morbidity, growth and developmental delay in resource-limited settings.
Ethics approval and consent to participate
The study protocol was approved by the Institutional Review Boards of the Harvard T.H. Chan School of Public Health, Ifakara Health Institute, Medical Research Coordinating Council of Tanzania, and by the WHO Ethical Review Committee. Individual informed consent was sought from at least one parent of every infant who was enrolled in the trial.
Consent for publication
Not applicable.
Availability of data and materials
Please contact Professor Wafaie Fawzi (mina@hsph.harvard.edu) or Dr. Honorati Masanja (hmasanja@ihi.or.tz) for data requests.
Acknowledgements
We thank the mothers and their newborns for participating voluntarily in this study and the communities where the primary trial was carried out for their support and cooperation. We also thank the administrative authorities of Kinondoni, Ilala and Temeke districts in Dar es Salaam region; Kilombero, Ulanga and Kilosa districts in Morogoro region for their unlimited support. Special thanks to administrative staff of hospitals, health centers and dispensaries where the study was conducted. We acknowledge coordinators, supervisors, research assistants, field supervisors, interviewers and HDSS staff at Ifakara Health Institute for their tireless efforts that made the primary trial successful.
Funding
The primary trial was funded through a grant from Bill and Melinda Gates Foundation to the World Health Organization (WHO). Bill and Melinda Gates Foundation did not have any role in the design of study, data collection, analysis and interpretation of the findings as well as in the writing of the manuscript.
Abbreviations
- AGA
appropriate-for-gestational age
- ANC
antenatal care clinic
- HDSS
Health and demographic surveillance system
- IUGR
intrauterine fetal growth restriction
- LBW
low birthweight
- LMICs
low and middle income countries
- LMP
last normal menstrual period
- PTB
preterm birth
- RR
relative risk
- SGA
small-for-gestational age
- WHO
World health organization
Appendix 1
Table 4.
Comparison of baseline characteristics of singleton trial participants who were able to recall LMP versus those who were not able to recall LMP
| Able to Recall LMP (n = 19,269) | Unable to recall LMP (n = 11,622) | |
|---|---|---|
| Maternal age (years) | 25.8 ± 5.9 | 26.0 ± 5.9 |
| Maternal education | ||
| No formal schooling | 1,445 (7.5) | 1,111 (9.6) |
| Some primary | 1,311 (6.8) | 920 (7.9) |
| Completed primary | 13,294 (69.0) | 8,054 (69.3) |
| Secondary and advanced | 2,019 (10.5) | 882 (7.6) |
| Paternal education | ||
| No formal schooling | 801 (4.2) | 607 (5.2) |
| Some primary | 926 (4.8) | 787 (6.8) |
| Completed primary | 13,148 (68.2) | 8,149 (70.1) |
| Secondary and Advanced | 3,209 (16.7) | 1,446 (12.4) |
| Wealth quintile | ||
| Q1 (Poorest) | 3,073 (16.0) | 2,451 (21.1) |
| Q2 | 4,085 (21.2) | 2,582 (22.2) |
| Q3 | 3,124 (16.2) | 1,807 (15.6) |
| Q4 | 4,440 (23.0) | 2,301 (19.8) |
| Q5 (Richest) | 3,432 (17.8) | 1,631 (14.0) |
| Trimester of first ANC visit | ||
| 1st Trimester | 1,858 (9.6) | 817 (7.0) |
| 2nd Trimester | 11,339 (58.9) | 7,730 (66.5) |
| 3rd Trimester | 1,630 (23.1) | 1,186 (10.2) |
| Maternal height (cm) | 155.3 ± 5.2 | 155.7 ± 4.5 |
| Infant Sex | ||
| Female | 9,306 (48.3) | 5,390 (46.4) |
| Male | 9,963 (51.7) | 6,232 (53.6) |
| Parity | ||
| First born | 4,621 (24.0) | 2,953 (25.4) |
| 2nd-4th birth | 8,918 (46.3) | 5,287 (45.4) |
| 5th or greater birth | 1,996 (10.4) | 1,618 (13.9) |
ANC Antenatal clinic, LMP Last Menstrual period
Appendix 2
Table 5.
Unadjusted and multivariate adjusted predictors of term (≥37 weeks) -SGA (<3rd percentile)
| Term-AGA (>3 %) | Term (≥37 weeks) -SGA (<3rd percentile) | |||||
|---|---|---|---|---|---|---|
| Characteristic | % (n = 14,738) |
% (n = 1,479) |
Unadjusted RR (95 % CI) | p-value | Multivariate adjusted RR (95 % CI) | p-value |
| Maternal age | ||||||
| < 20 years | 13.4 | 21.7 | 1.78 (1.54–2.05) | <0.001 | 1.21 (1.02–1.43) | 0.027 |
| 20–25 years | 30.3 | 32.9 | 1.25 (1.09–1.43) | <0.001 | 1.07 (0.94–1.23) | 0.304 |
| 25–30 years | 28.0 | 23.8 | Ref. | Ref. | ||
| 30–35 years | 21.5 | 17.1 | 0.94 (0.80–1.10) | 0.428 | 1.00 (0.85–1.17) | 0.979 |
| ≥ 35 years | 6.8 | 4.4 | 0.78 (0.60–1.00) | 0.054 | 0.86 (0.65–1.13) | 0.270 |
| Maternal education | ||||||
| No formal schooling | 8.0 | 5.5 | 0.68 (0.54–0.85) | 0.001 | 0.78 (0.62–0.99) | 0.042 |
| Some primary | 7.0 | 7.1 | 0.97 (0.80–1.18) | 0.787 | 1.09 (0.89–1.33) | 0.406 |
| Completed primary | 73.5 | 77.1 | Ref. | Ref. | ||
| Secondary plus | 11.5 | 10.3 | 0.87 (0.74–1.03) | 0.100 | 0.84 (0.70–1.00) | 0.054 |
| Paternal education | ||||||
| No formal schooling | 4.2 | 3.7 | 0.85 (0.65–1.11) | 0.235 | 0.94 (0.71–1.25) | 0.679 |
| Some primary | 5.0 | 4.8 | 0.93 (0.73–1.18) | 0.541 | 0.95 (0.75–1.21) | 0.668 |
| Completed primary | 75.8 | 72.3 | Ref. | Ref. | ||
| Secondary plus | 15.7 | 18.5 | 0.82 (0.72–0.95) | 0.007 | 0.83 (0.71–0.97) | 0.016 |
| Dar es Salaam wealth quintile | ||||||
| Q1 (Poorest) | 15.0 | 16.3 | 1.16 (0.82–1.64) | 1.02 (0.71–1.45) | ||
| Q2 | 22.3 | 29.1 | 1.36 (1.00–1.86) | 1.24 (0.90–1.70) | ||
| Q3 | 17.2 | 14.5 | 0.91 (0.64–1.31) | 0.85 (0.59–1.22) | ||
| Q4 | 31.0 | 26.6 | 0.92 (0.67–1.27) | 0.91 (0.67–1.26) | ||
| Q5 (Richest) | 14.5 | 13.5 | Ref. | 0.020* | Ref. | 0.717* |
| Morogoro wealth quintile | ||||||
| Q1 (Poorest) | 16.9 | 17.0 | 0.96 (0.79–1.15) | 1.22 (1.00–1.49) | ||
| Q2 | 21.8 | 18.2 | 0.81 (0.67–0.97) | 0.94 (0.77–1.13) | ||
| Q3 | 17.8 | 19.3 | 1.03 (0.86–1.23) | 1.19 (1.00–1.44) | ||
| Q4 | 20.9 | 21.5 | 0.98 (0.82–1.16) | 1.08 (0.90–1.29) | ||
| Q5 (Richest) | 22.7 | 24.0 | Ref. | 0.153* | Ref. | 0.324* |
| Trimester of first ANC visit | ||||||
| 1st Trimester | 12.9 | 11.6 | 0.91 (0.77–1.09) | 0.300 | 0.89 (0.74–1.05) | 0.169 |
| 2nd Trimester | 76.4 | 76.0 | Ref. | Ref. | ||
| 3rd Trimester | 10.8 | 12.5 | 1.15 (0.97–1.36) | 0.100 | 1.23 (1.00–1.55) | 0.014 |
| Maternal height | ||||||
| < 150 cm | 8.1 | 13.5 | 1.94 (1.47–2.57) | 1.65 (1.25–2.19) | ||
| 150.0–154.9 cm | 33.4 | 31.2 | 1.17 (0.92–1.48) | 1.09 (0.86–1.38) | ||
| 155.0–159.9 cm | 37.8 | 39.0 | 1.18 (1.02–1.61) | 1.18 (0.94–1.49) | ||
| ≥ 160.0 cm | 20.7 | 16.3 | Ref. | 0.001* | Ref. | 0.005* |
| Parity | ||||||
| First born | 27.6 | 45.1 | 1.87 (1.69–2.07) | <0.001 | 1.79 (1.57–2.05) | <0.001 |
| 2nd–4th birth | 58.9 | 46.2 | Ref. | Ref. | ||
| 5th or greater | 13.4 | 8.7 | 0.81 (0.67–0.99) | 0.039 | 0.88 (0.71–1.10) | 0.267 |
| Infant sex | ||||||
| Male | 52.1 | 46.4 | 0.81 (0.75–0.90) | <0.001 | 0.82 (0.74–0.90) | <0.001 |
| Female | 47.9 | 53.6 | Ref. | Ref. | ||
*p-value for trend
AGA Appropriate for gestational age, ANC Antenatal clinic, CI Confidence interval, SGA Small for gestational age, RR Relative risk
Appendix 3
Table 6.
Unadjusted and multivariate adjusted predictors of preterm (<34 weeks)-SGA (<10th percentile)
| Term-AGA (>10 %) | Preterm (<34 weeks)-SGA (<10th percentile) | |||||
|---|---|---|---|---|---|---|
| Characteristic | % (n = 15,522) |
% (n = 633) |
Unadjusted RR (95 % CI) | p-value | Multivariate adjusted RR (95 % CI) | p-value |
| Maternal age | ||||||
| < 20 years | 13.1 | 19.1 | 1.66 (1.31–2.10) | <0.001 | 1.46 (1.11–1.92) | 0.007 |
| 20–25 years | 30.6 | 35.4 | 1.33 (1.08–1.64) | 0.006 | 1.27 (1.02–1.57) | 0.029 |
| 25–30 years | 28.0 | 24.1 | Ref. | Ref. | ||
| 30–35 years | 21.5 | 15.3 | 0.84 (0.65–1.08) | 0.174 | 1.00 (0.85–1.17) | 0.979 |
| ≥ 35 years | 6.8 | 6.1 | 1.05 (0.74–1.50) | 0.787 | 0.86 (0.65–1.13) | 0.270 |
| Maternal education | ||||||
| No formal schooling | 8.3 | 8.1 | 0.99 (0.74–1.33) | 0.942 | 0.92 (0.67–1.26) | 0.599 |
| Some primary | 7.3 | 6.9 | 0.96 (0.70–1.32) | 0.789 | 0.86 (0.62–1.20) | 0.382 |
| Completed primary | 73.1 | 72.0 | Ref. | Ref. | ||
| Secondary plus | 13.0 | 11.3 | 1.16 (0.91–1.47) | 0.233 | 1.24 (0.95–1.61) | 0.114 |
| Paternal education | ||||||
| No formal schooling | 4.6 | 4.9 | 1.06 (0.73–1.54) | 0.774 | 0.96 (0.64–1.43) | 0.838 |
| Some primary | 5.1 | 6.5 | 1.26 (0.91–1.76) | 0.161 | 1.15 (0.82–1.61) | 0.430 |
| Completed primary | 72.3 | 72.0 | Ref. | Ref. | ||
| Secondary plus | 18.0 | 16.7 | 0.94 (0.75–1.17) | 0.565 | 0.94 (0.74–1.20) | 0.626 |
| Dar es Salaam wealth quintile | ||||||
| Q1 (Poorest) | 15.1 | 21.9 | 1.76 (1.16–2.68) | 1.73 (1.11–2.69) | ||
| Q2 | 22.5 | 20.1 | 1.11 (0.73–1.71) | 1.07 (0.69–1.68) | ||
| Q3 | 17.0 | 16.4 | 1.20 (0.77–1.88) | 1.15 (0.73–1.82) | ||
| Q4 | 30.7 | 29.9 | 1.21 (0.81–1.81) | 1.20 (0.79–1.80) | ||
| Q5 (Richest) | 14.7 | 11.7 | Ref. | 0.028* | Ref. | 0.053* |
| Morogoro wealth quintile | ||||||
| Q1 (Poorest) | 17.1 | 27.1 | 2.22 (1.56–3.16) | 1.82 (1.23–2.68) | ||
| Q2 | 22.3 | 21.8 | 1.40 (0.97–2.02) | 1.20 (0.81–1.78) | ||
| Q3 | 16.7 | 13.6 | 1.17 (0.77–1.76) | 1.05 (0.69–1.62) | ||
| Q4 | 19.9 | 19.6 | 1.40 (0.96–2.04) | 1.24 (0.84–1.84) | ||
| Q5 (Richest) | 21.0 | 14.5 | Ref. | <0.001* | Ref. | 0.006* |
| Trimester of first ANC visit | ||||||
| 1st Trimester | 12.7 | 10.7 | 0.86 (0.65–1.14) | 0.293 | 0.81 (0.61–1.08) | 0.153 |
| 2nd Trimester | 76.6 | 76.2 | Ref. | Ref. | ||
| 3rd Trimester | 10.7 | 13.0 | 1.21 (0.93–1.57) | 0.152 | 1.24 (0.96–1.61) | 0.803 |
| Maternal height | ||||||
| < 150 cm | 7.9 | 12.9 | 1.57 (1.01–2.42) | 1.42 (0.92–2.20) | ||
| 150.0–154.9 cm | 33.8 | 34.6 | 1.01 (0.71–1.42) | 0.95 (0.67–1.34) | ||
| 155.0–159.9 cm | 37.9 | 31.7 | 0.83 (0.58–1.17) | 0.80 (0.56–1.13) | ||
| ≥ 160.0 cm | 20.5 | 20.8 | Ref. | 0.099* | Ref. | 0.613* |
| Parity | ||||||
| First born | 26.9 | 34.6 | 1.36 (1.15–1.62) | <0.001 | 1.12 (0.90–1.39) | 0.318 |
| 2nd–4th birth | 59.2 | 55.1 | Ref. | Ref. | ||
| 5th or greater | 13.8 | 10.3 | 0.80 (0.61–1.07) | 0.130 | 0.85 (0.62–1.17) | 0.333 |
| Infant sex | ||||||
| Male | 51.3 | 52.1 | 1.03 (0.89–1.21) | 0.663 | 1.04 (0.90–1.22) | 0.572 |
| Female | 48.8 | 47.9 | Ref. | Ref. | ||
*p-value for trend
AGA Appropriate for gestational age, ANC Antenatal clinic, CI Confidence interval, SGA Small for gestational age, RR Relative risk
Footnotes
Competing interests
The authors declare that they have no competing interests.
Authors’ contributions
AM, ERS, HM and WF drafted the article with contributions from all authors. AM, SM, CB, RN, and MB participated in data collection. All authors participated in monitoring field implementation of the primary trial and quality of data. AM, ERS, CRS and GC contributed to statistical analyses. All authors read and approved the final version of the paper.
References
- 1.UNICEF and WHO. Low Birth Weight: Country, Regional and Global Estimates. New York. 2004. http://www.unicef.org/publications/index_24840.html. Accessed 15 Jun 2015.
- 2.Blencowe H, Cousens S, Oestergaard MZ, Chou D, Moller A-B, Narwal R, et al. National, regional, and worldwide estimates of preterm birth rates in the year 2010 with time trends since 1990 for selected countries: a systematic analysis and implications. Lancet. 2012;379:2162–72. doi: 10.1016/S0140-6736(12)60820-4. [DOI] [PubMed] [Google Scholar]
- 3.Berkowitz GS, Papiernik E. Epidemiology of preterm birth. Epidemiol Rev. 1993;15:414–43. doi: 10.1093/oxfordjournals.epirev.a036128. [DOI] [PubMed] [Google Scholar]
- 4.Kramer MS. Determinants of low birth weight: methodological assessment and meta-analysis. Bull World Health Organ. 1987;65:663–737. [PMC free article] [PubMed] [Google Scholar]
- 5.Lee ACC, Katz J, Blencowe H, Cousens S, Kozuki N, Vogel JP, et al. National and regional estimates of term and preterm babies born small for gestational age in 138 low-income and middle-income countries in 2010. Lancet Glob Heal. 2013;1:e26–36. doi: 10.1016/S2214-109X(13)70006-8. [DOI] [PMC free article] [PubMed] [Google Scholar]
- 6.Katz J, Lee ACC, Kozuki N, Lawn JE, Cousens S, Blencowe H, et al. Mortality risk in preterm and small-for-gestational-age infants in low-income and middle-income countries: a pooled country analysis. Lancet. 2013;382:417–25. doi: 10.1016/S0140-6736(13)60993-9. [DOI] [PMC free article] [PubMed] [Google Scholar]
- 7.Sania A, Spiegelman D, Rich-Edwards J, Okuma J, Kisenge R, Msamanga G, Urassa W, Fawzi WW. The contribution of preterm birth and intrauterine growth restriction to infant mortality in Tanzania. Paediatr Perinat Epidemiol. 2014;28:23–31. doi: 10.1111/ppe.12085. [DOI] [PMC free article] [PubMed] [Google Scholar]
- 8.Blencowe H, Cousens S, Chou D, Oestergaard M, Say L, Moller A-B, Kinney M, Lawn J. Born too soon: the global epidemiology of 15 million preterm births. Reprod Health. 2013;10 Suppl 1:S2. doi: 10.1186/1742-4755-10-S1-S2. [DOI] [PMC free article] [PubMed] [Google Scholar]
- 9.Christian P, Lee SE, Angel MD, Adair LS, Arifeen SE, Ashorn P, et al. Risk of childhood undernutrition related to small-for-gestational age and preterm birth in low- and middle-income countries. Int J Epidemiol. 2013;42:1340–55. doi: 10.1093/ije/dyt109. [DOI] [PMC free article] [PubMed] [Google Scholar]
- 10.Hernández MI, Mericq V. Metabolic syndrome in children born small-for-gestational age. Arq Bras Endocrinol Metabol. 2011;55:583–9. doi: 10.1590/S0004-27302011000800012. [DOI] [PubMed] [Google Scholar]
- 11.Kozuki N, Lee AC, Silveira MF, Victora CG, Adair L, Humphrey J, et al. The associations of birth intervals with small-for-gestational-age, preterm, and neonatal and infant mortality: a meta-analysis. BMC Public Health. 2013;13 Suppl 3:S3. doi: 10.1186/1471-2458-13-S3-S3. [DOI] [PMC free article] [PubMed] [Google Scholar]
- 12.Masanja H, Smith ER, Muhihi A, Briegleb C, Mshamu S, Ruben J, et al. Effect of neonatal vitamin A supplementation on mortality in infants in Tanzania (Neovita): a randomised, double-blind, placebo-controlled trial. Lancet. 2014;385(9975):1324–32. doi: 10.1016/S0140-6736(14)61731-1. [DOI] [PMC free article] [PubMed] [Google Scholar]
- 13.Papageorghiou AT, Ohuma EO, Altman DG, Todros T, Cheikh Ismail L, Jaffer YA, Bertino E, Gravett MG, Purwar M, Noble JA, Pang R, Victora CG, Barros FC, Carvalho M, Salomon LJ, Bhutta ZA, Kennedy SH, Villar J. International standards for fetal growth based on serial ultrasound measurements: the Fetal Growth Longitudinal Study of the INTERGROWTH-21st Project. Lancet. 2014;384:869–79. doi: 10.1016/S0140-6736(14)61490-2. [DOI] [PubMed] [Google Scholar]
- 14.Kozuki N, Katz J, LeClerq SC, Khatry SK, West KP, Christian P. Risk factors and neonatal/infant mortality risk of small-for-gestational-age and preterm birth in rural Nepal. J Matern Fetal Neonatal Med. 2015;28(9):1019-25. [DOI] [PubMed]
- 15.Kramer K, Lancaster J. Teen Motherhood in cross-cultural perspective. Ann Hum Biol. 2010;37:613–28. doi: 10.3109/03014460903563434. [DOI] [PubMed] [Google Scholar]
- 16.Carolan M, Frankowska D. Advanced maternal age and adverse perinatal outcome: a review of the evidence. Midwifery. 2011;27:793–801. doi: 10.1016/j.midw.2010.07.006. [DOI] [PubMed] [Google Scholar]
- 17.Yogev Y, Melamed N, Bardin R, Tenenbaum-Gavish K, Ben-Shitrit G, Ben-Haroush A. Pregnancy outcome at extremely advanced maternal age. Am J Obs Gynecol. 2010;203(558e):558e–1–558–e.7. doi: 10.1016/j.ajog.2010.07.039. [DOI] [PubMed] [Google Scholar]
- 18.Panaretto K, Lee H, Mitchell M, Larkins S, Manessis V, Buettner P, Watson D. Risk factors for preterm, low birth weight and small for gestational age birth in urban Aboriginal and Torres Strait Islander women in Townsville. Aust N Z J Public Health. 2006;30:163–70. doi: 10.1111/j.1467-842X.2006.tb00111.x. [DOI] [PubMed] [Google Scholar]
- 19.Rodrigues T, Barros H. Comparison of risk factors for small-for-gestational-age and preterm in a Portuguese cohort of newborns. Matern Child Health J. 2007;11:417–24. doi: 10.1007/s10995-007-0195-2. [DOI] [PubMed] [Google Scholar]
- 20.Van Roosmalen J, Brand R. Maternal height and the outcome of labor in rural Tanzania. Int J Gynaecol Obs. 1992;37:169–77. doi: 10.1016/0020-7292(92)90377-U. [DOI] [PubMed] [Google Scholar]
- 21.Rush D. Nutrition and maternal mortality in the developing world. Am J Clin Nutr. 2000;72(Suppl 1):212S–40. doi: 10.1093/ajcn/72.1.212S. [DOI] [PubMed] [Google Scholar]
- 22.Heaman M, Kingston D, Chalmers B, Sauve R, Lee L, Young D. Risk factors for preterm birth and small-for-gestational-age births among Canadian women. Paediatr Perinat Epidemiol. 2013;27:54–61. doi: 10.1111/ppe.12016. [DOI] [PubMed] [Google Scholar]
- 23.Rijken MJ, De Livera AM, Lee SJ, Boel ME, Rungwilailaekhiri S, Wiladphaingern J, et al. Quantifying low birth weight preterm birth and small-for-gestational-age effects of malaria in pregnancy: a population cohort study. PLoS One. 2014;9:e100247. doi: 10.1371/journal.pone.0100247. [DOI] [PMC free article] [PubMed] [Google Scholar]
- 24.Kogan MD. Social causes of low birth weight. J R Soc Med. 1995;88:611–5. doi: 10.1177/014107689508801103. [DOI] [PMC free article] [PubMed] [Google Scholar]
- 25.Esimai O, Ojofeitimi E. Pattern and determinants of gestational weight gain an important predictor of infant birth weight in a developing country. Glob J Heal Sci. 2014;6:34808. doi: 10.5539/gjhs.v6n4p148. [DOI] [PMC free article] [PubMed] [Google Scholar]
Associated Data
This section collects any data citations, data availability statements, or supplementary materials included in this article.
Data Availability Statement
Please contact Professor Wafaie Fawzi (mina@hsph.harvard.edu) or Dr. Honorati Masanja (hmasanja@ihi.or.tz) for data requests.