

Abstract
Lipid coated calcium phosphate (LCP) nanoparticles (NPs) remain an attractive option for siRNA systemic delivery. Previous research has shown that the stoichiometry of reactants affects the size and morphology of nanostructured calcium phosphate (CaP) particles. However, it is unclear how synthesis parameters such as the Ca/P molar ratio and mixing style influence the siRNA loading and protection by LCP NPs, and subsequent siRNA delivery efficiency. In this research, we found that the Ca/P molar ratio is critical in controlling the size, zeta potential, dispersion state, siRNA loading and protection. Based on the siRNA loading efficiency and capacity as well as siRNA protection effectiveness, we suggested an optimized LCP NPs delivery system. The optimized LCP NPs had a hollow, spherical structure with the average particle size of ~40 nm and were able to maintain their stability in serum containing media and PBS for over 24 h, with a pH-sensitive dissolution property. The superior ability of optimized LCP NPs to maintain the integrity of encapsulated siRNA and the colloidal stability in culture medium allow this formulation to achieve improved cellular accumulation of siRNA and enhanced growth inhibition of human breast cancer cells in vitro, compared with the commercial transfection agent Oligofectamine™.
Keywords: Calcium phosphate nanoparticle, Lipid bilayer coating, siRNA delivery, Gene loading efficiency, Cellular uptake
Graphical Abstract
The optimized lipid coated calcium phosphate nanoparticles more efficiently deliver functional siRNA and inhibit the cancer cell growth, in comparison with the commercial transfection agent Oligofactamine™.
1. Introduction
RNA interference technology has stood out as one of the most attractive anti-tumor therapeutics because of its revolutionary potency and selectivity for targeted gene silencing.1 Although siRNA offers several advantages as potential new drugs, challenges for overcoming its inherent instability against nucleases and poor bioavailability remain unsolved effectively.2, 3 Therefore, efficient and biocompatible delivery vectors of siRNA are required to achieve its full therapeutic potential. It is true that siRNA-based therapeutics share the physicochemical characteristics similar to plasmid DNA, the short and unbendable structure of double-stranded siRNA/dsDNA does not allow it to form nano-scale complexes with cationic polymers as tight as plasmid DNA, resulting in loose siRNA-polymer complexes and reduced delivery efficacy.4–6 Moreover, issues of potential toxicity of these conventional carriers have not been resolved yet.7–9
Calcium phosphate (CaP) in the nanomaterial form has excellent properties as a nanocarrier of siRNA for cancer genotherapy.10–12 Calcium phosphates are of high biocompatibility and good biodegradability as they constitute the major inorganic phase of human hard tissues.13 Calcium ions are also known to form complexes with the nucleic acid backbone and thus may protect the double-stranded siRNA products from attack by serum nucleases.14, 15 Moreover, CaPs are dissolvable at low pH (around 4–5), e.g. in lysosomes after the cellular uptake or in the environment of solid tumors, thereby releasing incorporated therapeutics.10, 16–18 Recently, by stabilizing the CaP core with cationic lipid layer, Huang et al. developed a lipid-coated calcium phosphate nanoparticles (LCP NPs), which possess a colloidal stability in aqueous solution and demonstrate a significant (~40-fold in vitro and ~4-fold in vivo) improvement in siRNA delivery compared with their previous lipid/protamine/DNA (LPD) formulation.19, 20
The LCP NP was prepared by using microemulsion technology to form calcium phosphate (CaP) core and then coated with a second lipid.19, 20 During the synthesis of CaP NPs, an amphiphilic anionic lipid, dioleoylphosphatidic acid (DOPA), was added into the microemulsion. The amphiphilic DOPA stays at the interface of microemulsions and interacts with the precipitated CaP NPs through binding with the surface Ca2+. The NPs are then coated with a second layer of lipids. The formation of CaP nanoprecipitate in microemulsions has been described as a fairly complicated process, dependent on several preparation parameters, such as calcium and phosphate ion concentration, ionic strength, pH, temperature, and nature and concentration of surfactants.14, 21 The ratio of Ca2+ to HxPO4x-3 (Ca/P) is also important because the ratio may trigger precipitation of a specific phase combination and thus initiate different kinetic pathways for the reaction, leading to precipitation with different properties.14, 21 Previous reports indicate the influence of the stoichiometry of reactants on pure nanostructured CaP, while it is not clear how the Ca/P ratio affects the LCP properties in the presence of DOPA because DOPA may substitute a part of phosphate ions.10, 20, 22 More importantly, the influence of preparation parameters on siRNA loading and protection by LCP NP-based delivery vectors is not well understood.
In this study, we aimed to elucidate the effects of the Ca/P molar ratio as well as the siRNA loading way on (1) the particle size and dispersion state of synthesized LCP NPs; (2) the siRNA loading efficiency and capacity by LCP NPs; and (3) the protection of loaded siRNA from enzyme degradation by LCP NPs. Based on these data, we tentatively determined an optimal LCP NP delivery system, which showed significantly improved cellular uptake efficiency and growth inhibition of human breast cancer cells (MDA-MB-468) when cell death inducing siRNA (CD siRNA) was loaded by LCP NPs. Thus the optimized LCP NPs are potential highly efficient siRNA delivery vectors for cancer treatments in vitro as well as in vivo.
2. Materials and methods
2.1 Materials
Double stranded DNA labelled with Cyanine3 (Cy3-dsDNA) and cell death siRNA (CD-siRNA) were purchased from GeneWorks, phospholipids (DOPA, DOPC) from Avanti Polar Lipid, and other chemicals and reagents from Sigma-Aldrich if not illustrated specifically. Water used in experiments was deionised Milli-Q water.
2.2. LCP NP preparation
LCP NPs were prepared by a modified two-step method based on the previous report.20 The anionic lipid coated CaP cores were prepared by a water-in-oil microemulsion method, and then the second lipid layer was used to coat the CaP core to form the bilayer lipid-coated CaP (LCP) nanoparticles (NPs) via the film-rehydration method. Briefly, 150 μL of 2.5 M CaCl2 was dispersed in 5 mL of mixed cyclohexane/Igepal CO-520 (7/3, v/v,) to form a well-dispersed water-in-oil microemulsion. The similar microemulsion containing sodium phosphate was prepared by dispersing 150 μL Na2HPO4 (pH = 9.0) in another 5 mL of oil phase with the Ca/P molar ratio = 25–400. The sodium phosphate emulsion was first added with 50 μL (20 mM) DOPA in chloroform and then the as-prepared CaCl2 emulsion, followed by stirring for 20 min. The CaP-DOPA cores were collected by adding 10 mL of absolute ethanol and centrifuging at 10,000g for 20 min, followed by washing with ethanol for 3 times. The collected CaP core pellets were then dispersed in 1 mL of chloroform, and mixed with 70 μL of 20 mM DOPC/Cholesterol (1:1). After chloroform evaporation under reduced pressure, the lipid film was then hydrated in PBS buffer (pH = 7.4) or water to obtain LCP NPs, which were normally well dispersed under gentle ultrasound treatment.
2.3. Loading siRNA/dsDNA into LCP NPs
LCP NPs were used to encapsulate siRNA-mimicking Cy3-dsDNA with 4 different loading methods at a fixed Ca/P molar ratio of 100. Briefly, in method 1 (Ca), 40 μg Cy3-dsDNA was first mixed with CaCl2 solution only, and in method 2 (P), Cy3-dsDNA with Na2HPO4 solution only. In method 3 (Ca&P), half amount of Cy3-dsDNA was first mixed with both CaCl2 and Na2HPO4 solution, respectively. The subsequent procedure for making LCP-Cy3-dsDNA NPs was the same as described in section 2.2.
The efficiency of dsDNA encapsulation and the dsDNA-loading capacity in LCP NPs were determined as follows. After LCP-Cy3-dsDNA particles were dissolved in the lysis buffer (2 mM EDTA and 0.05% Triton X-100 in pH 7.8 Tris buffer) by incubating at 65 °C for 10 min, the concentration of Cy3-dsDNA released from dissolved LCP was determined by measuring the fluorescence intensity, and then the amount of dsDNA loaded into the LCP NPs was calculated. All data were reported as the mean value plus the standard deviation in three parallel experiments.
2.4. Serum stability of siRNA encapsulated in LCP NPs
The ability of LCP NPs synthesized at different Ca/P ratios to protect siRNA from degradation by serum enzymes was studied by agarose gel electrophoresis. LCP-CD siRNA NPs were incubated in DMEM medium containing 50% fetal bovine serum (FBS) at 37°C. Then, 20 μL of aliquot was withdrawn at 0, 1, 2 or 4 h, to which an equal volume of lysis buffer (2 mM EDTA and 0.05% Triton X-100 in pH 7.8 Tris buffer) was immediately added to stop the degradation and release the entrapped CD siRNA. After complete dissolution of LCP NPs, 10 μL solution (corresponding to 50 pmol of CD siRNA at 0 h) was loaded to each well and then analyzed by 0.8% agarose gel in TBE buffer (89 mM Tris, 89 mM Boric Acid, and 2 mM EDTA, pH 8.4) containing 5 μL Gel staining safe dye (GelRed™ Nucleic Acid Gel Stain, 10,000× in water, Biotium, USA). Electrophoresis was carried out at a constant voltage of 90 V for 40 min. The image under the fluorescent light was captured by a gel documentation system (Bio-Rad Laboratories, Inc., Hercules, CA).
2.5. Characterization of LCP NPs
The hydrodynamic diameter and zeta potential of LCP NPs were determined at room temperature using a dynamic light scattering device (DLS, Zetasizer Nano, Malvern, UK). To visualize the morphology of CaP cores and LCP NPs, the nanoparticle suspension was dropped onto a 300-mesh carbon coated copper grid and dried on a filter paper at room temperature. The grid was then stained with 2% uranyl acetate and observed in a transmission electron microscope (TEM, JEM-3010, ZEOL, Tokyo, Japan). The crystallinity and composition of LCP NPs were examined by X-Ray Diffraction (XRD) pattern and Fourier transform infrared spectroscopy (FTIR).
2.6. Colloidal stability of LCP NPs
The colloidal stability of LCP NPs (Ca/P molar ratio = 100) was assessed in phosphate buffered saline (PBS, pH 7.4) and medium with 10% FBS by monitoring changes of the average particle size at predetermined time points (0, 0.5, 1, 5, 10, and 24 h, 1 and 2 weeks). Briefly, the samples were prepared by diluting 100 μL of as-prepared LCP NP suspension with medium containing 10% FBS or PBS buffer (pH 7.4) to 1.0 mL and incubated at 4 or 37 °C for a period of predetermined time, and the particle size was measured by DLS.
2.7. pH-sensitive dissolution of LCP NPs
To examine the pH-sensitive gene release, the leaching of Ca2+ from the as-prepared LCP NPs was investigated. A typical experiment was performed as follows. About 10 mg of dry LCP NP powder was dispersed in 50 mL buffer solution with pH of 4.5, 6.5 and 7.4. Thereafter, the resulting suspension was shaken in a sealed vessel at 37°C with a constant shaking rate (140 rpm). The medium (0.4 mL) was withdrawn at given time points (0, 0.25, 0.5, 1, 2, 3, 4, and 24 h) and replaced with the same volume of fresh buffer with the same pH value. The withdrawn liquid was then filtered by 0.22 μm filter and the Ca2+ concentration was determined by inductively coupled plasma optical emission spectrometry (ICP-OES, JY2000-2, Horiba).
2.8. In vitro cellular uptake
The cellular uptake of LCP NPs was quantitatively assessed in the human breast cancer cell line MDA-MB-468, using flow cytometry analysis. Cy3-dsDNA was used to track LCP NPs. MDA-MB-468 cells were seeded at the density of 1.5×10⁵ cells/well in 6-well plates and incubated overnight. Then the culture medium was replaced by 1.0 mL of fresh DMEM (10% FBS) containing LCP NPs (loaded with 5, 25, 50, 150, and 200 nM of Cy3-dsDNA) in each well and the cells were incubated at 37 °C for 4 h. The experiment was terminated by washing the cells 3 times with phosphate-buffered saline (PBS, pH 7.4) to eliminate excess particles. The cells were then fixed with 1.0 mL of 3.8% paraformaldehyde in PBS at room temperature for 20 min, and subsequently analyzed by flow cytometry (Accuri C6 flow cytometer, BD Biosciences). Untreated cells were used to gate the population of viable cells and the gate was applied to the subsequent assays. The mean fluorescence intensity (MFI) was used to indicate the cellular uptake efficiency of LCP-Cy3-dsDNA NPs.
For confocal microscopy, MDA-MB-468 cells were seeded on coverslips at a density of 1.5×10⁵ cells per well in a 6-well plate. After 24 h cultivation, the cells were treated by LCP NPs with 150 nM Cy3-dsDNA for 4 h. Then the cells were washed 3 times with cold PBS (pH 7.4) and fixed with 4% paraformaldehyde. The cell nuclei were stained with 4,6-diamidino-2-phenylindole (DAPI, Invitrogen) for 5 min, followed by another washing with PBS for 3 times. Coverslips were mounted cell-side down with slides and visualized using a Zeiss LSM 510 laser scanning confocal fluorescence microscope (Carl Zeiss MicroImaging GmbH, Oberkochen, Germany).
2.9. In vitro inhibition of cancer cell growth
The growth inhibition of MDA-MB-468 cell line by LCP-CD-siRNA NPs was assessed using MTT assay. Briefly, 2×10³ cells per well were incubated in 200 μL of medium in a 96-well plate overnight (37 °C, 5% CO2). Then, fresh medium containing a range of concentrations of LCP-CD-siRNA NPs (5–80 nM) was added into the plate wells. The wells cultured with fresh media and commercial transfection reagent Oligofectamine™ (Life Technologies, Carlsbad, CA, USA) were used as negative and positive control, respectively. After treatment for 48 h, 20 μL of MTT solution (5 mg mL−1 in PBS) was added into each well. After incubation for 4 h at 37 °C, 100 μL DMSO (Sigma-Aldrich, Castle Hill, Australia, BioReagent, ≥99.9%) was added to dissolve the formazan product. Absorbance readings at 490 nm were measured using a plate reader (Bio-Tek, Winooski, VT, USA). The cell viability (%) was calculated to determine the cell growth inhibitory effects in each group. Every experiment was performed in triplicate and the mean value was reported.
To determine the condition of viable cells in culture media with a range of concentration of LCP-CD-siRNA NPs, cell morphology after siRNA transfection was further observed. Briefly, the cells were plated at the density of 5×10³ cells per well in a 96-well plate overnight. Then, the cells were treated with fresh culture media containing various concentrations of LCP-CD siRNA NPs for 48 h. Cells were washed 3 times with PBS and then stained with 0.4% trypan blue (Sigma, USA) for 3 min to show the cell viability. After staining, the samples were imaged under 10× in bright field (Olympus, Japan).
The cytotoxicity of blank LCP NP on MDA-MB-468 cells was further investigated. Briefly, 2×10³ cells per well were incubated in 200 μL of medium in a 96-well plate overnight (37 °C, 5% CO2), and fresh media containing a range of concentrations of blank LCP NPs (0~400 μg mL−1) was added. After treatment for 48 h, MTT assay was performed to determine the cell viability. Every experiment was performed in triplicate and the mean value was reported.
2.10. Statistical analysis
Data presented as the mean ± SEM or the mean ± SE were analyzed by two-way ANOVA using GraphPad Prism software; a p value < 0.05 was considered statistically significant. *, P < 0.05; **, P < 0.01; ***, P < 0.001.
3. Results and discussion
3.1. The effect of the Ca/P molar ratio on particle size and zeta potential
As shown in Fig. 1, the number-mean particle size of LCP NPs decreased with the increase of Ca/P ratio from 25 to 100, and did not change in the Ca/P ratio from 100 to 400. When Ca/P ratio was 25, the number-mean particle size was 194.4±78.0 nm, which decreased to 73.6±11.2 and 48.4±3.9 nm at the Ca/P ratio of 50 and 100, respectively. The particle size of LCPs synthesized at Ca/P ratios of 200 and 400 (e.g. 45.4±2.0 nm and 47.8±1.9 nm) was similar to that at 100. It has been reported that the calcium to phosphate (Ca/P) molar ratio affects the CaP particle size to some degree,10, 14 in consistence with our observation that the average particle size for the LCP NPs was related to the Ca/P molar ratio.
Fig. 1.

The average particle size and the zeta potential of LCP NPs prepared at varied Ca/P ratios. The data presented as the mean ± SE (n = 3).
Furthermore, the polydispersity index (PDI) value of LCP NPs synthesized at the Ca/P ratio of 100 to 400 was 0.263±0.014, 0.310±0.055 and 0.441±0.141 (Table S1, ESI†), respectively. The PDI value of nanoparticles with the Ca/P ratio < 100 was bigger (Table S1, ESI†), indicating that the particle size distribution was much broader, largely attributed to the formation of aggregates (Fig. S1, ESI†). These data suggest that as the phosphate concentration decreased, the particle size became less fluctuated, yielding smaller and more colloidally stable LCP particles.
Meanwhile, the zeta potential values slightly decreased from −7.5 to −14.7 mV with the increase of the Ca/P ratio (Fig. 1), which may be relevant to the relative amount of DOPA. Since the phospholipid DOPC in the outer layer is charge neutral at pH 7, the possible reason for more negative charges carried by LCP is that there is more anionic lipid DOPA in the inner coating layer. When the Ca/P ratio is high (e.g. 400), the amount of phosphate is far from enough, so more DOPA (with a phosphate group –OPO3H−) would combine Ca ions on the CaP core surface. Since this phosphate-Ca complex (–OPO3H-Ca) can also be deprotonated as –OPO3−-Ca with a negative charge, thus increased amount of DOPA on the LCP NP inner coating layer would lead to an increased negative zeta potential in the case of high Ca/P ratios.
3.2. The effect of the Ca/P molar ratio on siRNA loading and protection
As shown in Fig. 2A, the loading efficiency of Cy3-dsDNA using 3 methods was 39.8±1.2%, 42.4±1.2%, and 66.6±2.4%, respectively, at the Ca/P molar ratio of 100. Obviously, Method 3 (Ca&P) led to the highest encapsulation efficiency (P < 0.001), where half amount of Cy3-dsDNA was separately mixed with calcium and phosphate solution. There was no obvious difference in the loading efficiency between method 1 and 2. A similar loading capacity was reported by Li et al. for LCP particles synthesized using loading method 1.16 Owing to the affinity of Ca2+ ions for PO43− groups in helical dsDNA and free phosphate ions in solution, dsDNA/CaP composites can be simultaneously formed during the CaP crystal formation.21 When dsDNA is pre-incubated with calcium and phosphate solution, respectively (method 3), there might be some dsDNA-Ca2+ and dsDNA-HxPO4x-3 ion-pairs formed, which probably provide more opportunities for dsDNA to be compacted by CaP precipitates than that for individual dsDNA-Ca2+ or dsDNA-HxPO4x-3 ion-pairs (method 1 or 2). Since method 3 yielded the highest encapsulation efficiency, it was used as the optimal siRNA loading way in the following LCP NP preparation.
Fig. 2.

(A) Encapsulation efficiency of dsDNA via different loading methods at the Ca/P ratio of 100; (B) Effect of the Ca/P ratio on gene encapsulation efficiency and loading capacity. Values presented as the mean ± SE from 3 independent experiments.
Next, the loading efficiency and amount of dsDNA were determined for the LCP NPs synthesized with method 3 at various Ca/P ratios (Fig. 2B). The encapsulation efficiency of dsDNA by LCP NPs synthesized at the Ca/P ratio of 50 and 100 was 72.8±4.9% and 66.6±2.4%, respectively, much higher than that at the Ca/P ratio of 200 and 400 (36.9±6.4% and 32.9±5.2%). At a higher Ca/P ratio, fewer CaP particles are formed and as such a smaller amount of dsDNA is encapsulated, leading to a lower encapsulation efficiency. The similar decline in dsDNA binding capacity was also observed by Jordan and Olton for calcium phosphate particles synthesized using low amounts of phosphate.10, 23 These data clearly indicate that the Ca/P ratio is critical in controlling the encapsulate efficiency of siRNA mimicking dsDNA by the LCP particles.
On the other hand, the loading capacity of LCP NPs increased from 32.1±2.2 to 116.1±18.2 μg mg−1 with the Ca/P molar ratio increasing from 50 to 400. It is believed that the gene loading capacity is directly related to the amount of phosphate ions present in the reaction mixture.21 At a higher Ca/P ratio, there are fewer phosphates available, and thus more dsDNA molecules are encapsulated by one CaP particle, leading to a higher encapsulation capacity. Reversely, the lower Ca/P ratio results in higher encapsulation efficiency and more LCP NPs, but the loading capacity per CaP particles is relatively low. As a trade-off, LCP NPs synthesized at the Ca/P ratio of 100 seem to be optimal to load siRNA with a reasonably high encapsulation efficiency (66.6±2.4%) and loading capacity (58.7±2.1 μg mg−1).
3.3. Protection of siRNA from serum RNase degradation
Fig. 3 presents the biological stability of siRNA encapsulated in LCP NPs in serum. As clearly shown, 1 h incubation with the serum largely degraded naked siRNA and there was no siRNA left after 2 h incubation. We also observed that siRNA encapsulated in LCP NPs prepared at the Ca/P ratio of 400 was degraded quickly and almost no siRNA was protected after 4 h incubation. Relatively, there was a large proportion of siRNA protected by LCP NPs prepared at Ca/P ratios of 50, 100 and 200 at 1 h, and the protection was extended to 4 h. Interestingly, the siRNA protection by the LCP NPs prepared at Ca/P = 100 seems to be the highest.
Fig. 3.

Effect of the Ca/P ratio on serum stability of siRNA in LCP-CD siRNA NPs.
It is believed that protection of siRNA from RNAse degradation in serum is mainly provided by the CaP cores of LCP NPs, in comparison with the naked siRNA. During formation of CaP crystals, the affinity of Ca2+ ions for the helical PO34− groups of gene helps trap dsDNA or siRNA within the crystals or anchor on the CaP surface.10 At a higher Ca/P ratio (i.e. 400), more siRNA is loaded onto each LCP NP, and in particular, to compensate for more surface Ca2+, i.e. there is more siRNA attached to the particle surface, thus enabling them more vulnerable to the RNAse. In contrast, with the increase of phosphate concentration (i.e. lower Ca/P ratio), more siRNA is efficaciously encapsulated into the CaP cores, leading to an increased resistance of siRNA with respect to enzymatic degradation.
Considering the loading efficiency, the loading capacity and the protection of loaded siRNA from enzyme degradation all together, we suggest that siRNA-LCP NPs prepared at Ca/P = 100 are the optimised delivery system, and used in the subsequent testings.
3.4. Physicochemical properties of optimized LCP NPs
Some characteristics of optimized LCP NPs are presented in Fig. 4. The mean particle size of CaP core was ~20 nm, and the average size of LCP NPs increased to ~40 nm after coated with the second lipid layer (Fig. 4A). When CD siRNA was loaded, the average particle size was unchanged, with the zeta potential of around −15 mV. The LCP NPs were well dispersed sphere-like particles, as observed by TEM (Fig. 4B). The TEM image confirmed the typical hollow structure of CaP cores (Fig. 4Ba) and the coating lipid membrane of LCPs after negative staining (Fig. 4Bc), a salient feature of LCP NPs.19 Relatively, LCP NPs prepared at Ca/P = 400 were more porous (Fig. S2, ESI†), so the DNAse enzyme could more easily access and degrade the loaded siRNA, which may be the other reason that these LCP NPs provide less protection of loaded siRNA (Fig. 3).
Fig. 4.

(A) The particle size distribution of optimized LCP NP and LCP-CD siRNA NP (Ca/P ratio = 100); (B) TEM images of CaP cores (a), LCP NPs before (b) and after negative staining (c).
In addition, the XRD pattern (Fig. S3, ESI†) and FT-IR spectrum (Fig. S4, ESI†) together confirm that (1) calcium phosphate (CaP) is precipitated; (2) CaP precipitate is amorphous; and (3) CaP precipitate is lipid-coated, as explained in the ESI†. These features are very similar to the previous reports.20, 24, 25
Consequently, the colloidal stability of LCP NPs in PBS at 4°C as well as in the medium with 10% FBS at 37 °C were tested. As shown in Fig. 5, LCP NPs maintained their size and narrow distribution unchanged for 24 h in the serum-containing medium and even after a week in PBS (P > 0.05). After 1 week incubation in medium with 10% FBS, the particle size of LCP NPs increased (P < 0.05). The lipid bilayer outside the CaP core provides effective surface shielding via its hydration layer, and thus prevents the particle growth and inter-particular aggregation. These together improve the colloidal stability of the LCP NPs in an aqueous medium via hydrogen bonding.26 The increase in size of the nanoparticles in medium with 10% FBS after 1 week may be due to the formation of secondary aggregates as part of the lipid layer may be detached from the LCP NP surface. Thus, LCP NPs are colloidally stable for an extended time (a week) in PBS at 4 °C and stable enough to be used in the following in vitro experiments (24 h at 37 °C).
Fig. 5.

Colloidal stability of LCP NPs in PBS and medium with 10% FBS (37°C, 5% CO2) as a function of time. Data given as the mean ± SE (n = 3).
As shown in Fig. 6, the LCP NPs exhibited a certain degree of dissolution in aqueous solution depending on the pH value. The cumulative dissolution of LCP NPs was 15%, 37% and 93% in terms of the Ca2+ concentration at a release time of 30 min with the pH value of 7.4, 6.5 and 4.5, respectively. Thereafter, the dissolution of LCP NPs within 24 h slowly increased to 40% in aqueous solution with pH 6.5 while LCP NPs were much less soluble in aqueous solution with pH 7.4 (15–20% dissolution). The experimental data suggest that as-prepared LCP NPs have a favourable property of pH-controlled dissolution, which can induce a pH sensitive drug release. It is well known that the pH value in the endosome can be as low as 4.5. Thus, the LCP NPs would mostly dissolve at this pH and release the cargo, i.e. siRNA. The pH-responsive drug delivery system is also regarded as a promising strategy for tumor therapy because of the acidic environment in solid tumors.
Fig. 6.

The dissolution profile of LCP NPs in aqueous solutions with different pHs.
3.5. Cellular uptake and siRNA delivery efficacy of LCP NPs
As shown in Fig. 7, the cellular uptake of LCP NPs by MDA-MB-468 cells, represented by the mean fluorescence intensity (MFI), increased gradually with the concentration of LCP NPs in the culture medium, indicating that the cellular uptake of LCP is dose-dependent. Similarly, the positive cell percentage increased from a few percent to >40% with the LCP NP dose increasing from 25 to 200 nM (represented by the loaded dsDNA). As reported elsewhere, the cellular uptake of LCP NPs probably undergoes the clathrin-mediated endocytosis.27
Fig. 7.

(A) The effect of LCP-Cy3-dsDNA dose on the cellular uptake, represented by the mean fluorescent intensity (MFI) of viable cells; (B) the percentage of positive cells after incubation for 4 h.
Confocal microscopy image using fluorescence-labelled dsDNA also shows the enhanced efficiency in the cellular uptake of Cy3-dsDNA via LCP NPs (Fig. 8). As can be clearly seen, under the same experiment conditions the cells show no red signal in the case of free Cy3-dsDNA. The higher fluorescence intensity observed in the Cy3-dsDNA loaded LCP NPs group further confirms that more genes were internalized into MDA-MB-468 cells via LCP NPs, which is consistent with the quantitative measurements of cellular uptake shown in Fig. 7.
Fig. 8.

Fluorescence photographs of cultured MDA-MB-468 cells after treatment with LCP-Cy3-dsDNA NPs for 4 h.
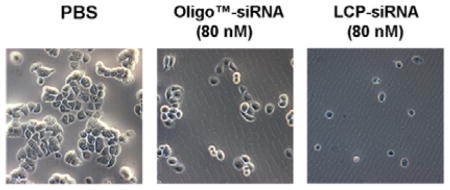
The high cancer cell growth inhibition has been further demonstrated by the LCP-CD siRNA NPs. As shown in Fig. 9, the cell viability was CD siRNA dose dependent. As a comparison, the commercial delivery system Oligofactamine™ reduced the cell viability to ~60% (P < 0.001) at 80 nM, which is corresponding to that when treated with 20 nM CD siRNA loaded in LCP NPs. At the CD siRNA dose of 40 and 80 nM, LCP-CD siRNA NPs were able to kill 65% and 83% MDA-MD-468 cells, with ~1.6- and 2.0-fold higher inhibition, respectively, than the commercial transfection reagent Oligofectamine™ with 80 nM CD siRNA (Fig. 9). The morphology change and much less MDA-MB-468 cells in the LCP-CD siRNA NP-treated groups further confirmed the cell growth inhibitory effect of LCP-CD siRNA NPs (Fig. S5, ESI†). It is worth mentioning that LCP NPs had a low toxicity (Fig. S6, ESI†). An LCP NP dose less than 400 μg mL−1 did not obviously affect the cell viability. CaP and lipid have long been used as biomaterials for clinical purposes due to their low toxicity, excellent biocompatibility and biodegradability.22 In the case of 80 nM CD siRNA in LCP NPs, there was ~40 μg mL−1 of LCP NPs. This low dose of LCP NPs thus clearly shows that the inhibition is solely attributed to the high delivery efficacy of CD siRNA using LCP NPs.
Fig. 9.

Viability of MDA-MB-468 cells in the presence of LCP-CD siRNA NPs at different concentrations. Data presented as the mean ± SE from 3 independent experiments.
Therefore, our current research has demonstrated that the optimized LCP NPs are a promising platform to carry and effectively deliver siRNA in the anticancer treatments.
4. Conclusions
We have demonstrated that nano-sized and mono-dispersed lipid coated calcium phosphate nanoparticles (LCP NPs) were achieved by controlling the Ca/P ratio. The particle size and zeta potential were predominantly determined by the Ca/P ratio. More interestingly, the loading efficiency of siRNA and the protection of the loaded siRNA from enzyme degradation were also significantly determined by the Ca/P ratio. Based on these data, we suggested an optimized LCP NP delivery system that can be prepared at the Ca/P = 100 with the average particle size of ~40 nm and the zeta potential from −10 to −15 mV (with or without CD siRNA). Our in vitro tests further demonstrated that this optimized LCP NP system can efficiently deliver the functional CD siRNA to MDA-MB-468 cancer cells and more effectively inhibit the cell growth in comparison with the commercial transfection agent. Thus the current research has revealed that the LCP NP system can be optimized to further improve gene transfection for in vivo anti-tumor treatments.
Supplementary Material
Acknowledgments
The authors acknowledged the facilities and the assistance of the Australian Microscopy & Microanalysis Research Facility at the Centre for Microscopy and Microanalysis (CMM) and Australian National Fabrication Facility (Qld Node), The University of Queensland. The study was financially supported by Chinese Scholarship Council (CSC), ARC Future Fellowship (FT120100813), ARC DP grant (DP120104792), NIH grants (CA151652, DK100664 and CA149387).
References
- 1.Whitehead KA, Langer R, Anderson DG. Nat Rev Drug Discov. 2009;8:129–138. doi: 10.1038/nrd2742. [DOI] [PMC free article] [PubMed] [Google Scholar]
- 2.de Fougerolles A, Vornlocher HP, Maraganore J, Lieberman J. Nat Rev Drug Discov. 2007;6:443–453. doi: 10.1038/nrd2310. [DOI] [PMC free article] [PubMed] [Google Scholar]
- 3.Wang Y, Miao L, Satterlee A, Huang L. Adv Drug Deliv Rev. 2015 doi: 10.1016/j.addr.2015.02.007. [DOI] [PMC free article] [PubMed] [Google Scholar]
- 4.Bolcato-Bellemin AL, Bonnet ME, Creusat G, Erbacher P, Behr JP. PANS. 2007;104:16050–16055. doi: 10.1073/pnas.0707831104. [DOI] [PMC free article] [PubMed] [Google Scholar]
- 5.Chono S, Li SD, Conwell CC, Huang L. J Controlled Release. 2008;131:64–69. doi: 10.1016/j.jconrel.2008.07.006. [DOI] [PMC free article] [PubMed] [Google Scholar]
- 6.Li SD, Chen YC, Hackett MJ, Huang L. Mol Ther. 2008;16:163–169. doi: 10.1038/sj.mt.6300323. [DOI] [PMC free article] [PubMed] [Google Scholar]
- 7.Lee MS, Lee JE, Byun E, Kim NW, Lee K, Lee H, Sim SJ, Lee DS, Jeong JH. J Controlled Release. 2014;192:122–130. doi: 10.1016/j.jconrel.2014.06.049. [DOI] [PubMed] [Google Scholar]
- 8.Peer D, Karp JM, Hong S, Farokhzad OC, Margalit R, Langer R. Nat Nanotechnol. 2007;2:751–760. doi: 10.1038/nnano.2007.387. [DOI] [PubMed] [Google Scholar]
- 9.Nel AE, Mädler L, Velegol D, Xia T, Hoek EM, Somasundaran P, Klaessig F, Castranova V, Thompson M. Nat Mater. 2009;8:543–557. doi: 10.1038/nmat2442. [DOI] [PubMed] [Google Scholar]
- 10.Olton D, Li J, Wilson ME, Rogers T, Close J, Huang L, Kumta PN, Sfeir C. Biomaterials. 2007;28:1267–1279. doi: 10.1016/j.biomaterials.2006.10.026. [DOI] [PubMed] [Google Scholar]
- 11.Xu ZP, Zeng QH, Lu GQ, Yu AB. Chem Eng Sci. 2006;61:1027–1040. [Google Scholar]
- 12.Tang J, He J, Yang C, Mao Y, Hu T, Zhang L, Cao H, Tong A-p, Song X, He G. J Nanopart Res. 2014;16:1–17. [Google Scholar]
- 13.Yang X, Hong H, Grailer JJ, Rowland IJ, Javadi A, Hurley SA, Xiao Y, Yang Y, Zhang Y, Nickles RJ, Cai W, Steeber DA, Gong S. Biomaterials. 2011;32:4151–4160. doi: 10.1016/j.biomaterials.2011.02.006. [DOI] [PMC free article] [PubMed] [Google Scholar]
- 14.Singh S, Bhardwaj P, Singh V, Aggarwal S, Mandal UK. J Colloid Interface Sci. 2008;319:322–329. doi: 10.1016/j.jcis.2007.09.059. [DOI] [PubMed] [Google Scholar]
- 15.Tang J, Chen J-Y, Liu J, Luo M, Wang Y-J, Wei X-w, Gao X, Wang B-l, Liu Y-B, Yi T. Int J Pharm. 2012;431:210–221. doi: 10.1016/j.ijpharm.2012.04.046. [DOI] [PubMed] [Google Scholar]
- 16.Li J, Chen YC, Tseng YC, Mozumdar S, Huang L. J Controlled Release. 2010;142:416–421. doi: 10.1016/j.jconrel.2009.11.008. [DOI] [PMC free article] [PubMed] [Google Scholar]
- 17.Sokolova V, Knuschke T, Kovtun A, Buer J, Epple M, Westendorf AM. Biomaterials. 2010;31:5627–5633. doi: 10.1016/j.biomaterials.2010.03.067. [DOI] [PubMed] [Google Scholar]
- 18.Banerjee SS, Todkar KJ, Khutale GV, Chate GP, Biradar AV, Gawande MB, Zboril R, Khandare JJ. J Mater Chem B. 2015 doi: 10.1039/c5tb00534e. [DOI] [PubMed] [Google Scholar]
- 19.Yang Y, Li J, Liu F, Huang L. Mol Ther. 2011;20:609–615. doi: 10.1038/mt.2011.270. [DOI] [PMC free article] [PubMed] [Google Scholar]
- 20.Li J, Yang Y, Huang L. J Controlled Release. 2012;158:108–114. doi: 10.1016/j.jconrel.2011.10.020. [DOI] [PMC free article] [PubMed] [Google Scholar]
- 21.Uskokovic V, Uskokovic DP. J Biomed Mater Res A. 2011;96:152–191. doi: 10.1002/jbm.b.31746. [DOI] [PubMed] [Google Scholar]
- 22.Krebs MD, Salter E, Chen E, Sutter KA, Alsberg E. J Biomed Mater Res A. 2010;92:1131–1138. doi: 10.1002/jbm.a.32441. [DOI] [PubMed] [Google Scholar]
- 23.Jordan M, Wurm F. Methods. 2004;33:136–143. doi: 10.1016/j.ymeth.2003.11.011. [DOI] [PubMed] [Google Scholar]
- 24.Liu Y, Tseng Y-c, Huang L. Pharm Res. 2012;29:3273–3277. doi: 10.1007/s11095-012-0818-1. [DOI] [PMC free article] [PubMed] [Google Scholar]
- 25.Lai C, Tang S, Wang Y, Wei K. Mater lett. 2005;59:210–214. [Google Scholar]
- 26.Wang Y, Xu Z, Zhang R, Li W, Yang L, Hu Q. Colloids Surf B Biointerfaces. 2011;84:259–266. doi: 10.1016/j.colsurfb.2011.01.007. [DOI] [PubMed] [Google Scholar]
- 27.Yao J, Fan Y, Li Y, Huang L. J Drug Target. 2013;21:926–939. doi: 10.3109/1061186X.2013.830310. [DOI] [PMC free article] [PubMed] [Google Scholar]
Associated Data
This section collects any data citations, data availability statements, or supplementary materials included in this article.