Abstract
AMP triggers a 15° subunit-pair rotation in fructose-1,6-bisphosphatase (FBPase) from its active R state to its inactive T state. During this transition, a catalytically essential loop (residues 50–72) leaves its active (engaged) conformation. Here, the structures of Ile10 → Asp FBPase and molecular dynamic simulations reveal factors responsible for loop displacement. The AMP/Mg2+ and AMP/Zn2+ complexes of Asp10 FBPase are in intermediate quaternary conformations (completing 12° of the subunit-pair rotation), but the complex with Zn2+ provides the first instance of an engaged loop in a near-T quaternary state. The 12° subunit-pair rotation generates close contacts involving the hinges (residues 50–57) and hairpin turns (residues 58–72) of the engaged loops. Additional subunit-pair rotation toward the T state would make such contacts unfavorable, presumably causing displacement of the loop. Targeted molecular dynamics simulations reveal no steric barriers to subunit-pair rotations of up to 14° followed by the displacement of the loop from the active site. Principal component analysis reveals high-amplitude motions that exacerbate steric clashes of engaged loops in the near-T state. The results of the simulations and crystal structures are in agreement: subunit-pair rotations just short of the canonical T state coupled with high-amplitude modes sterically displace the dynamic loop from the active site.
Graphical Abstract
Fructose-1,6-bisphosphatase (D-fructose-1,6-bisphosphate 1-phosphohydrolase, EC 3.1.3.11; FBPase1) catalyzes the hydrolysis of fructose 1,6-bisphosphate (Fru-1,6-P2) to fructose 6-phosphate (Fru-6-P) and inorganic phosphate (Pi).1,2 FBPase controls a tightly regulated step of gluconeogenesis: AMP and fructose 2,6-bisphosphate (Fru-2,6-P2) bind to allosteric and active sites, respectively, and inhibit FBPase while activating fructose-6-phosphate 1-kinase in glycolysis.3,4 Physiological levels of Fru-2,6-P2 are subject to control by glucagon and insulin.4,5 As Fru-2,6-P2 enhances the binding of AMP to FBPase by up to an order of magnitude,6 AMP should become a more potent inhibitor of FBPase in vivo as the concentration of Fru-2,6-P2 increases. AMP binds 28 Å away from the nearest active site, inhibiting catalysis noncompetitively with respect to Fru-1,6-P2. Yet, AMP is a competitive inhibitor of catalysis with respect to essential divalent cations (Mg2+, Mn2+, or Zn2+), of which all probably bind with the 1-phosphoryl group of Fru-1,6-P2.7–10
FBPase is a homotetramer (with a subunit Mr of 37 00011) and exists in at least two distinct quaternary states called R and T12,13 as well as intermediate conformations that are R-like (IR state)14 and T-like (IT state).15,16 For the wild-type enzyme, the binding of AMP alone can drive the R- to T-state transition in which the upper subunit-pair rotates 15° relative to the bottom subunit-pair of the FBPase tetramer. Substrates or products in combination with metal cations stabilize the R-state conformation.
A dynamic loop (residues 50–72), which is essential for activity, has been observed in three conformations called engaged, disengaged, and disordered. AMP alone or with Fru-2,6-P2 stabilizes a disengaged loop,17 whereas metals with products stabilize an engaged loop.10,18–20 In active forms of the enzyme, loop 50–72 probably cycles between its engaged and disordered conformations.18 Fluorescence from a tryptophan reporter group at position 57 is consistent with the conformational states for loop 50–72 observed in crystal structures.21,22 Thus far, the engaged conformation of loop 50–72 has appeared only in R-state crystal structures, and the disengaged conformer only in T-state structures; however, disordered conformations of the dynamic loop have appeared in both the R and T states.14,18,19,23,24 Although the engaged conformation of the dynamic loop correlates with the R state and the disengaged conformer with the T state, the mechanism of loop displacement in the R- to T-state transition has yet to be defined.
Here, we present results from molecular dynamics (MD) simulations and crystal structures that identify the factors responsible for loop displacement in the R- to T-state transition. Targeted molecular dynamics (TMD) simulations of the R-to-T transition reveal unhindered subunit-pair rotations (dynamic loop engaged) until just short of the T state. Consistent with TMD simulations is the crystal structure of the AMP·Zn2+ complex of Ile10 → Asp FBPase presented here, which reveals an engaged dynamic loop in a near-T quaternary state with tight contacts involving the hinge and hairpin turn of the loop. Principal component analysis (PCA) of MD trajectories of this near-T state identifies large-amplitude motions that exacerbate steric clashes of the engaged loop. Steric clashes and large-amplitude modes are arguably important factors in the displacement of loop 50–72 from the active site.
MATERIALS AND METHODS
Materials
Fru-1,6-P2, Fru-2,6-P2, and AMP were purchased from Sigma. Glucose-6-phosphate dehydrogenase and phosphoglucose isomerase came from Roche. Other chemicals were of reagent grade or equivalent. The FBPase-deficient Escherichia coli strain DF 657 came from the Genetic Stock Center at Yale University.
Mutagenesis of Wild-Type FBPase
The mutation of Ile10 to aspartate was accomplished as described previously.16 The mutation and the integrity of the construct were confirmed by sequencing the promoter region and the entire open reading frame. The Iowa State University sequencing facility provided the DNA sequences using the fluorescent dye-dideoxyterminator method.
Expression and Purification of Asp10 FBPase
Cell-free extracts of wild-type and Asp10 FBPase were subjected to heat treatment (63 °C for 7 min) followed by centrifugation. The supernatant solution was loaded onto a Cibracon Blue sepharose column that had been previously equilibrated with 20 mM Tris-HCl, pH 7.5. The column was washed first with 20 mM Tris-HCl, pH 7.5. The enzyme was eluted with a solution of 500 mM NaCl and 20 mM Tris-HCl at the same pH. After pressure concentration (Amicon PM-30 membrane) and dialysis against 20 mM Tris-HCl, pH 8.3, the protein sample was loaded onto a DEAE sepharose column equilibrated with 20 mM Tris-HCl, pH 8.3. The purified enzyme was eluted with an NaCl gradient (0–0.5 M) in 20 mM Tris-HCl, pH 8.3, and dialyzed extensively against 50 mM Hepes, pH 7.4. The purity and protein concentrations of the FBPase preparations were confirmed by sodium dodecylsulfate-polyacrylamide gel electrophoresis (SDS-PAGE) 25 and the Bradford assay,26 respectively.
Crystallization of the Asp10 FBPase
Crystals of Asp10 FBPase were grown by the method of hanging drops. Equal parts of the protein and precipitant solutions were combined in a droplet of 4 μL in total volume. The wells contained 500 μL of the precipitant solution. R-state crystals grew from a protein solution (Asp10 FBPase, 10 mg/mL; Hepes, 25 mM, pH 7.4; MgCl2, 5 mM; and Fru-1,6-P2, 5 mM) combined with a precipitant solution (Hepes, 100 mM, pH 7.4; poly(ethylene glycol) 3350, 8% w/v; glycerol, 27% v/v; and t-butanol, 5% v/ v). Crystals of the T-like AMP complex grew from a protein solution (Asp10 FBPase, 10 mg/mL; Hepes, 25 mM, pH 7.4; ZnCl2, 5 mM; Fru-1,6-P2, 5 mM; and AMP, 5 mM) combined with a precipitant solution (Hepes, 100 mM, pH 7.4; poly(ethylene glycol) 3350, 12% w/v; glycerol, 23% v/v; and t-butanol, 5% v/v). Crystals of the T-state AMP complex grew from a protein solution (Asp10 FBPase, 10 mg/mL; Hepes, 25 mM, pH 7.4; MgCl2, 5 mM; Fru-1,6-P2, 5 mM; and AMP, 5 mM) combined with a precipitant solution (Hepes, 100 mM pH, 7.4; poly(ethylene glycol) 3350, 14% w/v; 2-methyl-2,4-pentanediol, 21% v/v; and t-butanol, 5% v/v). Crystals were of equal dimensions (0.2–0.4 mm), growing in approximately 3 days at 20 °C. The conditions of the crystallization include cryoprotectants, allowing crystals to be transferred directly from the droplet to liquid nitrogen.
Data Collection, Structure Determination, and Refinement
The data were collected at Brookhaven National Laboratory on beamlines X4A (R- and IT-state structures) and X12C (T-state structure) at a temperature of 110 K. The data were reduced with the HKL program.27 Crystals of Asp10 FBPase are isomorphous to either the AMP·Zn2+·product complex18 or the Zn2+·product complex.10 The phase angles (used in the generation of initial electron density maps) were based on model 1EYJ or 1CNQ of the PDB, from which water molecules, metal cations, small-molecule ligands, and residues 50–72 had been omitted. Residues 50–72 were built into the electron density of the omit maps using the XTALVIEW program.28 Ligands were added to account for the omit electron density at the active site and/or the AMP site. The resulting models underwent refinement using CNS29 with force constants and parameters of stereochemistry from Engh and Huber.30 A cycle of refinement consisted of slow cooling from 1000–300 K in steps of 25 K followed by 120 cycles of conjugate gradient minimization and was concluded by the refinement of individual thermal parameters. Thermal-parameter refinement employed restraints of 1.5 Å2 on the nearest neighbor and next-to-nearest neighbor main-chain atoms, 2.0 Å2 on nearest neighbor side-chain atoms, and 2.5 Å2 on next-to-nearest neighbor side-chain atoms. In subsequent cycles of refinement, water molecules were fit to difference electron density of 2.5σ or better and were added until no significant decrease was evident in the Rfree value. Water molecules in the final models make suitable donor–acceptor distances to each other and the protein and have thermal parameters under 60 Å2. Stereochemistry of the models was examined by the use of PROCHECK31 and MolProbity.32
Measurement of the Rotation Angle
Hines et al.33 defined the subunit-pair rotation by alignment to the R-state structure. This method is intractable in determining subunit-pair rotations of thousands of structures from MD trajectories. Subunit-pair rotations from MD simulations are determined as follows. First, Cα atoms of residues 33–49, 75–265, and 272–330 define the center of mass of each subunit. Second, the acute angle defined by the line segments connecting the mass centers within the subunit pair (C1 and C2 or C3 and C4) is taken as the subunit-pair rotation angle. Subunit-pair rotation angles for R, IR, IT, and T states become 15.1, 18.2, 24.6, and 28.6°, respectively, corresponding to 0, 3, 12, and 15° as determined by superpositions of the crystal structures.
MD Simulations
The MD simulations here employed NAMD 34 with the CHARMM 27 force field.35 The initial coordinates for R, IR, IT, and T states were from RCSB database entries 1CNQ, 1YYZ, 2F3D, and 1EYJ, respectively. The system included an entire tetramer of FBPase and approximately 30 000 TIP3P water molecules36 in a rectangular water box with a buffering distance of 15 Å. Sodium and chloride ions were added to neutralize the net charge of system. Periodic boundary conditions were applied, and the particle mesh Ewald algorithm37 was used for the calculation of long-range electrostatic interactions. The cutoff was set to 12 Å for nonbonded van der Waals interactions, and the integration time step was 2.0 fs. All models were energy minimized for 10 ps and gradually heated to 310 K to relax unfavorable contacts (if any) followed by another 10 ps simulation to equilibrate the system. Finally, simulations of 15 ns were carried out with constant pressure and temperature (1.01325 bar at 310 K). The results from the simulations were analyzed with VMD38 and user-written programs described in the next section.
Principal Component Analysis
Motions from MD simulations can be recast into an orthogonal set of principal components, of which each corresponds to a specific motion and amplitude. Principle components with large amplitudes correspond to collective motions in proteins, which can be important functionally.39,40 Principle components were calculated as follows. A covariance matrix C was calculated from the MD trajectory as
| (1) |
where i,j = 1, …, 3N; N is the total number of Cα atoms in the structure; ri is the Cartesian coordinates of ith Cα atom; and the angle brackets denote an average over the entire MD trajectory. Rigid-body translations and rotations of the tertramer were removed before PCA by aligning the trajectory structures onto the starting structure. 3N eigenvectors and associated eigenvalues were obtained by diagonalization of matrix C. Each eigenvector corresponds to a principal component of motion, and the associated eigenvalue reflects its contribution to the collective motion. The root-mean-square inner product (rmsip41) was used to compare the PCA results from different trajectories
| (2) |
where νi and νj are the ith and jth eigenvectors of the two sets having the 10 largest associated eigenvalues.
Targeted Molecular Dynamics Simulations (TMD)
Details of the TMD procedure are in the original paper42 and early applications.43,44 TMD employs an artificial energy constraint to force a conformational change toward a target structure and can be a powerful tool in the exploration of transition pathways.43–46 The energy constraint is as follows
| (3) |
where k is the force constant, N is the total number of atoms, rms(t) is the root-mean-squared deviation (rmsd) between a given trajectory structure and the target structure at transition time t, and rms*(t) is the expected rmsd, assuming a linear decrease in the rmsd proportional to time. Here, TMD simulations employed NAMD under the CHARMM 27 force field with an integration time step of 1 fs. Because the starting and target structures should have the same atoms, residues 6–9, two Mg2+ in the R-state structure, and AMP in T-state structure were removed. The simulation system included 10 659 TIP3P water molecules and 20 364 protein atoms (the value of N in eq 3). The initial and target structures were energy minimized and equilibrated followed by the TMD simulations at a constant temperature (310 K). TMD simulations were performed with different time steps and force constants to determine the sensitivity of the observed transition pathways to the parameters of the simulation.
RESULTS
Rationale for the Ile10 → Asp Mutation
The side chain of Ile10 packs against the hydrophobic residues from loop 190 in the R state and against the hydrophobic residues of the disengaged dynamic loop in the T state. (Figures of Ile10 and nearby residues are in refs 14 and 16.) The Ile10 → Asp mutation then introduces an electrostatic charge that destabilizes the R and T states. The R-state hydrophobic cluster is not present in the R-like AMP complex14 and hence Ile10 → Asp should have little or no effect on the stability of the intermediate quaternary states with engaged dynamic loops. Moreover, as Zn2+ (relative to Mg2+) stabilizes the engaged conformation of the dynamic loop by fully occupying metal site three of the active site,10,18 the AMP·Zn2+·product complex of Asp10 FBPase offers a reasonable opportunity to capture an intermediate quaternary state of FBPase with bound AMP and an engaged dynamic loop.
Product Complex of Asp10 FBPase (PDB ID 2F3B)
Preparations of Asp10 FBPase used here are at least 95% pure, as judged by SDS-PAGE (data not shown). The gels indicated that there was no proteolysis of the purified enzyme.
The crystals (space group I222, a = 52.94, b = 82.50, and c = 165.0 Å) are isomorphous to those of wild-type FBPase in its R state, containing one subunit of the tetramer in the asymmetric unit of the crystal.10,18–20 The model begins at residue 10 (electron density for residues 1–9 is weak or absent) and continues to the last residue of the sequence. The thermal parameters vary from 11 to 55 Å2. This and all other models presented here have stereochemistry comparable to that of structures of equivalent resolution.31 The statistics for the data collection and refinement are in Table 1.
Table 1.
Statistics of Data Collection and Refinement for Asp10 FBPase
| quaternary state/PDB ID | R state/2F3B | IT state/2F3D | T state/4KXP |
|---|---|---|---|
| space group | I222 | I222 | P21212 |
| unit cell length (Å) | 52.94, 82.50, 164.96 | 55.84, 82.50, 165.02 | 59.54, 166.38, 78.95 |
| unit cell angle (deg) | 90, 90, 90 | 90, 90, 90 | 90, 90, 90 |
| resolution limit (Å) | 1.80 | 1.83 | 2.7 |
| number of measurements | 784 010 | 707 677 | 45 316 |
| number of unique reflections | 31 968 | 40 278 | 19 025 |
| completeness of data (%) | |||
| overall | 93.7 | 94.7 | 85.3 |
| last shell/range (Å) | 74.1/1.86–1.80 | 93.6/1.91–1.83 | 84.1/2.80–2.70 |
| Rsyma | |||
| overall | 0.062 | 0.055 | 0.091 |
| last shell/range (Å) | 0.095/1.86–1.80 | 0.118/1.91–1.83 | 0.269/2.80–2.70 |
| reflections in refinement | 30 433 | 32 827 | 18 998 |
| number of atoms | 2672 | 2736 | 4946 |
| number of solvent sites | 179 | 186 | 110 |
| Rfactorb | 0.226 | 0.214 | 0.207 |
| Rfreec | 0.25 | 0.243 | 0.252 |
| mean B protein (Å2) | 22 | 24 | 25 |
| mean B AMP (Å2) | 36 | 26 | |
| root-mean-square deviations | |||
| bond lengths (Å) | 0.005 | 0.005 | 0.014 |
| bond angles (degrees) | 1.4 | 1.3 | 1.5 |
| Ramachandran statistics | |||
| preferred (%) | 98.5 | 98.2 | 95.6 |
| outlier (%) | 0 | 0 | 0 |
Rsym = ΣjΣi | Iij – 〈Ij〉 | /ΣiΣjIij, where i runs over multiple observations of the same intensity and j runs over all crystallographically unique intensities.
Rfactor = Σ||Fobs| – |Fcalc|| /Σ|Fobs|, where |Fobs| > 0.
Rfree is based upon 10% of the data randomly culled and not used in the refinement.
The product complex of Asp10 FBPase has one molecule each of Fru-6-P and Pi bound to the active site with three atoms of Zn2+. The dynamic loop (residues 50–72) is in its engaged conformation. We refer the reader to other descriptions of R-state product complexes10,18–20 for more detailed descriptions of active-site interactions.
Superposition reveals a close match to the wild-type R state; however, deviations in the relative positions of Cα atoms in excess of 0.5 Å are evident for residues 10–19 (Figure 1). Asp10 has dissociated from the hydrophobic surface against which Ile10 packs in the R state of the wild-type tetramer. Helix H1 shifts essentially as a rigid body, and its movement perturbs the connecting element between helices H1 and H2 that contains residues critical for the recognition of AMP. The mutation of Ile10 to aspartate and the binding of AMP to Leu54 FBPase 14 have comparable effects on helix H1 and the conformation of its N-terminal segment.
Figure 1.
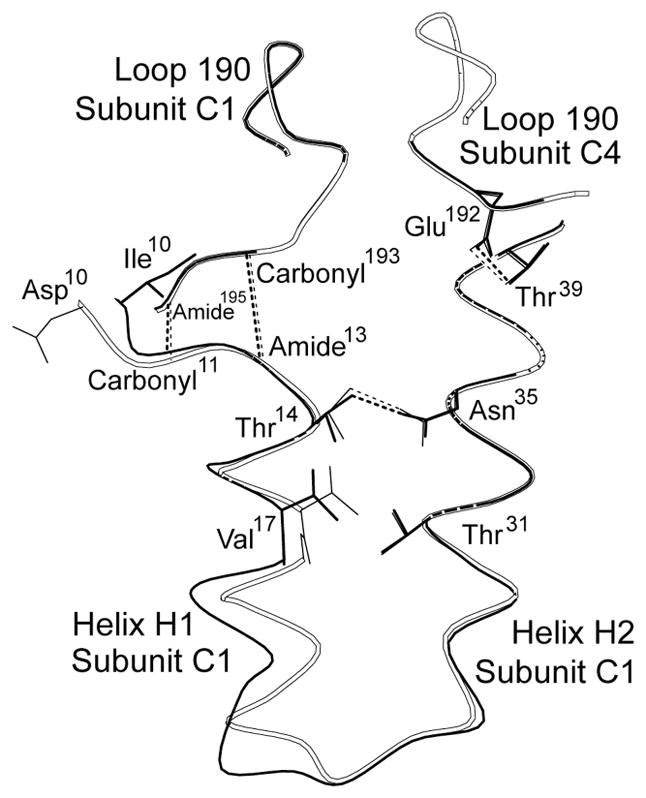
Conformational changes in the R-state structure of Asp10 FBPase. The side chain of Asp10 projects into the solvent, which is away from the hydrophobic surface against which Ile10 packs in the wild-type enzyme. Conformational differences are limited to those shown (helix H1 and the connecting element between helices H1 and H2). Black lines represent the R state of the wild-type enzyme (RCSB 1CNQ), and open lines represent the R state of Asp10 FBPase. This drawing was prepared with MOLSCRIPT.61
AMP/Product T-Like Complex of Asp10 FBPase (PDB ID 2F3D)
The crystals (space group I222, a = 55.84, b = 82.50, and c = 165.0 Å) contain one subunit in the asymmetric unit and are nearly isomorphous to those of wild-type FBPase R-state crystals.10,18–20 The model begins at residue 10 (electron density is absent for residues 1–9) and continues to the last residue of the sequence. The thermal parameters vary from 9 to 59 Å2.
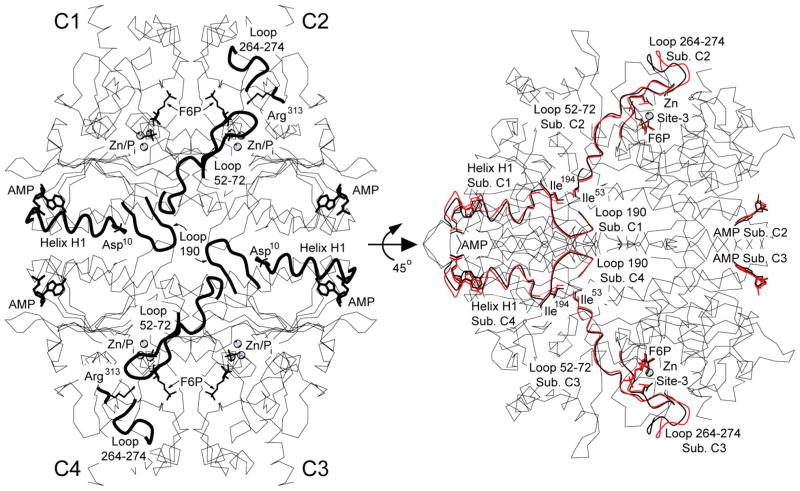
The subunit of the AMP/product complex of Asp10 FBPase has one molecule each of Fru-6-P and Pi, with three atoms of Zn2+ at the active site. In addition, strong electron density for bound AMP is present in the allosteric inhibitor pocket. The dynamic loop (residues 50–72) adopts the engaged conformation. The superposition of the Asp10 tetramer onto canonical wild-type R and T states reveals an intermediate quaternary state in which subunit-pair C1–C2 has rotated approximately 12° relative to subunit pair C3–C4. The subunit-pair rotation is near that of the wild-type enzyme in its complex with the allosteric inhibitor OC252.15
The superposition of the IR-state subunit (AMP complex of Leu54 FBPase) onto subunits of the IT-state tetramer of the AMP complex of Asp10 FBPase reveals tertiary conformational changes that accompany the 9° subunit-pair rotation from the IR to the IT states. For the most part, changes in the relative positions of Cα atoms are less that 0.2 Å; however, shifts in Cα atoms of 0.5–4.0 Å define four symmetry-related bands, connecting the AMP binding sites of subunits C1, C2, C3, and C4 to the active sites of subunits C2, C1, C4, and C3, respectively (Figure 2). The shifts extend from the AMP molecule to helix H1, from helix H1 to loop 190, and then across subunit boundaries to the dynamic loop.
Figure 2.
AMP/product complex of Asp10 FBPase. Overview of the complex (left). Subunits of the tetramer, labeled C1 through C4, have each one molecule of bound AMP, Fru-6-P (labeled F6P), and Pi and three atoms of Zn2+. The side chains of Asp10 from subunits C1 and C3 are omitted for clarity. Residues 10–25 (helix H1, subunits C1 and C3), 187–195 (loop 190, subunits C1 and C3), 50–72 (dynamic loop, subunits C2 and C4), and 264–274 (subunits C2 and C4) are in bold lines. Rotation of the tetramer by 45° about the horizontal 2-fold axis (right). IR-state subunits from Leu54 FBPase (red lines) are superimposed on the subunits of the IT-state Asp10 tetramer (black lines). Shown are only Cα atoms of the IR subunit that deviate from those of the IT structure by more than 0.5 Å. This drawing was prepared with MOLSCIRPT.61
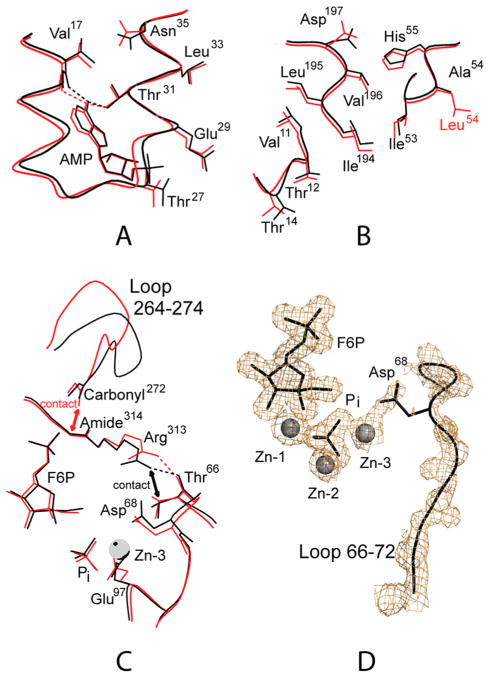
AMP and helix H1 move through comparable displacements of 0.5–1.0 Å during the IR- to IT-state transition (Figure 3A). In the IT-state structure, Thr39 hydrogen bonds with Glu192 of a neighboring subunit (C1–C4 contact); this hydrogen bond was disrupted in the AMP complex of Leu54 FBPase.14 The movement in helix H1 carries over to residues 194–197 and from there to residues 53–55 of the dynamic loop (Figure 3B). The entire dynamic loop shifts toward Arg313 by approximately 0.5 Å. In contrast, residues 264–274 move in opposition to the general thrust of the dynamic loop, generating tight contacts (Figure 3C). In the IR state, the side chain of Arg313 hydrogen bonds with the backbone carbonyls of residues 66 and 274 (donor–acceptor distances of 2.8–2.9 Å) and is in contact with the Cβ atom of Thr66 (distance of 3.6 Å). In the IT state, however, the donor–acceptor contacts diminish to 2.5 Å, and the contact involving the Cβ atom of Thr66 becomes 2.9 Å. In short, the transition from the IR to IT state lessens the space for the engaged conformation of the dynamic loop.
Figure 3.
Tertiary conformational changes between the IR and IT states. Dotted lines represent selected donor–acceptor interactions of 3.2 Å or less. Double-headed arrows represent tight contacts of less than 3 Å. Superposition of the IR-state subunit from the AMP complex of Leu54 FBPase (red) onto each subunit of the AMP complex of Asp10 FBPase (black) reveals a conformational change induced by a 9° subunit-pair rotation. (A) Conformational changes at the AMP binding site. (B) Conformational changes from helix H1 to loop 190 and then across a subunit interface to hinge residues of the dynamic loop. (C) Conformational changes in the hairpin turn of the dynamic loop, loop 264–274, and Arg313. (D) Electron density from an omit map contoured at 1σ showing the density for active-site ligands and part of the dynamic loop. This drawing was prepared with MOLSCIRPT.61
Omit electron density is weaker for residues of loop 50–72 than for nearby residues and active-site ligands (Figure 3D). The thermal parameters for loop 50–72 average to 38 Å2 relative to 24 Å2 for the entire protein, and that of Zn at site 3 is 36 Å2 relative to Zn at sites 1 and 2 of 30 and 15 Å2, respectively. These observations are consistent with the partial displacement of loop 50–72 from the active site, suggesting an equilibrium between the engaged and disordered conformations in the crystal.
The movement in loop 264–274 is relatively large (up to 4 Å) and results in the elimination of a tight internal contact between the backbone carbonyl group of residue 272 and the backbone amide group of residue 314. In the IR state (as well as the R state), the contact distance is approximately 2.8 Å. Although the contact distance is reasonable for a donor–acceptor pair, the axis of backbone carbonyl 272 is perpendicular to the plane of the peptide link between residues 313 and 314. Hence, an unfavorable contact exits between residues 272 and 314 in the IR state, and a small rotation of the carbonyl group of residue 272 relieves this tight contact in the IT state (the contact distance becomes 3.1 Å), driving the observed motion of loop 264–274 in the IR- to IT-state transition.
AMP/Product T-State Complex of Asp10 FBPase (PDB ID 4KXP)
The crystals (space group P21212, a = 59.54, b = 166.3, and c = 78.95) are isomorphous to those of AMP complexes of FBPase.16,17 Subunit pair C1–C2 is in the asymmetric unit of this crystal form. The model begins at residue 10 and continues to the last residue of the sequence, but segment 55–72 is unreliable, as evidenced by thermal parameters as high as 100 Å2. The enzyme in this crystal form is in the T state (quaternary transition angle of 15°); however, unlike loop-disengaged AMP complexes of the wild-type enzyme, the dynamic loop in T-state Asp10 FBPase is disordered. The active site retains Fru-6-P and Mg2+ bound to site 1. The conditions of crystallization of the T-state and IT- state AMP complexes of Asp10 FBPase differ only in the type of metal ion, with Mg2+ for the former and Zn2+ for the latter. As anticipated, the Ile10 → Asp mutation has destabilized the disengaged conformation of the dynamic loop.
MD Simulations of FBPases
The structures were stable over simulations of 15 ns, as indicated by the time evolution of the energy function and root-mean-squared displacements in Cα atoms. The hydrogen and coordinate bonds involving protein residues and active-site ligands were stable. Although Asp68 and Arg276 remained bonded to the Mg2+ at site 3 and to Pi, respectively, the hydrogen bond between Asp68 and Arg276 observed in crystal structures was disrupted early in all simulations without noticeable secondary responses. The subunit-pair rotations for the R, IR, IT, and T states averaged to 15, 19, 29, and 29°, respectively, with standard deviations of approximately 1° and extremes of ±3°. The average values remain close to the starting crystallographic angles (15.1, 18.2, 24.6, and 28.6°, respectively) except for the IT state, which drifted toward the canonical T state. The dynamic loops remained in engaged conformations during the R-state simulation; however, in the IR- and IT-state simulations, residues 59–70 and loop 264–274 of one subunit exhibited substantial transitory movements readily seen as high fluctuations (Figure 4). Residues 59–70 (hairpin turn of the engaged loop) exit the active site as observed in the first stage of loop displacement in targeted molecular dynamics.
Figure 4.
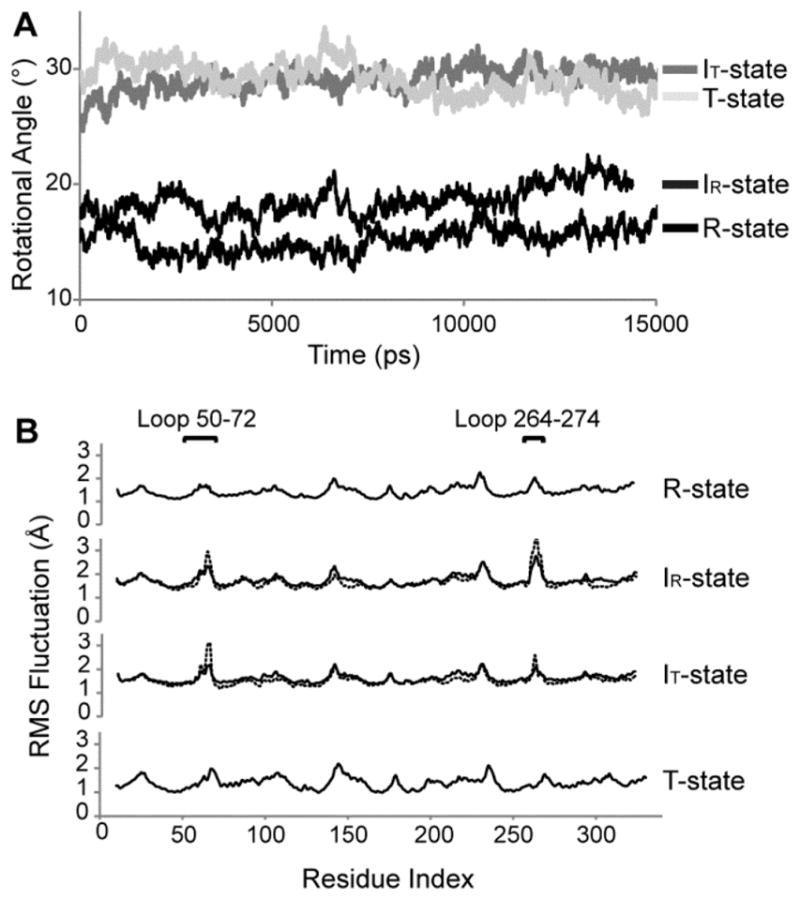
Molecular dynamic simulations of FBPase. Time evolution of the subunit-pair rotation angles (A) and root-mean-square (rms) fluctuation as a function of the residue index (B) from 15 ns simulations of the R, IR, IT, and T state of FBPase. The solid lines in panel B represent fluctuations averaged over all four subunits, whereas dashed curves for the IR and IT states are rms fluctuations for subunits C3 and C4, respectively.
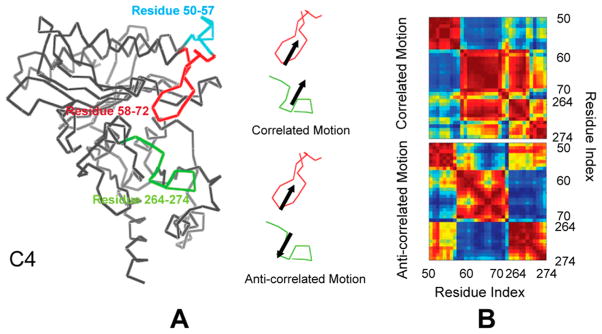
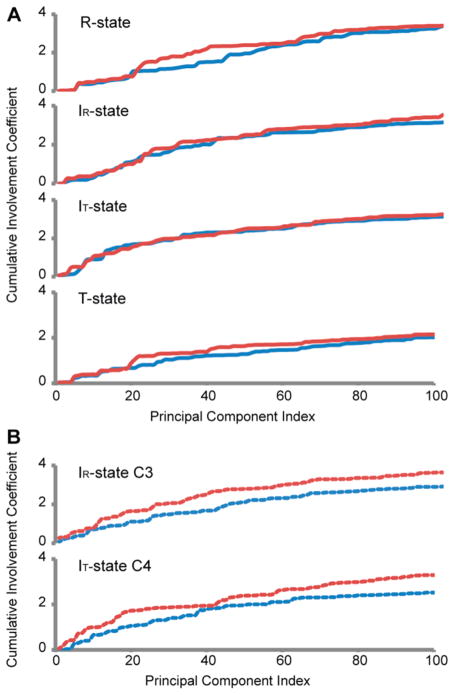
Principal component analysis of residues 50–72 and 264–274 in each subunit of the R-, IR-, and IT-state simulations reveals relatively simple motions for the first 10 eigenvectors collectively representing 50% of the total motion. Root-mean-squared inner products (rmsip40) between the first 10 eigenvectors from each subunit exceed 0.5, indicating similar motions for all subunits in all states. Segments 59–72 and 264–274 have correlated and anticorrelated motions (Figure 5). Correlated motions between these segments preserve contact distances, whereas anticorrelated motions periodically increase and decrease contact distances. Anticorrelated motions involving segments 59–72 and 264–274 cause significant steric clashes, which tend to force the dynamic loop out of its engaged conformation. Both correlated and anticorrelated motions have similar magnitudes in the R, IR, and IT states; however, in the T state the amplitude decreases by 50% (Figure 6A). In subunit C3 of the IR state and subunit C4 of the IT state, the amplitude of the anticorrelated motions exceeds that of the correlated motions (Figure 6B). These are subunits in which the engaged loops become transiently displaced from the active site during the simulation.
Figure 5.
PCA analysis of the dynamic loop. (A) Locations of segments 58–72 (red) and 264–274 (green) in the tertiary structure of the subunit along with correlated and anticorrelated motions of each segment are shown by arrows. Images are prepared with PYMOL.62 (B) Examples of high-amplitude correlated (upper) anticorrelated (lower) modes from PCA analysis. Blue off-diagonal elements represent strong anticorrelated motions between pairs of residues, whereas red off-diagonal elements represent correlated motions.
Figure 6.
Cumulative involvement coefficients of anticorrelated and correlated motions. (A) Cumulative involvement coefficients of R, IR, IT, and T state of FBPase were plotted against the principal component index. Red lines indicate correlated motions between loop 58–72 and loop 264–274, and blue lines indicate the anticorrelated motions. (B) The cumulative involvement coefficients of subunit C3 in the IR state and subunit C4 in IT state are drawn in dotted lines. The anticorrelated motions result in larger cumulative shifts in the coordinates of the loop than do the correlated motions. This is due to the expulsion of the loop out of its engaged conformation.
TMD Simulation of the R- to T-State Transition
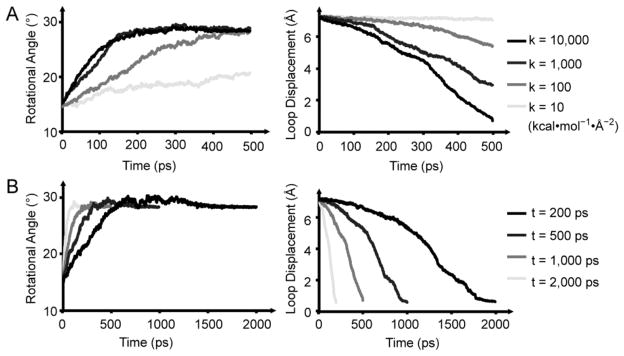
The Rand T-state FBPase define the extremes of TMD simulations with force constants (k) of 10, 100, 1000, 10 000 kcal·mol−1·Å−2 distributed over 20 364 atoms. The highest force constant represents a force per atom substantially less than that of a hydrogen bond. The rmsd for k of 10 kcal·mol−1·Å−2 drops from 6.3 to 5.7 Å over the simulation largely because of an increase of 5° in the subunit-pair rotation (Figure 7A). The dynamic loop, however, remains in place (rmsd declines from 7.4 to 7.0 Å). Force constants of 100 and 1000 kcal·mol−1·Å−2 drive the subunit-pair rotation to completion, with final rmsd values of 3.5 and 1.2 Å, respectively. For k = 100 kcal·mol−1·Å−2, residues 59–72 dissociate from the active site, whereas residues 50–58 remain in the engaged conformation. For k = 1000 kcal·mol−1·Å−2, the entire dynamic loop dissociates from the active site, and with a force constant of 10 000 kcal·mol−1·Å−2, the structure goes to the T state (final rmsd <0.5 Å). For the latter simulation, the subunit-pairs first rotate through ~15° and then the loops move out of their engaged conformation to the disengaged conformation.
Figure 7.
TMD simulation of the R- to T-state transition. (A) TMD simulations with different force constants. Lines go from light gray to black with increasing force constants corresponding to k = 10, 100, 1000, and 10 000 kcal·mol−1·Å−2. (B) TMD simulations with different time steps (light gray, 200 ps; gray, 500 ps; dark gray, 1000 ps; black, 2000 ps). Panels on the left in A and B show the subunit-pair rotation angle versus simulation time, and those on the right show the rmsd change for residues of the dynamic loops versus simulation time.
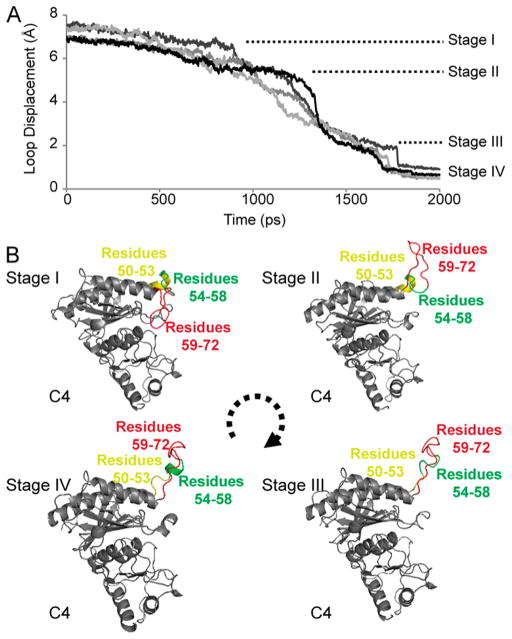
Simulations with transition times from 200–2000 ps with k = 10 000 kcal·mol−1·Å−2 are similar in appearance (Figure 7B). The simulation with a transition time of 2000 ps (final rmsd 0.36 Å relative to T-state) reveals four stages: (i) subunit-pair rotation of ~15° with dynamic loops remaining engaged, (ii) hairpin turn of the dynamic loop (residues 59–72) exits the active site, (iii) residues 56 and 57 leave hydrophobic pockets of the engaged conformer followed by the loss of helical conformation for residues 50–53, and (iv) residues 54–58 become coiled followed by a rapid acquisition of the disengaged conformation (Figure 8).
Figure 8.
Displacement of the dynamic loop. (A) TMD simulation (2000 ps) with force constant k = 10 000 kcal·mol−1·Å−2 reveals distinct steps in loop displacement (stages I–IV). Each curve tracks the rmsd of the loop for each subunit of the tetramer. (B) Illustration of the dynamic loop at the onset of each stage. This illustration was prepared with PYMOL.62
DISSCUSION
The T state of FBPase with loop 50–72 in its disengaged conformation represents the inhibited state of FBPase.10,11,13,14,17,18,21 The mutations of Ile10 to aspartate and Ala54 to leucine destabilize the disengaged conformation of loop 50–72, as verified by crystal structures presented here and elsewhere.14 The activity of Asp10 FBPase declines 70% in the presence of saturating AMP,16 whereas Leu54 FBPase loses 100% of its activity.14 Clearly, factors in addition to the stabilization of the disengaged conformation of loop 50–72 contribute to AMP inhibition.
A comparison of the IR state of Leu54 FBPase and the IT state of Asp10 FBPase indicates that a subunit-pair rotation toward the T state crowds the engaged conformation of loop 50–72. Packing interactions in the crystals, however, could be responsible for the close contacts. Molecular dynamics simulations arguably should relax artifacts resulting from a crystalline environment, but here they reveal high-amplitude modes that exacerbate the steric conflicts observed in the IT state of Asp10 FBPase. The only pathway for the relaxation of steric crowding in the simulations was the partial displacement of loop 50–72 from its engaged conformation.
The R- to T-state transition can be simplified to a sequence of events. Two AMP molecules bind to the R state, disrupting hydrogen bonds (Thr39 to Glu192) across the C1–C4 interface.14,47–50 The disrupted hydrogen bonds reform after an unhindered subunit-pair rotation of 12–14°. The movements in structural elements across the C1–C2 interface (Figure 2) attend the subunit-pair rotation, creating tight contacts at the hinges and hairpin turns of the engaged loops (Figure 3). High-amplitude modes (Figures 5 and 6) exacerbate these contacts, displacing loops from the active site. The displaced dynamic loop undergoes conformational change (Figure 8), leading to the canonical T state with its disengaged loop.
In reality, the situation is far more complex than indicated by the foregoing paragraph. The kinetics of FBPase are well represented by a rapid equilibrium model51 in which various conformational states and states of ligation, prior to the rate-limiting conversion of substrate into products, are at equilibrium. The simplified perspective is but one path through a complex set of transformations at equilibrium. Although capturing the populations of these various states at equilibrium is not feasible through simulations, the results here are consistent with a decrease in the fraction of tetramers with engaged loops as the subunit-pair rotation increases. Complete inhibition (the absence of the engaged conformation) would occur at large subunit-pair rotations where the dwell time of loop 50–72 in the engaged conformation would be small. Acquisition of the disengaged conformation (an option for the wild-type enzyme but not for Asp10 or Leu54 FBPase) augments the mechanism of displacement by providing a stable conformation for loop 50–72 away from the active site.
The movement of loop 264–274 was noted previously in a comparison of the R- and T-state structures, but it was dismissed as an artifact of different packing environments in the crystal forms of FBPase.10 The crystals of the R, IR, and IT states of FBPase, however, are nearly isomorphous with a maximum change of 5% in the b parameter of the unit cell. Hence, conformational changes in loop 264–274 are an integral part of the quaternary transition and contribute to the crowding of loop 50–72.
Molecular dynamics simulations indicate little steric hindrance in subunit-pair rotations at any point in the R- to T-state transition. During simulations of the R, IR, IT, and T states, subunit-pair rotations wander over a range of 6°. Even with the minimal force constants employed in targeted molecular dynamics, the change in the subunit-pair rotation proceeds smoothly (Figure 7). Because the binding of AMP to the R state causes a loss of hydrogen bonds across the C1–C4 interface,14 AMP could facilitate subunit-pair rotation by weakening the interactions between the C1–C4 interfaces.
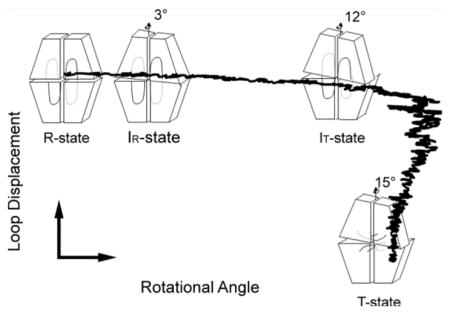
The R- to T-state transition pathway from TMD simulation agrees well with crystal structures (Figure 9), passing through IR and IT states to the T state before the engaged dynamic loop undergoes its transition to the disengaged conformation. Crystal structures have revealed engaged loops 50–72 with subunit-pair rotations from 0–12° and disengaged loops with subunit-pair rotations from 12–15°. There are no instances of crystalline T-state tetramers with engaged loops or R-state tetramers with disengaged loops.
Figure 9.
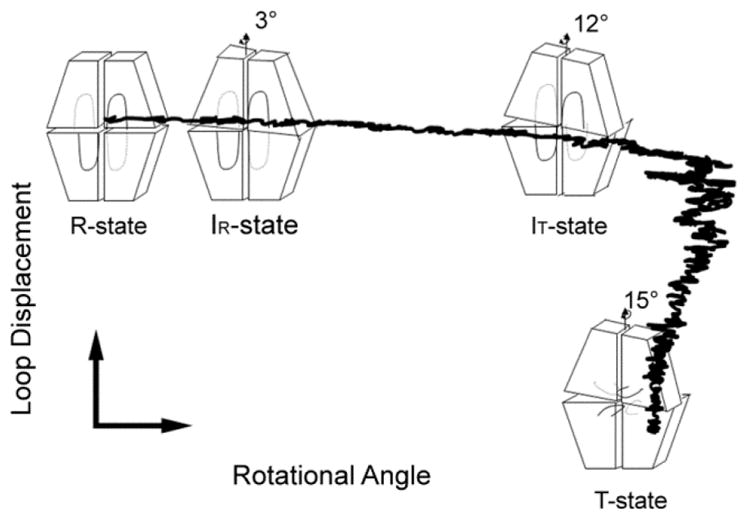
R- to T-state transition from TMD simulation. The TMD trajectories of the R to T transition are projected onto a 2D plane determined by the loop displacement (y axis) and subunit-pair rotation angle (x axis). The data points provided by the crystal structures are represented by tetramer icons. The simulation indicates a subunit-pair rotation beyond 15° followed by loop displacement and relaxation to the canonical T state.
The stepwise displacement of the loop from its engaged conformation has support from crystallography as well. Residues 59–72 (hairpin turn of the engaged loop) are the first to exit the engaged conformation in simulations, an event that requires the disruption of the coordinate bond between Asp68 and the metal at site 3. Residues 59–70 are disordered in a crystal structure at high ionic strength,19 which is consistent with the partial dislocation of the dynamic loop. The second step of loop displacement is the release of Tyr57 from its hydrophobic pocket, after which the rmsd decays exponentially. In several crystal structures, the entire loop is disordered,14,18,19,23,24 and in each instance Tyr57 is absent from its hydrophobic pocket. The final step is the formation of a short helix (residues 54–58) and the rapid acquisition of the disengaged conformation (crystallographic T state). The failure to form helix 54–58 is likely to destabilize the disengaged conformation given the effect caused by the mutation of Ala54 to leucine.14
Because the catalytic loop remains engaged over 12–14° of subunit-pair rotation, the enzyme is likely active in quaternary states of intermediate rotation (such as the IT state). The observation16 of potent but partial AMP inhibition of Asp10 FBPase is probably due to an active AMP-bound IT state that accommodates the engaged dynamic loop, albeit with elevated steric stress. Other mutations of FBPase have resulted in a partial inhibition at saturating levels of AMP.49,52,53 For these, investigators have suggested an active T state,54 but as demonstrated here by the AMP complex of Asp10 FBPase the tetramer could populate intermediate quaternary states with reduced specific activities.
High-amplitude modes are a characteristic in the functional transitions of other systems.40,55–59 Such modes play roles in the extraction cycle of myosin,55 allosteric activation of epidermal growth factor receptor,58 substrate specificity of α-lytic protease,40 and substrate-induced conformational changes.57–59 For FBPase, specific motions facilitate AMP-induced conformational change, but the work here cannot exclude conformational states at equilibrium that differentially favor the binding of ligands.60 FBPase with Mg2+ at metal site 1 and bound substrate might over an extended simulation sample a full range of subunit-pair rotations. Mg2+, binding to metal sites 2 and 3, arguably favors the R-state tetramer, whereas AMP favors the T-state tetramer.
Acknowledgments
Funding
This work was supported in part by National Institutes of Health research grant NS 10546.
An allocation of computing resources was supported by the National Science Foundation. Computational work was performed on Kraken, National Institute for Computational Sciences (http://www.nics.tennessee.edu), and on Cyblue at Iowa State University (http://bluegene.ece.iastate.edu).
ABBREVIATIONS
- FBPase
fructose-1,6-bisphosphatase
- Fru-6-P
fructose 6-phosphate
- Pi
inorganic phosphate
- Fru-1,6-P2
fructose 1,6-bisphosphate
- Fru-2,6-P2
fructose 2,6-bisphosphate
- MD
molecular dynamics
- TMD
targeted molecular dynamics
- PCA
principal component analysis
Footnotes
Accession Codes
The atomic coordinates and structure factors (accession labels 2F3B, 2F3D, and 4KXP) for the structures described in this manuscript have been deposited in the Protein Data Bank, Research Collaboratory for Structural Bioinformatics, Rutgers University, New Brunswich, NJ (http://www.rcsb.org/).
Notes
The authors declare no competing financial interest.
References
- 1.Benkovic ST, de Maine MM. Mechanism of action of fructose 1,6-bisphosphatase. Adv Enzymol Relat Areas Mol Biol. 1982;53:45–82. doi: 10.1002/9780470122983.ch2. [DOI] [PubMed] [Google Scholar]
- 2.Tejwani GA. Regulation of fructose-bisphosphatase activity. Adv Enzymol Relat Areas Mol Biol. 1983;54:121–194. doi: 10.1002/9780470122990.ch3. [DOI] [PubMed] [Google Scholar]
- 3.Van Schaftingen E. Fructose 2,6-bisphosphate. Adv Enzymol Relat Areas Mol Biol. 1987;59:45–82. doi: 10.1002/9780470123058.ch7. [DOI] [PubMed] [Google Scholar]
- 4.Pilkis SJ, El-Maghrabi MR, Claus TH. Hormonal regulation of hepatic gluconeogenesis and glycolysis. Annu Rev Biochem. 1988;57:755–783. doi: 10.1146/annurev.bi.57.070188.003543. [DOI] [PubMed] [Google Scholar]
- 5.Okar DA, Lange AJ. Fructose-2,6-bisphosphate and control of carbohydrate metabolism in eukaryotes. BioFactors. 1999;10:1–14. doi: 10.1002/biof.5520100101. [DOI] [PubMed] [Google Scholar]
- 6.Pilkis SJ, El-Maghrabi RM, McGrane MM, Pilkis J, Claus TH. Inhibition of fructose-1,6-bisphosphatase by fructose 2,6-bisphosphate. J Biol Chem. 1981;256:3619–3622. [PubMed] [Google Scholar]
- 7.Liu F, Fromm HJ. 31P nuclear magnetic resonance spectroscopy studies of substrat and product binding to fructose-1,6-bisphosphatase. J Biol Chem. 1991;266:11774–11778. [PubMed] [Google Scholar]
- 8.Liu F, Fromm HJ. Interaction of fructose 2,6-bisphosphate and AMP with fructose-1,6-bisphosphatase as studied by nuclear magnetic resonance spectroscopy. J Biol Chem. 1988;263:9122–9128. [PubMed] [Google Scholar]
- 9.Scheffler JE, Fromm HJ. Regulation of rabbit liver fructose-1,6-bisphosphatase by metals, nucleotides, and fructose 2,6-bisphosphate as determined from fluorescence studies. Biochemistry. 1986;25:6659–6665. doi: 10.1021/bi00369a050. [DOI] [PubMed] [Google Scholar]
- 10.Choe JY, Poland BW, Fromm HJ, Honzatko RB. Role of a dynamic loop in cation activation and allosteric regulation of recombinant porcine fructose-1,6-bisphosphatase. Biochemistry. 1998;33:11441–11450. doi: 10.1021/bi981112u. [DOI] [PubMed] [Google Scholar]
- 11.Stone SR, Fromm HJ. Studies on the mechanism of adenosine 5′-monophosphate inhibition of bovine liver fructose 1,6-bisphosphatase. Biochemistry. 1980;19:620–625. doi: 10.1021/bi00545a003. [DOI] [PubMed] [Google Scholar]
- 12.Ke H, Zhang Y, Liang JY, Lipscomb WN. Crystal structure of the neutral form of fructose-1,6-bisphosphatase complexed with the product fructose 6-phosphate at 2.1-Å resolution. Proc Natl Acad Sci USA. 1991;88:2989–2993. doi: 10.1073/pnas.88.8.2989. [DOI] [PMC free article] [PubMed] [Google Scholar]
- 13.Zhang Y, Liang JY, Huang S, Lipscomb WM. Toward a mechanism for the allosteric transition of pig kidney fructose-1,6-bisphosphatase. J Mol Biol. 1994;244:609–624. doi: 10.1006/jmbi.1994.1755. [DOI] [PubMed] [Google Scholar]
- 14.Iancu CV, Mukund S, Fromm HJ, Honzatko RB. R-state AMP complex reveals initial steps of the quaternary transition of fructose-1,6-bisphosphatase. J Biol Chem. 2005;280:19737–19745. doi: 10.1074/jbc.M501011200. [DOI] [PubMed] [Google Scholar]
- 15.Choe JY, Nelson SW, Arienti KL, Axe FU, Collins TL, Jones TK, Kimmich RDA, Newman MJ, Norvell K, Ripka WC, Romano SJ, Short KM, Slee DH, Fromm HJ, Honzatko RB. Inhibition of fructose-1,6-bisphosphatase by a new class of allosteric effectors. J Biol Chem. 2003;278:51175–51183. doi: 10.1074/jbc.M308396200. [DOI] [PubMed] [Google Scholar]
- 16.Nelson SW, Kurbanov F, Honzatko RB, Fromm HJ. The N-terminal segment of recombinant porcine fructose-1,6-bisphosphatase participates in the allosteric regulation of catalysis. J Biol Chem. 2001;276:6119–6124. doi: 10.1074/jbc.M009485200. [DOI] [PubMed] [Google Scholar]
- 17.Xue Y, Huang S, Liang JY, Zhang Y, Lipscomb WN. Crystal structure of fructose-1,6-bisphosphatase complexed with fructose 2,6-bisphosphate, AMP, and Zn2+ at 2.0-Å resolution: aspects of synergism between inhibitors. Proc Natl Acad Sci USA. 1994;91:12482–12486. doi: 10.1073/pnas.91.26.12482. [DOI] [PMC free article] [PubMed] [Google Scholar]
- 18.Choe JY, Fromm HJ, Honzatko RB. Crystal structures of fructose 1,6-bisphosphatase: mechanism of catalysis and allosteric inhibition revealed in product complexes. Biochemistry. 2000;39:8565–8574. doi: 10.1021/bi000574g. [DOI] [PubMed] [Google Scholar]
- 19.Choe JY, Nelson SW, Fromm HJ, Honzatko RB. Interaction of Tl+ with product complexes of fructose-1,6-bisphosphatase. J Biol Chem. 2003;278:16008–16014. doi: 10.1074/jbc.M212394200. [DOI] [PubMed] [Google Scholar]
- 20.Choe JY, Iancu CV, Fromm HJ, Honzatko RB. Metaphosphate in the active site of fructose-1,6-bisphosphatase. J Biol Chem. 2003;278:16015–16020. doi: 10.1074/jbc.M212395200. [DOI] [PubMed] [Google Scholar]
- 21.Nelson SW, Choe JY, Iancu CV, Honzatko RB, Fromm HJ. Tryptophan fluorescence reveals the conformational state of a dynamic loop in recombinant porcine fructose-1,6-bisphosphatase. Biochemistry. 2000;39:11100–11106. doi: 10.1021/bi000609c. [DOI] [PubMed] [Google Scholar]
- 22.Wen J, Nelson SW, Honzatko RB, Fromm HJ, Petrich JW. Environment of tryptophan 57 in porcine fructose-1,6-bisphosphatase studied by time-resolved flurescence and site-directed mutagenesis. Photochem Photobiol. 2001;74:679–685. doi: 10.1562/0031-8655(2001)074<0679:eotipf>2.0.co;2. [DOI] [PubMed] [Google Scholar]
- 23.Ke HM, Thorpe CM, Seaton B, Lipscomb WN, Marcus F. Structure refinement of fructose-1,6-bisphosphatase and its fructose 2,6-bisphosphate complex at 2.8 Å resolution. J Mol Biol. 1990;212:513–539. doi: 10.1016/0022-2836(90)90329-k. [DOI] [PubMed] [Google Scholar]
- 24.Lu G, Stec B, Giroux EL, Kantrowitz ER. Evidence for an active T-state pig kidney fructose 1,6-bisphosphatase: interface residue Lys-42 is important for allosteric inhibition and AMP cooperativity. Protein Sci. 1996;5:2333–2342. doi: 10.1002/pro.5560051120. [DOI] [PMC free article] [PubMed] [Google Scholar]
- 25.Laemmli UK. Cleavage of structural proteins during the assembly of the head of bacteriophage T4. Nature. 1970;227:680–685. doi: 10.1038/227680a0. [DOI] [PubMed] [Google Scholar]
- 26.Bradford MM. A rapid and sensitive method for the quantitation of microgram quantities of protein utilizing the principle of protein-dye binding. Anal Biochem. 1976;72:248–252. doi: 10.1016/0003-2697(76)90527-3. [DOI] [PubMed] [Google Scholar]
- 27.Otwinoski Z, Minor W. Processing of X-ray diffraction data collected in oscillation mode. Methods Enzymol. 1997;276:307–326. doi: 10.1016/S0076-6879(97)76066-X. [DOI] [PubMed] [Google Scholar]
- 28.McRee DE. A visual protein crystallographic software system for X11/Xview. J Mol Graphics. 1992;10:44–46. [Google Scholar]
- 29.Brünger AT, Adams PD, Clore GM, DeLano WL, Gros P, Grosse-Kunstleve RW, Jiang JS, Kuszewski J, Nilges M, Pannu MS, Read RJ, Rice LM, Simonson T, Warren GL. Crystallography & NMR system: a new software suite for macromolecular structure determination. Acta Crystallogr, Sect D. 1998;54:905–921. doi: 10.1107/s0907444998003254. [DOI] [PubMed] [Google Scholar]
- 30.Engh RA, Huber R. Accurate bond and angle parameters for X-ray protein structure refinement. Acta Crystallogr, Sect A. 1991;47:392–400. [Google Scholar]
- 31.Laskowski RA, Mac Arthur MW, Moss DS, Thornton JM. PROCHECK: a program to check the stereochemical quality of protein structures. J Appl Crystallogr. 1993;26:283–291. [Google Scholar]
- 32.Chen VB, Arendall WB, Headd JJ, Keedy DA, Immormino RM, Kapral GJ, Murray LW, Richardson JS, Richardson DC. MolProbity: all-atom structure validation for macromolecular crystallography. Acta Crystallogr, Sect D. 2010;66:12–21. doi: 10.1107/S0907444909042073. [DOI] [PMC free article] [PubMed] [Google Scholar]
- 33.Hines JK, Chen X, Nix JC, Fromm HJ, Honzatko RB. Structures of mammalian and bacterial fructose-1,6-bisphosphatase reveal the basis for synergism in AMP/fructose 2,6-bisphosphate inhibition. J Biol Chem. 2007;282:36121–36131. doi: 10.1074/jbc.M707302200. [DOI] [PubMed] [Google Scholar]
- 34.Phillips JC, Braun R, Wang W, Gumbart J, Tajkhorshid E, Villa E, Chipot C, Skeel RD, Kale L, Schulten K. Scalable molecular dynamics with NAMD. J Comput Chem. 2005;26:1781–1802. doi: 10.1002/jcc.20289. [DOI] [PMC free article] [PubMed] [Google Scholar]
- 35.MacKerell AD, Jr, Banavali N, Foloppe N. Development and current status of the CHARMM force field for nucleic acids. Biopolymers. 2001;56:257–265. doi: 10.1002/1097-0282(2000)56:4<257::AID-BIP10029>3.0.CO;2-W. [DOI] [PubMed] [Google Scholar]
- 36.Jorgensen WL, Chandrasekhar J, Madura JD, Impey RW, Klein ML. Comparison of simple potential functions for simulating liquid water. J Chem Phys. 1983;79:926–935. [Google Scholar]
- 37.Essmann U, Perera L, Berkowitz ML, Darden T, Lee H, Pedersen LG. A smooth particle mesh Ewald method. J Chem Phys. 1995;103:8577–8593. [Google Scholar]
- 38.Humphrey W, Dalke A, Schulten KJ. VMD –Visual Molecular Dynamics. J Mol Graphics. 1996;14(1):33–38. doi: 10.1016/0263-7855(96)00018-5. [DOI] [PubMed] [Google Scholar]
- 39.Tournier AL, Smith JC. Principal components of the protein dynamical transition. Phys Rev Lett. 2003;91:208106–4. doi: 10.1103/PhysRevLett.91.208106. [DOI] [PubMed] [Google Scholar]
- 40.Ota N, Agard DA. Enzyme specificity under dynamic control II: principal component analysis of alpha-lytic protease using global and local solvent boundary conditions. Protein Sci. 2001;10:1403–1414. doi: 10.1110/ps.800101. [DOI] [PMC free article] [PubMed] [Google Scholar]
- 41.Amadei A, Ceruso MA, Nola AD. On the convergence of the conformational coordinates basis set obtained by the essential dynamics analysis of protein’s molecular dynamics simulations. Proteins. 1999;36:419–424. [PubMed] [Google Scholar]
- 42.Schlitter J, Engels M, Kruger P, Jacoby E, Wollmer A. Targeted molecular dynamics simulation of conformational change – application to the T to R-transition in insulin. Mol Simul. 1993;10:291–308. [Google Scholar]
- 43.Ma J, Karplus M. The structural basis for the transition from Ras-GTP to Ras-GDP. Proc Natl Acad Sci USA. 1997;94:11905–11910. [Google Scholar]
- 44.Ma J, Sigler PB, Xu Z, Karplus M. A dynamic model for the allosteric mechanism of GroEL. J Mol Biol. 2000;302:303–313. doi: 10.1006/jmbi.2000.4014. [DOI] [PubMed] [Google Scholar]
- 45.Kong Y, Shen Y, Warth TE, Ma J. Conformational pathways in the gating of Escherichia coli mechanosensitive channel. Proc Natl Acad Sci USA. 2002;99:5999–6004. doi: 10.1073/pnas.092051099. [DOI] [PMC free article] [PubMed] [Google Scholar]
- 46.Zhang J, Li C, Chen K, Zhu W, Shen X, Jiang H. Conformational transition pathway in the allosteric process of human glucokinase. Proc Natl Acad Sci USA. 2006;103:13368–13373. doi: 10.1073/pnas.0605738103. [DOI] [PMC free article] [PubMed] [Google Scholar]
- 47.Shyur LF, Aleshin AE, Honzatko RB, Fromm HJ. Site-directed mutagenesis of residues at subunit interfaces of porcine fructose-1,6-bisphosphatase. J Biol Chem. 1996;271:3005–3010. doi: 10.1074/jbc.271.6.3005. [DOI] [PubMed] [Google Scholar]
- 48.Shyur LF, Aleshin AE, Honzatko RB, Fromm HJ. Biochemical properties of mutant and wild-type fructose-1,6-bisphosphatases are consistent with the coupling of intra- and intersubunit conformational changes in the T- and R-state transition. J Biol Chem. 1996;271:33301–33307. doi: 10.1074/jbc.271.52.33301. [DOI] [PubMed] [Google Scholar]
- 49.Lu G, Giroux EL, Kantrowitz ER. Importance of the dimer-dimer interface for allosteric signal transduction and AMP cooperativity of pig kidney fructose-1,6-bisphosphatase. Site-specific mutagenesis studies of Glu-192 and Asp-187 residues on the 190’s loop. J Biol Chem. 1997;297:5076–5087. doi: 10.1074/jbc.272.8.5076. [DOI] [PubMed] [Google Scholar]
- 50.Nelson SW, Honzatko RB, Fromm HJ. Hybrid tetramers of porcine liver fructose-1,6-bisphosphatase reveal multiple pathways of allosteric inhibition. J Biol Chem. 2002;277:15539–15545. doi: 10.1074/jbc.M112304200. [DOI] [PubMed] [Google Scholar]
- 51.Nelson SW, Honzatko RB, Fromm HJ. Origin of cooperativity in the activation of fructose-1,6-bisphosphatase by Mg2+ J Biol Chem. 2004;279:18481–18487. doi: 10.1074/jbc.M308811200. [DOI] [PubMed] [Google Scholar]
- 52.Cárcamo JG, Yañez AJ, Ludwig HC, León O, Pinto RO, Reyes AM, Slebe JC. The C1–C2 interface residue lysine 50 of pig kidney fructose-1,6-bisphosphatase has a crucial role in the cooperative signal transmission of the AMP inhibition. Eur J Biochem. 2000;267:2242–2251. doi: 10.1046/j.1432-1327.2000.01227.x. [DOI] [PubMed] [Google Scholar]
- 53.Nelson SW, Choe JY, Iancu CV, Honzatko RB, Fromm HJ. Mutations in the hinge of a dynamic loop broadly influence functional properties of fructose-1,6-bisphosphatase. J Biol Chem. 2000;275:29986–29992. doi: 10.1074/jbc.M000473200. [DOI] [PubMed] [Google Scholar]
- 54.Lu G, Stec B, Giroux EL, Kantrowitz ER. Evidence for an active T-state pig kidney fructose 1,6-bisphosphatase: interface residue Lys-42 is important for allosteric inhibition and AMP cooperativity. Protein Sci. 1996;5:2333–2342. doi: 10.1002/pro.5560051120. [DOI] [PMC free article] [PubMed] [Google Scholar]
- 55.Mesentean S, Koppole S, Smith JC, Fischer S. The principal motions involved in the coupling mechanism of the recovery stroke of the myosin motor. J Mol Biol. 2007;367:591–602. doi: 10.1016/j.jmb.2006.12.058. [DOI] [PubMed] [Google Scholar]
- 56.Kitao A, Loeffler HH. Collective dynamics of periplasmic glutamine binding protein upon domain closure. Biophys J. 2009;97:2541–2549. doi: 10.1016/j.bpj.2009.08.019. [DOI] [PMC free article] [PubMed] [Google Scholar]
- 57.Cardone A, Hassan SA, Albers RW, Sriram RD, Pant HC. Structural and dynamic determinants of ligand binding and regulation of cyclin-dependent kinase 5 by pathological activator p25 and inhibitory peptide CIP. J Mol Biol. 2010;401:478–492. doi: 10.1016/j.jmb.2010.06.040. [DOI] [PMC free article] [PubMed] [Google Scholar]
- 58.Mustafa M, Mirza A, Kannan N. Conformational regulation of the EGFR kinase core by the juxtamembrane and C-terminal tail: a molecular dynamics study. Proteins. 2011;79:99–114. doi: 10.1002/prot.22862. [DOI] [PubMed] [Google Scholar]
- 59.Fujiwara S, Amisaki T. Molecular dynamics study of conformational changes in human serum albumin by binding of fatty acids. Proteins. 2006;64:730–739. doi: 10.1002/prot.21053. [DOI] [PubMed] [Google Scholar]
- 60.Grant BJ, McCammon JA, Gorfe AA. Conformational selection in G-proteins: lessons from Ras and Rho. Biophys J. 2010;99:L87–89. doi: 10.1016/j.bpj.2010.10.020. [DOI] [PMC free article] [PubMed] [Google Scholar]
- 61.Kraulis PJ. MOLSCIPT: a program to produce both detailed and schematic plots of protein structures. J Appl Crystallogr. 1991;24:946–950. [Google Scholar]
- 62.The PyMOL Molecular Graphics System, Version 1.5.0.4. Schrödinger, LLC; Portland, OR: [Google Scholar]


