Abstract

To gain insight into the potential for aerosolization of viruses in wastewater systems, we investigated the partitioning of MS2 and Phi6 bacteriophages in synthetic sludge and anaerobically digested sludge from a wastewater treatment plant. We evaluated partitioning among the liquid, solids, and material surfaces of porcelain, concrete, polyvinyl chloride (PVC), and polypropylene. In all cases, at least 94% of the virions partitioned into the liquid fraction. In real sludge, no more than 0.8% of virions partitioned to the solids and no more than 6% to the material surface. Both MS2 and Phi6 partitioned more to the surface of concrete and polypropylene than to the surface of porcelain or PVC. Partitioning of viruses in wastewater among the liquid, biosolids, and material surface does not appear to mitigate the potential for aerosolization of virus, as most of the virus remains in the liquid phase.
Introduction
The Ebola outbreak in 2014 raised new questions about routes of transmission of the disease. Aerosol transmission is theoretically possible but remains unproven.1 Experiments with non-human primates have shown that inhalation exposure to Ebola virus can lead to fatal infection.2−4 Patients with Ebola virus disease expel large volumes of diarrhea,5,6 which may contain up to 107 genome copies of virus per milliliter,7 and toilets, sewer systems, and wastewater treatment plants are known to produce bioaerosols.8−19 The combination of these factors indicates that the potential exists for aerosolization of Ebola virus from wastewater systems. Sanitation facilities that are common in developed countries, such as pressure-assisted flush toilets and aeration basins, may provide opportunities for aerosolization of the virus that do not exist in western Africa, where the vast majority of cases of Ebola virus disease have occurred.
Given that Ebola is a high-consequence pathogen, it is critical to consider all possible exposure routes. What we define as the “secondary” aerosolization exposure route (i.e., aerosolization from sources other than the infected host) has been established as a concern for other diseases. For example, a combination of epidemiological, experimental, and modeling approaches suggests that aerosolization from toilets and sewer pipes contributed to an outbreak of severe acute respiratory syndrome in an apartment complex in Hong Kong in 2003.19 An important factor in determining the potential for a pathogen to spread via aerosolization from wastewater is partitioning among the aqueous phase, biosolids, which are not as easily aerosolized, and material surfaces. If a pathogen partitions preferentially to biosolids or surfaces, then the potential for aerosolization is reduced.
The goal of this research was to assess the partitioning of viruses in fluids and materials characteristic of modern wastewater systems. We measured the partitioning of an unenveloped virus (MS2) and an enveloped virus (Phi6) among the liquid phase, solids, and porcelain, polyvinyl chloride (PVC), polypropylene, and concrete surfaces, using both synthetic sludge and real, anaerobically digested sludge as model fluids. Results from this work will provide information not only about the potential for aerosolization of viruses but also about their fate in wastewater systems.
Methods
Because surface chemistry affects partitioning, we considered both unenveloped and lipid-enveloped viruses: MS2 and Phi6, respectively. MS2 (ATCC 15597-B1) is an icosahedral, single-stranded RNA bacteriophage ∼27 nm in diameter and is widely used as a surrogate for enteric viruses in environmental studies.20−23 Phi6 (kindly provided by P. Turner of Yale University, New Haven, CT) is an icosahedral, double-stranded RNA bacteriophage ∼85 nm in diameter and has been proposed as a surrogate for Ebola virus,24 although the structures of the two viruses differ (i.e., roughly spherical vs filamentous). Table S1 of the Supporting Information compares the structure of Ebola virus and the two surrogates. We propagated the bacteriophages using host bacteria, Escherichia coli and Pseudomonas syringae, and standard culture methods. Concentrations in stock suspensions were 108–1010 plaque-forming units per milliliter (PFU mL–1).
We tested four bowl-shaped materials commonly used in wastewater systems: porcelain, PVC, polypropylene, and concrete. The Supporting Information provides further details about the containers used in this study.
As a surrogate for diarrhea, we tested both synthetic sludge and real sludge collected from a wastewater treatment plant. We considered both types of sludge to balance a well-defined composition of the fluid against real-world conditions. For synthetic sludge, we followed a published recipe25 with the following modifications. We adjusted the solid content to match that of our actual sludge. We substituted egg white albumin for bovine serum albumin for economic reasons. We used a strain of Bacillus and E. coli isolated from anaerobically digested sludge as model Gram-positive and Gram-negative microorganisms of enteric relevance, rather than yeast. For real sludge, we collected anaerobically digested sludge from a wastewater treatment plant whose flow is dominated by domestic sources (>99%). We stored the sludge at 4 °C and used it within a few weeks of collection to ensure a robust population of microorganisms. Its total solid content was 30 g L–1, and its volatile solid content was 3.5%. Table S2 shows additional properties of the sludge. We did not sterilize the sludge out of concern that doing so would alter its properties and affect partitioning results. We seeded both types of sludge with MS2 or Phi6 to achieve a final bacteriophage concentration of 107 PFU mL–1.
We conducted experiments in triplicate for each combination of bacteriophage, material, and type of sludge (2 × 4 × 2 = 16 combinations), as illustrated in Figure S1. For each replicate, we filled a container with 10 mL of sludge seeded with bacteriophage and 40 mL of autoclaved, ultrapure water to achieve a dilution similar to what might occur with diarrhea in a toilet. After 5–10 min, we transferred the fluid, including suspended solids, to a sterile, 50 mL tube and centrifuged it at 1700 rcf for 3 min. We collected the supernatant as the “liquid” fraction. We poured excess fluid off the pelleted solids, briefly vortexed them, and denoted these as the “solid” fraction. Following established methods for recovery of viruses from surfaces,26,27 we collected the “surface” fraction using three sterile cotton swabs (Puritan 22029488) in series, each premoistened with sterile LB broth. We swabbed systematically and with constant pressure over the entire exposed surface area and subsequently eluted virus from the three swabs into 1 mL of LB broth by compressing and swirling the swab in a sample tube. The swabbed surface area was ∼115 cm2 (±10%) for all materials.
To prepare samples for analysis by quantitative polymerase chain reaction (qPCR), we first converted RNA to cDNA. Immediately upon separating the fractions, we extracted RNA from 140 μL subsamples of each fraction using a Qiagen QiAamp Viral RNA kit. For calibration standards, we also extracted viral RNA from serially diluted stock suspensions of each bacteriophage, whose concentration (PFU mL–1) was determined by a plaque assay, and carried it through the entire preparation and analysis process.28,29 We omitted carrier RNA from the extraction processes to increase RNA extraction efficiency, and we subjected Phi6 RNA to a postextraction heat shock treatment (110 °C, 5 min).30 We immediately synthesized cDNA using a Bio-Rad iScript cDNA Synthesis Kit with 5 μL of template RNA, 4 μL of iScript 5x, 1 μL of reverse transcriptase, and 10 μL of nuclease-free water, using the kit’s recommended thermocycler protocol. We stored samples at −20 °C until they were analyzed.
We used qPCR to quantify virus concentration in each fraction and in the calibration standards in terms of PFU equivalents per milliliter. We analyzed fractions from synthetic sludge in triplicate (experimental replicates) by intercalating dye-based qPCR using Bio-Rad SYBR Green Mastermix with 5 μL of SYBR Green, 400 nM forward and reverse primers,30,31 2.4 μL of nuclease-free water, and 1 μL of cDNA template. We analyzed fractions from real sludge in triplicate (experimental replicates) by probe-based qPCR using Bio-Rad iQ Supermix with 5 μL of iQ Supermix, 400 nM forward and reverse primers, 300 nM probe,30 1.72 μL of nuclease-free water, and 1 μL of cDNA template. Table S3 shows the primers and probes, and Table S4 lists the qPCR conditions.
For quality control, we employed serial dilutions of genomically sequenced calibration standards, triplicate reactions, negative template controls, and melt curve analysis. The calibration curve covered a minimum of 6 orders of magnitude to equate qPCR amplification of genomic copies to the concentration determined by a plaque assay in standards. R2 values for calibration curves ranged from 0.96 to 0.99. We prepared serial dilutions of cDNA and analyzed all standards and samples in triplicate (technical replicates) on the qPCR machine (Bio-Rad CFX96 real-time system and C1000 thermal cycler). Negative template controls did not amplify. Additional controls are described in the Supporting Information. Of the 144 individual experimental replicates, we discarded four that failed to amplify. We reviewed preliminary qPCR results using the machine’s software to verify the calibration curve and melt curve, including quantification cycle results. Melt curve analysis showed a single, well-defined peak at the expected melt temperature for the genome.
Results and Discussion
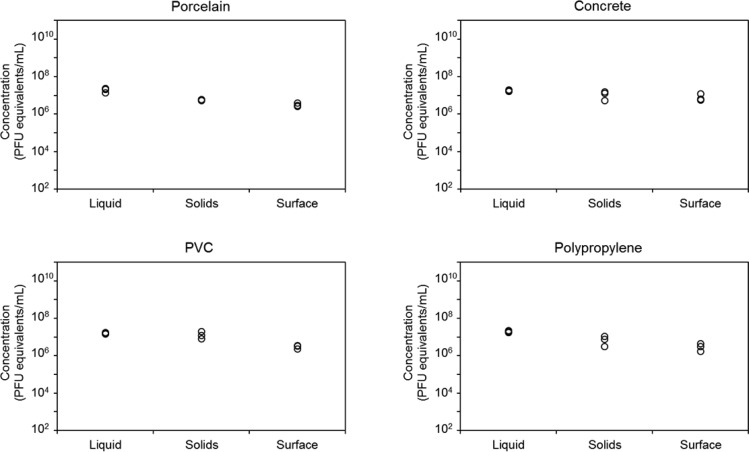
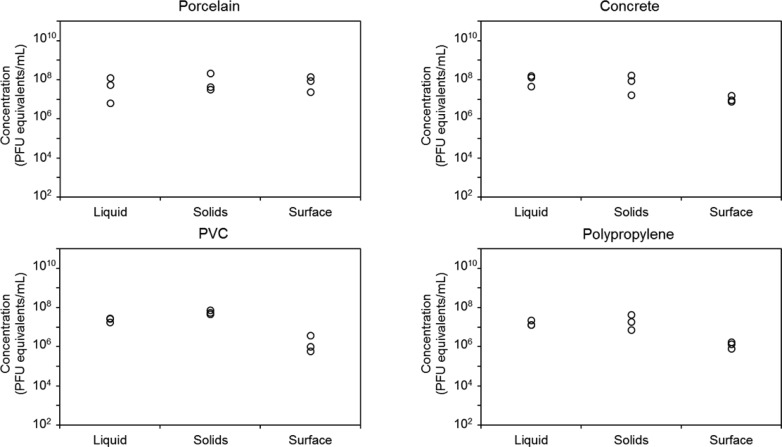
We spiked MS2, an unenveloped bacteriophage, and Phi6, an enveloped bacteriophage, into diluted synthetic and real sludge in porcelain, concrete, PVC, and polypropylene containers and measured partitioning among the liquid, solids, and the interior surface of the container. Figures 1 and 2 show the concentrations of MS2 and Phi6, respectively, in terms of PFU equivalents in three experimental replicates of each fraction derived from diluted synthetic sludge. The three fractions were 46 mL of liquid, 4 mL of wetted solids, and 1 mL of surface extract. MS2 and Phi6 partitioned similarly in synthetic sludge; concentrations were highest in the liquid and solid phases for all materials tested, with the exception of Phi6 in porcelain, where Phi6 concentrations were comparable in all three fractions. Mean concentrations of MS2 in each fraction were within 1 order of magnitude of each other, while mean concentrations of Phi6 varied by up to 2 orders of magnitude. Background concentrations of genomic material were detectable in both types of sludge, particularly for Phi6, but were at least 4 orders of magnitude lower than in the seeded sludge.
Figure 1.
Concentration of MS2 bacteriophage, determined by qPCR and reported in PFU equivalents per milliliter, in synthetic sludge diluted 5-fold in water in each of three phases: 46 mL of liquid, 4 mL of wetted solids, and 1 mL of material surface extract for porcelain, concrete, PVC, and polypropylene. Each point represents an experimental replicate.
Figure 2.
Concentration of Phi6 bacteriophage, determined by qPCR and reported in PFU equivalents per milliliter, in synthetic sludge diluted 5-fold in water in each of three phases: 46 mL of liquid, 4 mL of wetted solids, and 1 mL of material surface extract for porcelain, concrete, PVC, and polypropylene. Each point represents an experimental replicate.
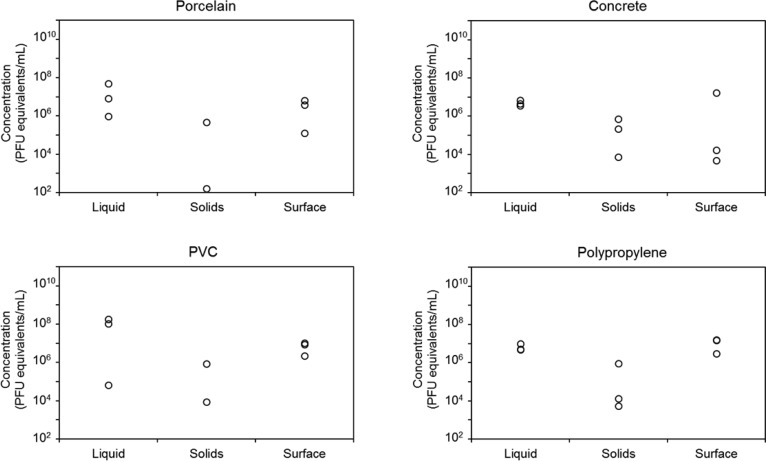
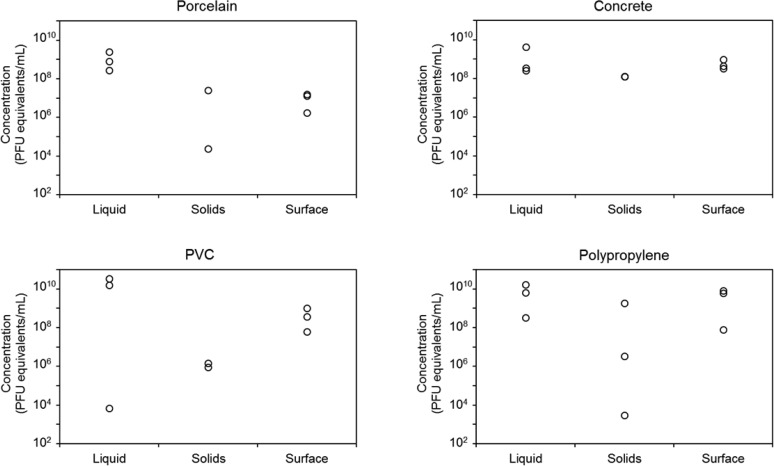
Figures 3 and 4 show the concentrations of MS2 and Phi6, respectively, in terms of PFU equivalents in three experimental replicates of each fraction derived from diluted, real, anaerobically digested sludge. The variability was much larger in real sludge than in synthetic sludge, likely due to heterogeneities in the real sludge. The average concentration of MS2 in the solid fraction was ∼2 orders of magnitude lower than in the other fractions for all materials except concrete. Average concentrations of MS2 were highest in the liquid fraction for concrete, porcelain, and PVC (Figure 3). In polypropylene, the highest concentration was found in the surface extract. The average concentrations of MS2 in the liquid and surface extract from concrete were of a similar order of magnitude; however, the surface samples exhibited much larger variability. Average concentrations of Phi6 in real, anaerobically digested sludge were highest in the liquid fraction for all materials. Average concentrations were ∼1–2 orders of magnitude lower in the surface extract and were 2–4 orders of magnitude lower in the wetted solids (Figure 4).
Figure 3.
Concentration of MS2 bacteriophage, determined by qPCR and reported in PFU equivalents per milliliter, in anaerobically digested sludge diluted 5-fold in water in each of three phases: 46 mL of liquid, 4 mL of wetted solids, and 1 mL of material surface extract for porcelain, concrete, PVC, and polypropylene. Each point represents an experimental replicate.
Figure 4.
Concentration of Phi6 bacteriophage, determined by qPCR and reported in PFU equivalents per milliliter, in anaerobically digested sludge diluted 5-fold in water in each of three phases: 46 mL of liquid, 4 mL of wetted solids, and 1 mL of material surface extract for porcelain, concrete, PVC, and polypropylene. Each point represents an experimental replicate, and there are three nearly overlapping points for solids in concrete.
A mass balance indicated that the sum of virions recovered (PFUs) from all three fractions was roughly within 1 order of magnitude of the number of virions initially spiked into the samples (Table S5), so the amount of virus recovered was close to the amount spiked into the samples. One exception was Phi6 in real sludge, for which the total amount of virus recovered was 2–3 orders of magnitude higher, on average, than the number of virions spiked into the samples for all four material types. A negative control consisting of sludge that was not spiked with virus failed to amplify, so the extra virus did not originate from the sludge. It appears that Phi6 replicated rapidly in host bacteria present in the sludge during the experiment, and thus, the partitioning results represent both spiked and new virus.
Figure S2 shows the partitioning of MS2 and Phi6 among the three fractions for synthetic and real sludge and all four materials. In all cases, at least 94% of the virions partitioned into the liquid fraction. In synthetic sludge, up to 4% of virions partitioned to the solids, while in real sludge, no more than 0.8% of virions partitioned to the solids. In synthetic sludge, partitioning to the material surface was low, at most 1% except for Phi6 in porcelain, where 6% of virions partitioned to the surface. In real sludge, partitioning to the material surface was also low, although both MS2 and Phi6 partitioned more to the surface of concrete and polypropylene than to the surface of porcelain and PVC.
This study demonstrates that partitioning of viruses in wastewater among the liquid, biosolids, and material surface does not mitigate the potential for aerosolization of virus, as most of the virus remains in the liquid phase. Airborne viruses have been detected at wastewater treatment facilities at concentrations as high as 3 × 10⁶ genome copies m–3 for adenovirus.17,32 Previous studies have shown that virus removal efficiency in wastewater treatment plants ranges widely from 0 to 4 logs.33−35 In contrast to our results, some of these studies have shown that viruses adsorb well to solids. Our results are consistent with the general finding that the extent of removal of bacteria is greater than the extent of removal of virus in conventional treatment plants.
With respect to concerns about transmission of Ebola virus, one limitation of this study is that the surrogate viruses may not be representative of Ebola virus. Its filamentous shape may make it more or less prone to adsorb to solids and surfaces. Another limitation is that the time allowed for partitioning was only 5–10 min, which could be representative of the time excreta remains in a toilet before flushing but is much shorter than the residence time in sewers and at wastewater treatment plants.
We have identified five potential sources of uncertainty in quantification of virus concentrations. Although our qPCR calibration curves had high R2 values, the differing matrices of the three fractions may have produced varying extraction and amplification efficiencies. It is possible that genomic material from inactivated virus and/or exogenous genomic material was counted as PFU equivalents. Inhibitors are a challenge for any PCR analysis and if severe will result in false negatives or underestimates of gene copy levels. In this study, we expect that any effects of inhibitors would have been minimal, as we were operating at the mid to upper end of the calibration curve and did not have difficulty detecting virus in any of the samples. Also, the mass balances did not suggest a major loss of virus. Because of requirements of the experimental approach, the surface fraction also included any virions present in the residual liquid that remained in the bowls after pouring out the contents; allowing the bowls to dry out completely prior to swabbing would not have eliminated these virions. Previous studies have shown that the swabbing method recovers 7–58% of viruses from dry environmental surfaces, depending on the type of swab, virus, surface material, and virus assay (culture vs molecular).26,27 Thus, there is the possibility for both overestimation and underestimation of the amount of virus that partitioned to porcelain, concrete, PVC, and polypropylene in this study. The mass balance (Table S5) suggests that large amounts of virus were not lost during the experiment, but even if the actual numbers of virions on surfaces were 10 times higher, the majority of virions would still be associated with the liquid phase.
Acknowledgments
This research was supported by the National Science Foundation under a RAPID award (CBET-1509493), the Water Environment Research Foundation (2C15), and the National Institutes of Health (NIH) through the NIH Director’s New Innovator Award Program (1-DP2-A1112243). Virginia Tech’s Institute for Critical Technology and Applied Science provided laboratory resources. We thank K. Lin, J. Metch, M. Munir, A. J. Prussin II, and employees at the Christiansburg Wastewater Treatment Plant for assistance with this research. Although M.T.L. is currently employed by the U.S. Environmental Protection Agency, this research was completed at Virginia Tech.
Supporting Information Available
The Supporting Information is available free of charge on the ACS Publications website at DOI: 10.1021/acs.estlett.6b00105.
Comparison of virus properties; sludge properties; details about containers; schematic of virus, sludge, and material combinations; primers and qPCR conditions; experimental controls; mass balance on virions; and partitioning of virus in each fraction by percentage (PDF)
The views expressed in this manuscript are solely those of the authors and do not represent the policies of the US Environmental Protection Agency.
The authors declare no competing financial interest.
Supplementary Material
References
- Osterholm M. T.; Moore K. A.; Kelley N. S.; Brosseau L. M.; Wong G.; Murphy F. A.; Peters C. J.; LeDuc J. W.; Russell P. K.; Van Herp M.; et al. Transmission of Ebola Viruses: What We Know and What We Do Not Know. mBio 2015, 6, e00137-15. 10.1128/mBio.00137-15. [DOI] [PMC free article] [PubMed] [Google Scholar]
- Jaax N.; Jahrling P.; Geisbert T.; Geisbert J.; Steele K.; McKee K.; Nagley D.; Johnson E.; Jaax G.; Peters C. Transmission of Ebola Virus (Zaire Strain) to Uninfected Control Monkeys in a Biocontainment Laboratory. Lancet 1995, 346, 1669–71. 10.1016/S0140-6736(95)92841-3. [DOI] [PubMed] [Google Scholar]
- Johnson E.; Jaax N.; White J.; Jahrling P. Lethal Experimental Infections of Rhesus Monkeys by Aerosolized Ebola Virus. Int. J. Exp. Pathol. 1995, 76, 227–36. [PMC free article] [PubMed] [Google Scholar]
- Reed D. S.; Lackemeyer M. G.; Garza N. L.; Sullivan L. J.; Nichols D. K. Aerosol Exposure to Zaire Ebolavirus in Three Nonhuman Primate Species: Differences in Disease Course and Clinical Pathology. Microbes Infect. 2011, 13, 930–6. 10.1016/j.micinf.2011.05.002. [DOI] [PubMed] [Google Scholar]
- Chertow D. S.; Kleine C.; Edwards J. K.; Scaini R.; Giuliani R.; Sprecher A. Ebola Virus Disease in West Africa — Clinical Manifestations and Management. N. Engl. J. Med. 2014, 371, 2054–2057. 10.1056/NEJMp1413084. [DOI] [PubMed] [Google Scholar]
- Kreuels B.; Wichmann D.; Emmerich P.; Schmidt-Chanasit J.; de Heer G.; Kluge S.; Sow A.; Renné T.; Günther S.; Lohse A. W.; et al. A Case of Severe Ebola Virus Infection Complicated by Gram-Negative Septicemia. N. Engl. J. Med. 2014, 371, 2394–2401. 10.1056/NEJMoa1411677. [DOI] [PubMed] [Google Scholar]
- Wolf T.; Kann G.; Becker S.; Stephan C.; Brodt H.-R.; de Leuw P.; Grünewald T.; Vogl T.; Kempf V. A. J.; Keppler O. T.; Zacharowski K. Severe Ebola Virus Disease with Vascular Leakage and Multiorgan Failure: Treatment of a Patient in Intensive Care. Lancet 2015, 385, 1428–1435. 10.1016/S0140-6736(14)62384-9. [DOI] [PubMed] [Google Scholar]
- Barker J.; Jones M. V. The Potential Spread of Infection Caused by Aerosol Contamination of Surfaces after Flushing a Domestic Toilet. J. Appl. Microbiol. 2005, 99, 339–347. 10.1111/j.1365-2672.2005.02610.x. [DOI] [PubMed] [Google Scholar]
- Best E. L.; Sandoe J. A.; Wilcox M. H. Potential for Aerosolization of Clostridium Difficile after Flushing Toilets: The Role of Toilet Lids in Reducing Environmental Contamination Risk. J. Hosp. Infect. 2012, 80, 1–5. 10.1016/j.jhin.2011.08.010. [DOI] [PubMed] [Google Scholar]
- Fernando N. L.; Fedorak P. M. Changes at an Activated Sludge Sewage Treatment Plant Alter the Numbers of Airborne Aerobic Microorganisms. Water Res. 2005, 39, 4597–4608. 10.1016/j.watres.2005.08.010. [DOI] [PubMed] [Google Scholar]
- Fracchia L.; Pietronave S.; Rinaldi M.; Giovanna Martinotti M. Site-Related Airborne Biological Hazard and Seasonal Variations in Two Wastewater Treatment Plants. Water Res. 2006, 40, 1985–1994. 10.1016/j.watres.2006.03.016. [DOI] [PubMed] [Google Scholar]
- Gerba C. P.; Wallis C.; Melnick J. L. Microbiological Hazards of Household Toilets: Droplet Production and the Fate of Residual Organisms. Appl. Microbiol. 1975, 30, 229–237. [DOI] [PMC free article] [PubMed] [Google Scholar]
- Haas D.; Unteregger M.; Habib J.; Galler H.; Marth E.; Reinthaler F. Exposure to Bioaerosol from Sewage Systems. Water, Air, Soil Pollut. 2010, 207, 49–56. 10.1007/s11270-009-0118-5. [DOI] [Google Scholar]
- Johnson D.; Lynch R.; Marshall C.; Mead K.; Hirst D. Aerosol Generation by Modern Flush Toilets. Aerosol Sci. Technol. 2013, 47, 1047–1057. 10.1080/02786826.2013.814911. [DOI] [PMC free article] [PubMed] [Google Scholar]
- Johnson D. L.; Mead K. R.; Lynch R. A.; Hirst D. V. L Lifting the Lid on Toilet Plume Aerosol: A Literature Review with Suggestions for Future Research. Am. J. Infect. Control 2013, 41, 254–258. 10.1016/j.ajic.2012.04.330. [DOI] [PMC free article] [PubMed] [Google Scholar]
- Karra S.; Katsivela E. Microorganisms in Bioaerosol Emissions from Wastewater Treatment Plants During Summer at a Mediterranean Site. Water Res. 2007, 41, 1355–1365. 10.1016/j.watres.2006.12.014. [DOI] [PubMed] [Google Scholar]
- Masclaux F. G.; Hotz P.; Gashi D.; Savova-Bianchi D.; Oppliger A. Assessment of Airborne Virus Contamination in Wastewater Treatment Plants. Environ. Res. 2014, 133, 260–265. 10.1016/j.envres.2014.06.002. [DOI] [PubMed] [Google Scholar]
- Oppliger A.; Hilfiker S.; Vu Duc T. Influence of Seasons and Sampling Strategy on Assessment of Bioaerosols in Sewage Treatment Plants in Switzerland. Ann. Occup. Hyg. 2005, 49, 393–400. 10.1093/annhyg/meh108. [DOI] [PubMed] [Google Scholar]
- Yu I. T. S.; Li Y.; Wong T. W.; Tam W.; Chan A. T.; Lee J. H. W.; Leung D. Y. C.; Ho T. Evidence of Airborne Transmission of the Severe Acute Respiratory Syndrome Virus. N. Engl. J. Med. 2004, 350, 1731–1739. 10.1056/NEJMoa032867. [DOI] [PubMed] [Google Scholar]
- Bae J.; Schwab K. J. Evaluation of Murine Norovirus, Feline Calicivirus, Poliovirus, and MS2 as Surrogates for Human Norovirus in a Model of Viral Persistence in Surface Water and Groundwater. Appl. Environ. Microb. 2008, 74, 477–484. 10.1128/AEM.02095-06. [DOI] [PMC free article] [PubMed] [Google Scholar]
- Deboosere N.; Pinon A.; Caudrelier Y.; Delobel A.; Merle G.; Perelle S.; Temmam S.; Loutreul J.; Morin T.; Estienney M.; et al. Adhesion of Human Pathogenic Enteric Viruses and Surrogate Viruses to Inert and Vegetal Food Surfaces. Food Microbiol. 2012, 32, 48–56. 10.1016/j.fm.2012.04.007. [DOI] [PubMed] [Google Scholar]
- Helmer R. D.; Finch G. R. Use of MS2 Coliphage as a Surrogate for Enteric Viruses in Surface Waters Disinfected with Ozone. Ozone: Sci. Eng. 1993, 15, 279–293. 10.1080/01919519308552490. [DOI] [Google Scholar]
- Tung-Thompson G.; Libera D. A.; Koch K. L.; de los Reyes F. L. III; Jaykus L.-A. Aerosolization of a Human Norovirus Surrogate, Bacteriophage MS2, During Simulated Vomiting. PLoS One 2015, 10, e0134277. 10.1371/journal.pone.0134277. [DOI] [PMC free article] [PubMed] [Google Scholar]
- Casanova L. M.; Weaver S. R. Inactivation of an Enveloped Surrogate Virus in Human Sewage. Environ. Sci. Technol. Lett. 2015, 2, 76–78. 10.1021/acs.estlett.5b00029. [DOI] [Google Scholar]
- Baudez J. C.; Ginisty P.; Peuchot C.; Spinosa L. The Preparation of Synthetic Sludge for Lab Testing. Water Sci. Technol. 2007, 56, 67–74. 10.2166/wst.2007.714. [DOI] [PubMed] [Google Scholar]
- Julian T. R.; Tamayo F. J.; Leckie J. O.; Boehm A. B. Comparison of Surface Sampling Methods for Virus Recovery from Fomites. Appl. Environ. Microb. 2011, 77, 6918–6925. 10.1128/AEM.05709-11. [DOI] [PMC free article] [PubMed] [Google Scholar]
- Scherer K.; Mäde D.; Ellerbroek L.; Schulenburg J.; Johne R.; Klein G. Application of a Swab Sampling Method for the Detection of Norovirus and Rotavirus on Artificially Contaminated Food and Environmental Surfaces. Food Environ. Virol. 2009, 1, 42–49. 10.1007/s12560-008-9007-0. [DOI] [Google Scholar]
- Hartman A. L.; Bird B. H.; Towner J. S.; Antoniadou Z.-A.; Zaki S. R.; Nichol S. T. Inhibition of IRF-3 Activation by VP35 Is Critical for the High Level of Virulence of Ebola Virus. J. Virol. 2008, 82, 2699–2704. 10.1128/JVI.02344-07. [DOI] [PMC free article] [PubMed] [Google Scholar]
- Wright P. F.; Deatly A. M.; Karron R. A.; Belshe R. B.; Shi J. R.; Gruber W. C.; Zhu Y.; Randolph V. B. Comparison of Results of Detection of Rhinovirus by PCR and Viral Culture in Human Nasal Wash Specimens from Subjects with and without Clinical Symptoms of Respiratory Illness. J. Clin. Microbiol. 2007, 45, 2126–2129. 10.1128/JCM.02553-06. [DOI] [PMC free article] [PubMed] [Google Scholar]
- Gendron L.; Verreault D.; Veillette M.; Moineau S.; Duchaine C. Evaluation of Filters for the Sampling and Quantification of RNA Phage Aerosols. Aerosol Sci. Technol. 2010, 44, 893–901. 10.1080/02786826.2010.501351. [DOI] [Google Scholar]
- Pecson B. M.; Martin L. V.; Kohn T. Quantitative PCR for Determining the Infectivity of Bacteriophage MS2 Upon Inactivation by Heat, UV-B Radiation, and Singlet Oxygen: Advantages and Limitations of an Enzymatic Treatment to Reduce False-Positive Results. Appl. Environ. Microb. 2009, 75, 5544–5554. 10.1128/AEM.00425-09. [DOI] [PMC free article] [PubMed] [Google Scholar]
- Fannin K. F.; Gannon J. J.; Cochran K. W.; Spendlove J. C. Field Studies on Coliphages and Coliforms as Indicators of Airborne Animal Viral Contamination from Wastewater Treatment Facilities. Water Res. 1977, 11, 181–188. 10.1016/0043-1354(77)90124-5. [DOI] [Google Scholar]
- Hurst C. J.; Gerba C. P. Fate of Viruses During Wastewater Sludge Treatment Processes. Crit. Rev. Environ. Control 1989, 18, 317–343. 10.1080/10643388909388352. [DOI] [Google Scholar]
- Xagoraraki I.; Yin Z.; Svambayev Z. Fate of Viruses in Water Systems. J. Environ. Eng. 2014, 140, 04014020. 10.1061/(ASCE)EE.1943-7870.0000827. [DOI] [Google Scholar]
- Carducci A.; Morici P.; Pizzi F.; Battistini R.; Rovini E.; Verani M. Study of the Viral Removal Efficiency in a Urban Wastewater Treatment Plant. Water Sci. Technol. 2008, 58, 893–897. 10.2166/wst.2008.437. [DOI] [PubMed] [Google Scholar]
Associated Data
This section collects any data citations, data availability statements, or supplementary materials included in this article.


