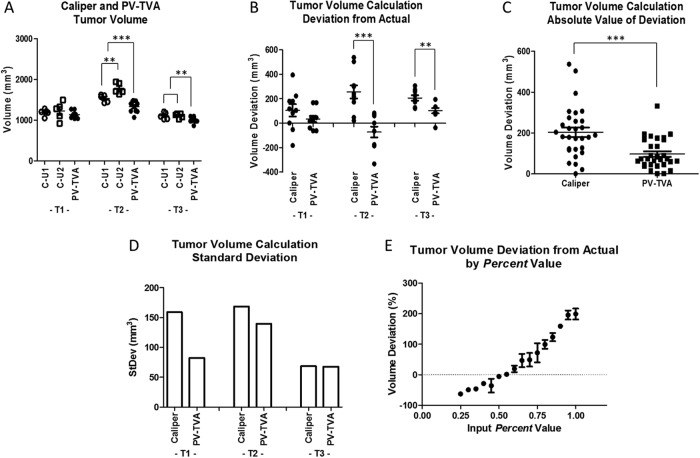
Figure 3.
Tumor volumes for 3 HT1080 tumors (T1, T2, and T3) as determined using the caliper measurement method for 2 users (C-U1 and C-U2), and the planar view tumor volume algorithm (PV-TVA) (Percent = 0.55) (A). Tumor volume calculation deviations from the actual volume as measured using postresection water displacement (B). Absolute value of the deviations of the tumor volume calculation methods to measure the accuracy (C). Average standard deviations of 10 measurements for each of the 3 tumors to measure the precision (D). Validation for the Percent value selected to calculate tumor volume (E). *P ≤ .05, **P ≤ .01, and ***P ≤ .001.

