Abstract
Pyramidal cell structure varies between different cortical areas and species, indicating that the cortical circuits that these cells participate in are likely to be characterized by different functional capabilities. Structural differences between cortical layers have been traditionally reported using either the Golgi method or intracellular labeling, but the structure of pyramidal cells has not previously been systematically analyzed across all cortical layers at a particular age. In the present study, we investigated the dendritic architecture of complete basal arbors of pyramidal neurons in layers II, III, IV, Va, Vb, and VI of the hindlimb somatosensory cortical region of postnatal day 14 rats. We found that the characteristics of basal dendritic morphologies are statistically different in each cortical layer. The variations in size and branching pattern that exist between pyramidal cells of different cortical layers probably reflect the particular functional properties that are characteristic of the cortical circuit in which they participate. This new set of complete basal dendritic arbors of 3D-reconstructed pyramidal cell morphologies across each cortical layer will provide new insights into interlaminar information processing in the cerebral cortex.
Keywords: 3D reconstructions, branching pattern, cerebral cortex, cortical layer, intracellular injections, lucifer yellow, statistical univariate analysis
Introduction
In the neocortex, the most abundant and characteristic type of neuron is the pyramidal cell. These neurons are the main projection neurons, since most of the processed information leaves the cortex through the axons of pyramidal cells to reach other cortical areas or subcortical nuclei. Also, the dendritic spines of pyramidal cells are the main postsynaptic targets of excitatory glutamatergic synapses. In turn, pyramidal cell axons constitute the main source of these synapses. Thus, pyramidal cells can be considered basic building elements of the neocortex (reviewed in DeFelipe and Fariñas 1992).
Pyramidal neurons are located in all cortical layers except layer I and they are commonly categorized according to their projection site (e.g., Jones 1984; White 1989). Not only pyramidal cells located in different layers participate in different synaptic circuits, but also the pyramidal cells located in distinct cortical regions are involved in different circuits, thereby segregating particular cortical functions. The dendritic pattern of pyramidal cells has been reported to be area specific. For example, pyramidal cells in the temporal lobe of higher primates are larger, but less spinous, than those of the granular prefrontal cortex (Lund et al. 1993; Elston et al. 2001; Jacobs et al. 2001; Elston and Rockland 2002; Elston et al. 2011; Bianchi et al. 2013; Oga et al. 2013). Regional variations in pyramidal cell structure have also been reported in mice, although a lower percentage of variation was observed (Benavides-Piccione et al. 2006; Ballesteros-Yáñez et al. 2010; van Aerde and Feldmeyer 2015). Functionally, differences in the patterns of dendritic branching may determine the degree to which the integration of inputs is compartmentalized within their arbors, with the complexity in dendritic structure representing a determinant of their biophysical properties which influences their functional capacity (e.g., Koch et al. 1982; Poirazi and Mel 2001; London and Häusser 2005; Spruston 2008; van Elburg and van Ooyen 2010).
Structural differences between supragranular and infragranular cortical layers have been reported, using the Golgi method or intracellular labeling, in different species and ages including humans (e.g., Conel 1959; Hendry and Jones 1983; Larkman 1991; Elston 2001; Oberlaender et al. 2012). These studies report laminar variations in cell morphology depending on species and age. However, pyramidal cells have not been quantified and subject to rigorous statistical comparison across cortical layers at a particular age. In the present study, we investigated the dendritic architecture of complete basal arbors of pyramidal neurons in layers II, III, IV, Va, Vb, and VI of the hindlimb somatosensory (S1HL) neocortex of P14 rats and found that the characteristics of these architectures are statistically different in each cortical layer. We chose the S1HL of P14 Wistar rats, because we intend to integrate these data with other detailed anatomical, molecular and physiological data that have already been collected from the same cortical region and age. The aim is to create a detailed, biologically accurate model of circuitry through layers II–VI in the primary somatosensory cortex, within the framework of the Blue Brain Project (http://bluebrain.epfl.ch/ and http://cajalbbp.cesvima.upm.es/). The complete dataset of the 3D reconstructed morphologies, processing metadata and provenance information, will be made accessed via the HBP Neuroinformatic platform (NIP).
Materials and Methods
Tissue Preparation and Intracellular Injections
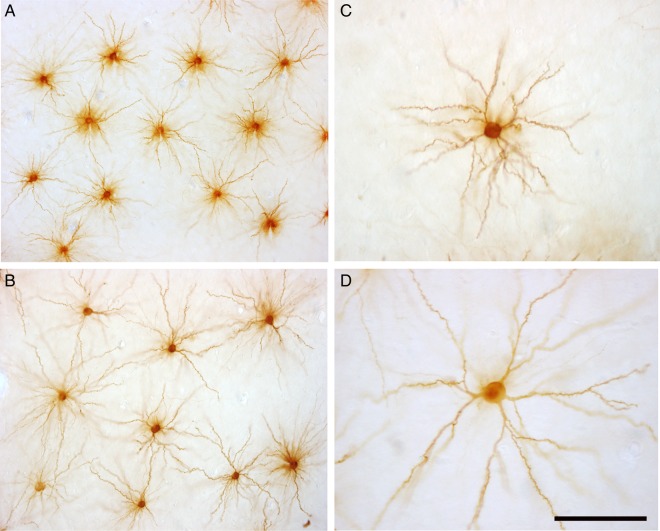
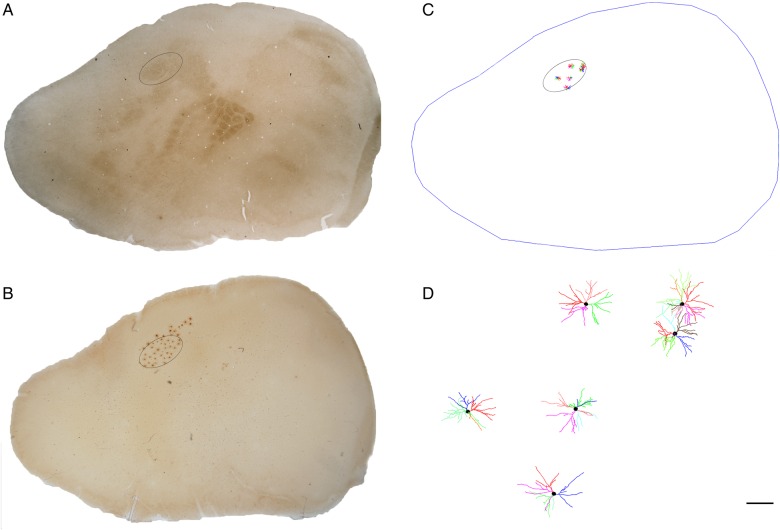
Wistar rats (n = 20, postnatal day 14; P14) were overdosed by intraperitoneal injection of sodium pentobarbitone, and perfused intracardially with 4% paraformaldehyde. Their brains were then removed and the cortex of the left hemisphere flattened between two glass slides (e.g., Welker and Woolsey 1974) and further immersed in 4% paraformaldehyde for 24 h. Sections (150−200 μm) were cut parallel to the cortical surface with a vibratome. By relating these sections to coronal sections, we were able to identify, using cytoarchitectural differences, the section that contained each cortical layer (II, III, IV, Va, Vb, VI), allowing the subsequent injection of cells (e.g., Elston and Rosa 1997) in the hindlimb somatosensory cortical region [approximately corresponding to area S1HL of Franklin and Paxinos (1997)]. Due to technical reasons, it was not possible to obtain sections from each cortical layer in each animal. Thus, a total of 20 animals were necessary to obtain 8 horizontal section samples per cortical layer. Our cell injection methodology has been described in detail elsewhere (e.g., Elston et al. 2001; Ballesteros-Yáñez et al. 2010). Briefly, cells were labeled with 4,6 diamino-2-phenylindole (DAPI; Sigma, St Louis, MO) and then individually injected with Lucifer Yellow (LY), by continuous current that was applied until the distal tips of each dendrite fluoresced brightly, indicating that the dendrites were completely filled and ensuring that the fluorescence did not diminish at a distance from the soma. After injection of neurons, the sections were processed with a rabbit antibody to LY (generated at the Cajal Institute) and thereafter treated with a biotinylated donkey anti-rabbit secondary antibody (1:200; RPN1004; Amersham Pharmacia Biotech), followed by a biotin–horseradish peroxidase complex (1:200; RPN1051; Amersham). Finally, 3,3′-Diaminobenzidine (DAB; D8001; Sigma Chemical Co.) was used as the chromogen, allowing the visualization of the entire basal dendritic arbor of pyramidal neurons (Fig. 1). Cytochrome oxidase (CO) staining was used to label dark modules in layer IV somatosensory cortex (Wong-Riley and Welt 1980; Jain et al. 2003) in order to locate the hindlimb somatosensory cortical region (Fig. 2).
Figure 1.
(A,B) Low-power photomicrographs showing injected neurons in layers II, and Va, respectively, from the S1HL region of P14 rats, as seen in the plane of section parallel to the cortical surface. (C,D) Higher magnification photomicrographs showing an example of a pyramidal cell basal dendritic arbor in layers II and Va, respectively. Scale bar = 200 μm in A,B; 90 μm in C,D.
Figure 2.
(A) Low-power photomicrograph showing cytochrome oxidase staining used to label dark modules in layer IV in order to locate the hindlimb (S1HL) somatosensory cortical region (elypsoid). (B) Low-power photomicrograph showing injected neurons in layer III from the S1HL region (elypsoid), as seen in the plane of section parallel to the cortical surface. (C) Schematic drawing of the basal arbors of pyramidal neurons reconstructed from the S1HL region (elypsoid) in section shown in B. (D) Higher magnification image of the neurons shown in C. Scale bar (in D) = 1000 μm in A−C and 125 μm in D.
Cell Reconstruction and Quantitative Analysis
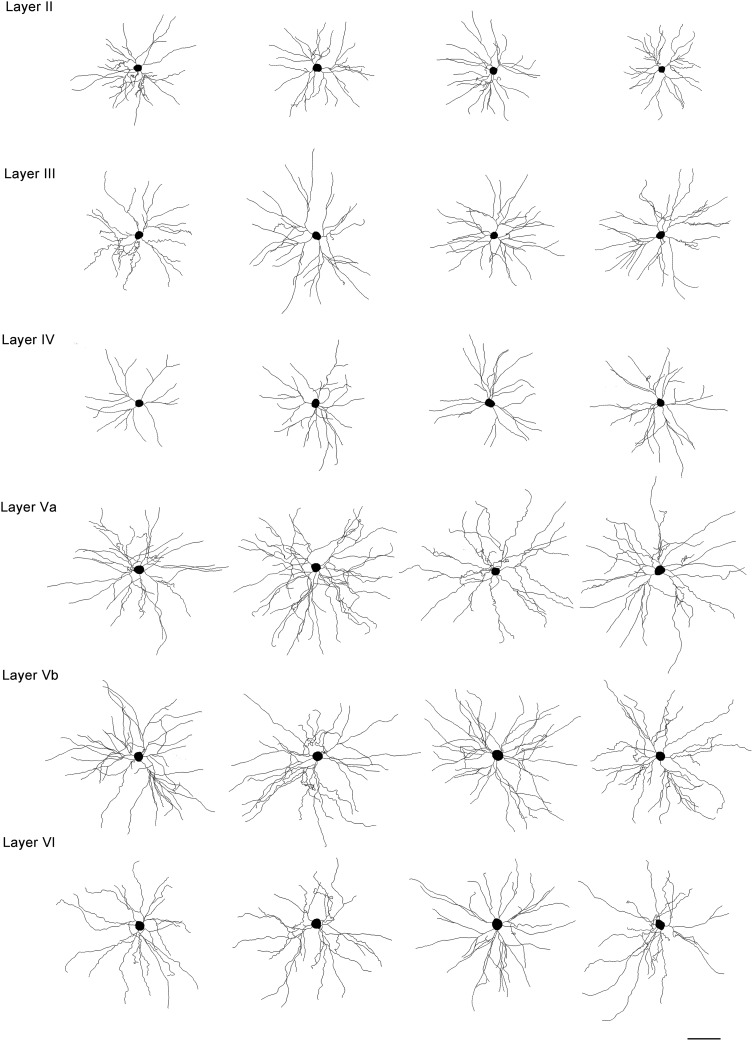
The Neurolucida package (MicroBrightField) was used to three-dimensionally trace the basal dendritic arbor of each pyramidal cell (Fig. 3). Only neurons that had an unambiguous apical dendrite were included in this analysis. Specifically, in layer IV, since excitatory cells include a mixed population of spiny cell types —L4 pyramids, star pyramids and spiny stellates, depending on the extension of the apical dendrite into upper layers and the shape of the soma (Jones 1975; Staiger et al. 2004)—we made no specific distinction between star pyramid and pyramidal morphologies, both of which are referred to as “pyramid.” Additionally, only neurons whose basal dendritic tree was completely filled and contained within the section were included in the analysis. Furthermore, we discarded cells that were not located in the S1HL region, as visualized by the distinct array of functionally specific CO modules (Fig. 2). Finally, 48 cells from each layer were included in the analysis (6 cells per layer, 6 layers, 8 animals) comprising a total of 288 cells (see Supplementary Figs 1–6). For each cell, the following morphological variables were measured using Neurolucida.
Figure 3.
Schematic drawings of the basal arbors of pyramidal neurons, as seen in the plane of section parallel to the cortical surface, from the S1HL region of P14 rats. The cells illustrated are of approximately average size for each group. Scale bar = 100 μm.
The cell body area, estimated by measuring the maximum perimeter of the soma; Convex hull 2D (basal dendritic field area) and convex hull 3D volume of the basal dendritic arbor; number of dendrites, dendritic length, nodes, and endings expressed as total numbers, as a function of the distance from soma (sholl analysis), and per branch order; fractal kdim (the degree to which the dendritic arbor has a scale-invariant topology); VA/VB ratio from Vertex analysis (where VA = bifurcating nodes that have 2 terminating branches and VB = bifurcating nodes that have 1 terminating and 1 bifurcating branch attached). Vertex analysis compares dendritic structures combing topological and metrical properties to describe the overall structure of a dendritic arbor. A Va/Vb ratio greater than 1 suggests that the tree is nonrandom and symmetrical; values around 1 suggest that the terminal nodes grow in a random process; values <0.5 suggest that the tree is nonrandom and asymmetrical.
Finally, the following variables were measured using the R software environment (R Core Team 2014), in order to further analyze dendritic structure:
Mean angle between the center of mass of first order dendrite initial points and the terminal points. We determined a center of mass using the initial coordinates of each first order dendrite initial point in order to fix a reference for each angular calculation. This variable measures the angle at each terminal point of each terminal segment. This angle ranges from 0 to radians.
Mean angle between first order adjacent dendrites. This is a measurement of the 3D angle between each first order dendrite initial point and the next one.
Mean angle between planes formed by 3 first order consecutive dendrites. This is a measurement of the angle between the planes formed by each vector that connects the center of mass to each first order dendrite initial point and its adjacent vectors. This angle ranges from 0 to π radians.
Additionally, a shrinkage correction factor of 0.83 (n = 20) was calculated in the x, y, and z dimension, by measuring sections before and after injection of neurons and tissue processing to make it possible to match up the present data with other anatomical, molecular and physiological data.
Univariate statistical analyses were performed using the R software environment (R Core Team 2014). We first compared morphological variables between layers. If the statistical test revealed statistically significant differences, we performed pairwise comparisons in order to find the layers responsible for these differences.
Depending on the type of the variable, we applied different tests. Discrete measures (e.g., number of nodes or endings expressed as total numbers) were tested using the χ2 test (Agresti 2007) for comparisons between layers, and the Fisher exact test (Fisher 1935) was used for pairwise layer comparison. If the features were continuous (e.g., cell body area or VA/VB ratio), the comparisons between layers were performed using the Kruskal–Wallis test (Hollander and Wolfe 1973), while for pairwise layer comparisons we used the Mann–Whitney test (Bauer 1972; Hollander and Wolfe 1973). In the case of repeated measures (those that change with the branch order, such as the length per branch order, or the distance from soma, such as the Sholl analysis), we used the Friedman test (Hollander and Wolfe 1973) for both comparison between layers and pairwise comparisons. Finally, when the variables were angular (e.g., mean angle between first order adjacent dendrites), the Rao test (Rao 1967; Jammalamadaka and SenGupta 2001) was used for comparisons between layers and the Watson–Wheeler test (Wheeler and Watson 1964; Jammalamadaka and SenGupta 2001) for the pairwise comparisons. All the tests were performed at a significance level α = 0.05.
Results
The structure of complete basal arbors of 288 pyramidal neurons was analyzed across cortical layers II, III, IV, Va, Vb, and VI of the somatosensory neocortex of the P14 rats (48 cells per layer; 8 animals), using a number of morphological variables of the dendritic tree and the soma.
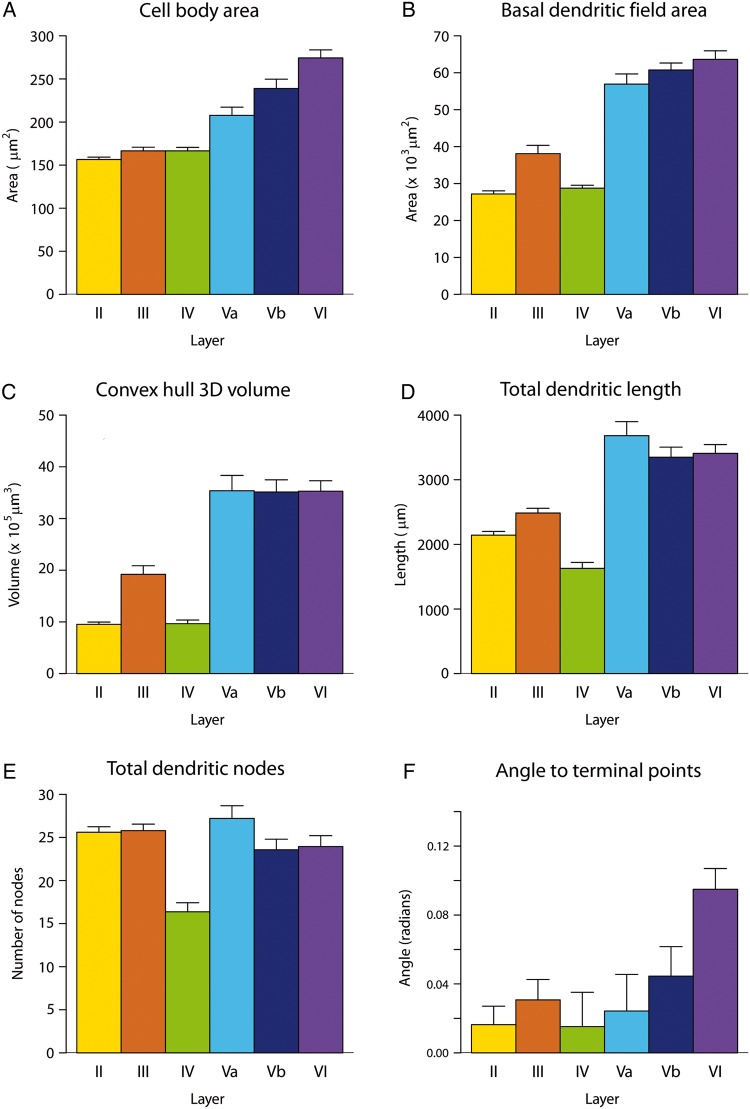
This analysis showed that cells in supragranular layers presented a significantly smaller cell body area and significantly smaller dendritic size (in 2D and 3D) compared with infragranular layers (Fig. 4A−C and Table 1 for statistical comparisons), with layer IV presenting the smallest values (followed by layer II). Similarly, the total dendritic length was smaller in supragranular layers compared with infragranular layers (Fig. 4D), with layer IV presenting the smallest values, followed by layer II. The total number of nodes (Fig. 4E) and endings (Supplementary Fig. 7A) showed also statistically significant differences between supragranular and infragranular layers. As an additional measure of the general arborization, the extent to which arbors occupied the z dimension was determined. In general, cells had basal dendritic arbors which tend to occupy a greater extent of the z dimension across layers, as shown by the increasing angle between the center of mass of first order dendrite initial points and the terminal points (Fig. 4F). See Table 1 for statistically significant differences found between layers.
Figure 4.
Graphs showing the variables analyzed, as total values, in each cortical layer sampled from the S1HL region of P14 rats. Measurements are reported as mean ± SEM. Statistical significance of the differences is shown in Table 1. Mean values of each of the variables analyzed are shown in Supplementary Table 1.
Table 1.
Statistical comparisons of several representative variables from basal arbors of pyramidal neurons in layers II, III, IV, Va, Vb and VI of the S1HL region of P14 rats. The “groups” column on the right indicates all of the layers which show no statistically significant difference
| II-III | II-IV | II-Va | II-Vb | II-VI | III-IV | III-Va | III-Vb | III-VI | IV-Va | IV-Vb | IV-VI | Va-Vb | Va-VI | Vb-VI | Groups | |
|---|---|---|---|---|---|---|---|---|---|---|---|---|---|---|---|---|
| Cell body area (A) | ** | ** | ** | ** | ** | ** | ** | ** | ** | ** | * | II-III-IV Va-Vb |
||||
| Basal dendritic field area (A) | * | ** | ** | ** | ** | ** | ** | ** | ** | ** | ** | ** | Va-Vb-VI | |||
| Convex Hull 3D volume (A) | ** | ** | ** | ** | ** | ** | ** | ** | ** | ** | ** | II-IV Va-Vb-VI |
||||
| Total dendritic length (A) | * | ** | ** | ** | ** | ** | * | * | ** | ** | ** | ** | Va-Vb-VI | |||
| Total dendritic nodes (B) | ** | * | ** | * | ** | * | ** | * | ** | ** | ** | II-III Va-Vb-VI |
||||
| Angle to terminal points (C) | ** | * | ** | * | * | * | ** | * | ** | II-III-Va IV-Va IV-Vb Vb-VI |
||||||
| Sholl analysis (D) | * | ** | ** | ** | * | ** | ** | II-III-Va II-III-Vb II-IV-Vb II-VI |
||||||||
| Length per distance from soma (D) | ** | ** | ** | ** | ** | ** | ** | II-III-IV II-III-Vb II-III-Va II-VI |
||||||||
| Nodes per distance from soma (D) | * | * | * | * | * | * | * | II-III-Va II-Va-Vb II-VI IV-Va-Vb |
||||||||
| Number of branches per order (B) | * | * | * | * | * | * | * | II- III-Va-Vb IV-Va-Vb |
||||||||
| Length per branch order (D) | * | * | * | * | * | * | * | * | * | II-VI III- Vb III-VI IV-Va-Vb |
||||||
| Mean length per order (D) | * | * | * | * | * | * | * | * | II-VI III- Vb III-VI IV-VI IV-Va-Vb |
|||||||
| Nodes per branch order (D) | * | * | * | * | * | * | * | * | * | * | II-Vb-VI III-Vb-VI |
|||||
| Total dendritic endings (B) | ** | * | ** | * | ** | * | * | ** | ** | ** | II- III III-Va Va-Vb-VI |
|||||
| Endings per distance from soma (D) | * | ** | * | * | II-III-Va-Vb II-III-IV IV-VI Va-Vb-VI |
|||||||||||
| Endings per branch order (D) | * | * | * | * | * | ALL [-(IV)] | ||||||||||
| Fractal analysis (A) | ** | ** | ** | ** | ** | ALL [-(IV)] | ||||||||||
| Angle between two 1st order dendrites (C) | * | ** | ** | * | ** | ** | * | ** | ** | * | II-III-Va Va-Vb Vb-VI |
|||||
| Angle between three 1st order dendrites (C) | ** | * | ** | * | * | * | ** | ** | II-Va-Vb II-III-Va Va-Vb-VI |
|||||||
| Ratio Va/Vb (A) | * | ALL [-(II-IV)] |
**P < 0.001.
*P < 0.05.
(A): For continuous measures, we used Mann -Whitney test.
(B): For discrete measures, we used Fisher Exact test.
(C): For angular measures, we used Watson -Wheeler test.
(D): For repeated measures, have used Friedman test.
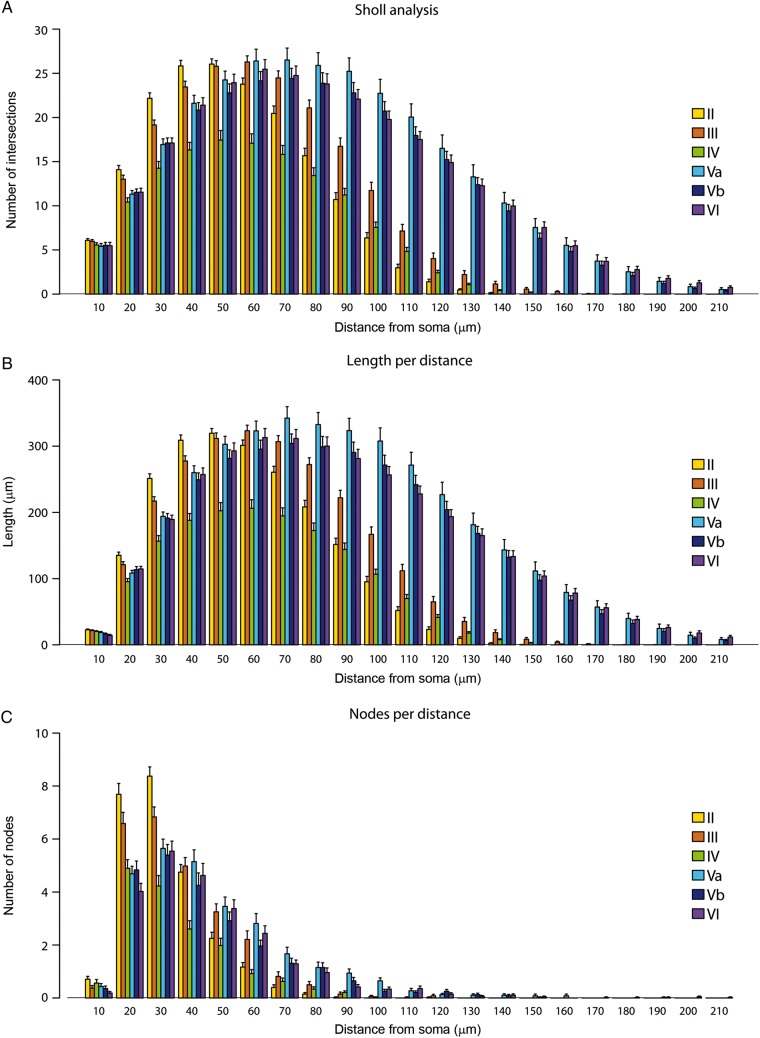
At increasing distances from the soma, the detailed distribution of variables showed distinct pattern of intersections and length in supragranular and infragranular layers, with the curves of the supragranular layers shifted to the left (Fig. 5A,B). In particular, layer II showed the leftmost values. Layer IV presented a pattern of intersections and length with a lower peak than the supragranular and infragranular layers. Statistical tests revealed that only in the case of the supragranular layers was there no significant difference between one layer and another (Table 1). Regarding nodes (Fig. 5C) and endings (Supplementary Fig. 7B), peak numbers were higher in supragranular layers and the curves were also shifted to the left. Layer IV again had the lowest numbers of nodes and endings overall. Interestingly, peak node values were located at 30 microns for all cortical layers (except layer IV). See Table 1 for statistical tests.
Figure 5.
Graphs showing the variables analyzed, per distance from soma, in each cortical layer sampled from the S1HL region of P14 rats. Measurements are reported as mean ± SEM. Statistical significance of the differences is shown in Table 1. Mean values of each of the variables analyzed are shown in Supplementary Tables 2 and 3.
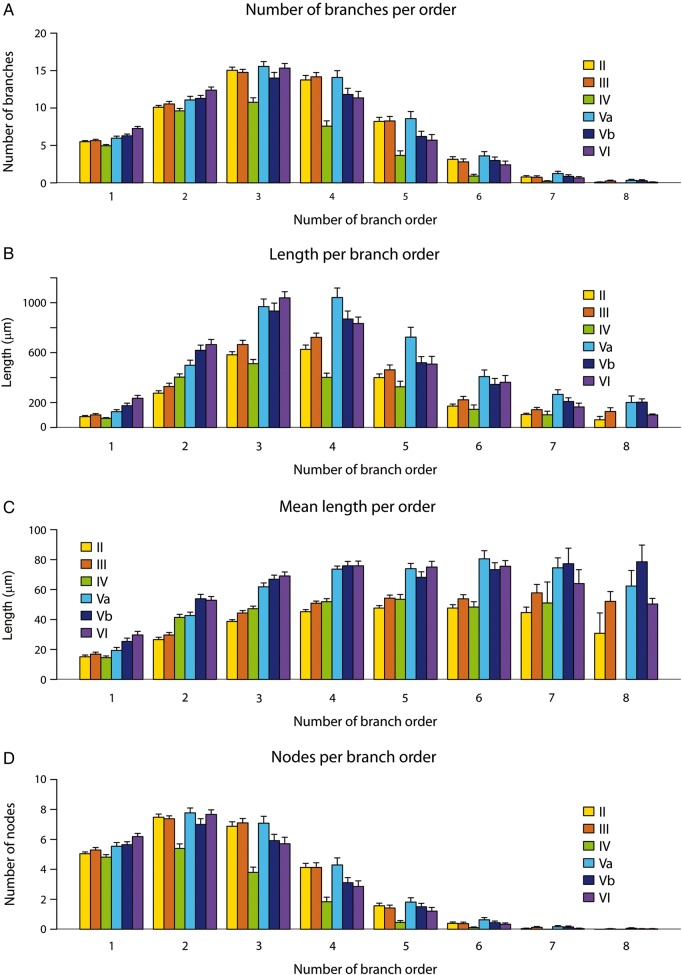
The study of the number of branches per dendritic order (Fig. 6A) showed increasing values across layers (II−VI; excluding layer IV) for the first and second dendritic branch order. Values reached a peak for the third order, and numbers decreased across layers (II−VI, excluding layer IV) for the remaining orders. Regarding the length per branch order (Fig. 6B), the numbers increased across layers (II−VI, excluding layer IV) for the first, second and third dendritic branch order. Values reached a peak at the 3rd order for layers IV, Vb, and VI and at the 4th order for layers II, III, and Va, and gradually decreased for the remaining orders. The mean length of dendritic segments per branch order (Fig. 6C) showed segments to be greater across increasing orders, and the highest values were those of layers Vb and VI. The distribution of nodes showed increasing values across layers (II−VI, excluding layer IV) for the first branch order (Fig. 6D). Values were highest at the second branch order for all cortical layers, and numbers decreased across layers for the remaining orders. Similar results were found for endings, although the highest values were found at the 4th branch order (Supplementary Fig. 7C). Statistical tests between layers are shown in Table 1.
Figure 6.
Graphs showing representative variables analyzed, per branch order, in each cortical layer sampled from the S1HL region of P14 rats. Measurements are reported as mean ± SEM. Statistical significance of the differences is shown in Table 1. Mean values of each of the variables analyzed are shown in Supplementary Table 4.
Finally, some other parameters regarding the way in which neurons fill space (Kdim; fractal analysis) and those that describe the bifurcation structure of the dendritic arbor were measured (see Supplementary Fig. 7D−G). These variables revealed that, except for layer IV, cells seem to occupy space in a similar way (Supplementary Fig. 7D); as shown in the statistical test, where there were no differences between layers with the exception of layer IV (Table 1). Also, there was a tendency of decreasing angles between first order dendrites across layers (except layer IV; Supplementary Fig. 7E,F). There were statistically significant differences between supragranular and infragranular layers for the angles generated between consecutive first order dendrites, and layer IV was statistically different in this regard. In fact, this layer was shown to be significantly different from the rest of the layers as measured by Va/Vb ratio from vertex analysis (Table 1), indicating a relatively simpler dendritic structure than any other layer (Supplementary Fig. 7G; see Materials and Methods for details). Mean values of each of the variables analyzed are shown in Supplementary Tables 1–4.
Discussion
The main finding in the present study is that there is a systematic variation of the basal dendritic pattern in the pyramidal cells of juvenile rat somatosensory neocortex which is layer specific. In particular, cells became larger and progressively more complex in their branching structure from superficial to deeper layers, except for those in layer IV, which were the simplest cells. These results are in line with previous studies that reported differences between cortical layers using the Golgi method or intracellular labeling (e.g., Hendry and Jones 1983; Conel 1959; Larkman 1991; Elston 2001; Oberlaender et al. 2012). However, to our knowledge, this is the first time that complete basal arbors of pyramidal cells have been systematically analyzed across each cortical layer at a particular cortical region and age.
Twenty morphological characteristics were used to analyze the size and branching complexity of 288 3D-reconstructed complete basal arbors of pyramidal cells in the S1HL of P14 rats across each cortical layer. The majority of variables, expressed as mean total values per cell, as well as measured per distance from soma and branch order, showed statistically significant differences between the different cortical regions analyzed, suggesting that columnar circuitry may be specialized for the functional requirements of a particular cortical layer. Additionally, some variables were measured (Fig. 4F and Supplementary Fig. 7E,F) in order to further analyze the dendritic structure of first order dendrites. These results further showed that cells became progressively more complex in their branching structure across cortical layers, in a symmetrical way. Only K-dim from fractal analysis and VA/VB ratio from vertex analysis showed few differences between cortical layers suggesting that, although the degree of cell complexity differs, cells from different layers (except those in layer IV) have a similar symmetric and nonrandom overall structure of dendritic arbors (see Material and Methods for details).
Functionally, the size and extent of dendritic arbors relate to the sampling strategies of cells and mixing of inputs from multiple sources: cortical and subcortical afferents and local cortical excitatory and inhibitory inputs (e.g., Lund et al. 1993; Malach 1994; Elston et al. 1999; Elston 2003). In this regard, here we demonstrate that dendritic arbors of infragranular cells, whose dendritic arbors extend over a wider region of cortex than cells from other layers, have a greater capacity to sample cortical extents than supragranular pyramidal cells, both in xy and z dimensions. Similarly, layer IV and layer II cells would possibly sample lesser cortical ranges compared with the cells of other layers.
The dendritic branching pattern influences their potential to compartmentalize processing within their arbors and, consequently, their functional capacity (Koch et al. 1982; Poirazi and Mel 2001; London and Haüsser 2005; Spruston 2008; van Elburg and van Ooyen 2010). Thus, there is a greater potential for compartmentalization in the dendritic arbors of infragranular pyramidal cells than in supragranular pyramidal cells, resulting in greater functional capacity. Accordingly, layer IV (which includes cells with the least complexity in dendritic structure) would display biophysical properties that would result in a limited functional capacity. The simpler geometrical arrangement of layer IV dendritic arbors possibly reflects the lesser functional requirements of these cells.
Previous studies regarding dendritic arborization during development of the somatosensory cortex of rats have shown that, from P14 to P60, the number of basal dendritic segments is significantly increased at specified branch orders, and some basal and oblique dendritic segments are lengthened or thickened (Romand et al. 2011). Thus, the present results reveal the geometrical arrangement of basal arbors of each layer at a particular stage of development (P14). This geometrical arrangement is likely to further change at the subsequent stages. Therefore, further experiments are required to establish to what extent morphological differences reported here change during the life span of the rat.
Furthermore, there are many factors that have been implicated in neurite growth during development in the cerebral cortex (e. g. Elston and Fujita 2014). It is likely that neuronal dendritic arbor structure in adulthood is influenced by competitive interactions between cells during development. According to this idea, dendrites of neurons located in cell-dense tissue would experience a higher degree of competitive exclusion during development than those located in tissue where cells are sparse, thereby resulting in less space filling (reviewed in Perry and Linden 1982; Rakic 1972). This is the case for cells in layer IV and layer II; these layers have a greater cell density and smaller dendritic arbors than the other cortical layers. However, pyramidal cell morphology could be determined genetically. Further analysis of the relationship between neuronal density and pyramidal cell structure during development will help shed light on this issue.
Finally, this new set of 3D reconstructed and quantified pyramidal cell morphologies across P14 S1HL cortical layers clearly provides new insights into interlaminar information processing in the cerebral cortex. Furthermore, since it has been shown that morphological diversity of pyramidal neurons renders the average physiological properties robust to perturbations and invariant across local layer microcircuits (Ramaswamy et al 2012), this specific 3D-reconstructed pyramidal cell population across layers will help to create more realistic and accurate in silico cortical microcircuits.
Supplementary Material
Supplementary material can be found at: http://www.cercor.oxfordjournals.org/.
Funding
This work has been partially supported by the Spanish Ministry of Economy and Competitiveness through the Cajal Blue Brain (C080020-09; the Spanish partner of the Blue Brain initiative from EPFL) and TIN2013-41592-P projects, by the S2013/ICE- 2845-CASI-CAM-CM project, and the European Union Seventh Framework Programme (FP7/2007-2013) under grant agreement no. 604102 (Human Brain Project). R.B.-P. was supported by the Ministerio de Economia y Competitividad (CSIC). Funding to pay the Open Access publication charges for this article was provided by the Spanish partner of the Blue Brain initiative from EPFL (C080020-09) and the European Union Seventh Framework Programme (FP7/2007-2013) under grant agreement no. 604102 (Human Brain Project).
Notes
Conflict of Interest: None declared.
Supplementary Material
References
- Agresti A. 2007. An introduction to Categorical Data Analysis. 2nd ed Hoboken: John Wiley. [Google Scholar]
- Ballesteros-Yáñez I, Benavides-Piccione R, Bourgeois JP, Changeux JP, DeFelipe J. 2010. Alterations of cortical pyramidal neurons in mice lacking high-affinity nicotinic receptors. Proc Natl Acad Sci USA. 107:11567–11572. [DOI] [PMC free article] [PubMed] [Google Scholar]
- Bauer D. 1972. Constructing confidence sets using rank statistics. J Am Stat Assoc. 67:687–690. [Google Scholar]
- Benavides-Piccione R, Hamzei-Sichani F, Ballesteros-Yáñez I, DeFelipe J, Yuste R. 2006. Dendritic size of pyramidal neurons differs among mouse cortical regions. Cereb Cortex. 16:990–1001. [DOI] [PubMed] [Google Scholar]
- Bianchi S, Stimpson CD, Duka T, Larsen MD, Janssen WG, Collins Z, Bauernfeind AL, Schapiro SJ, Baze WB, McArthur MJ et al. 2013. Synaptogenesis and development of pyramidal neuron dendritic morphology in the chimpanzee neocortex resembles humans. Proc Natl Acad Sci USA. 110(Suppl 2):10395–10401. [DOI] [PMC free article] [PubMed] [Google Scholar]
- Conel JL. 1959. The cortex of a twenty-four month old infant. In: The post natal development of the human cerebral cortex. Cambridge: Harvard University Press. [Google Scholar]
- DeFelipe J, Fariñas I. 1992. The pyramidal neuron of the cerebral cortex: morphological and chemical characteristics of the synaptic inputs. Prog Neurobiol. 39:563–607. [DOI] [PubMed] [Google Scholar]
- Elston GN. 2003. Cortex, Cognition and the Cell: New Insights into the Pyramidal Neuron and Prefrontal Function. Cereb Cortex. 13:1124–1138. [DOI] [PubMed] [Google Scholar]
- Elston GN. 2001. Interlaminar differences in the pyramidal cell phenotype in cortical areas 7 m and STP (the superior temporal polysensory area) of the macaque monkey. Exp Brain Res. 138:141–152. [DOI] [PubMed] [Google Scholar]
- Elston GN, Arellano J, González-Albo MC, DeFelipe J, Rosa MG. 1999. Variation in the spatial relationship of parvalbumin immuno-reactive interneurones and pyramidal neurones in the somatosensory cortex of the rat. NeuroReport. 10:2975–2979. [DOI] [PubMed] [Google Scholar]
- Elston GN, Benavides-Piccione R, DeFelipe J. 2001. The pyramidal cell in cognition: A comparative study in human and monkey. J Neurosci. 21:RC163. [DOI] [PMC free article] [PubMed] [Google Scholar]
- Elston GN, Benavides-Piccione R, Elston A, Manger P, DeFelipe J. 2011. Pyramidal cells in prefrontal cortex: comparative observations reveal unparalleled specializations in neuronal structure among primate species. Front Neuroanat. 5:2 10.3389/fnana.2011.00002. [DOI] [PMC free article] [PubMed] [Google Scholar]
- Elston GN, Fujita I. 2014. Pyramidal cell development: postnatal spinogenesis, dendritic growth, axon growth, and electrophysiology. Front Neuroanat. 8:78 10.3389/fnana.2014.00078. [DOI] [PMC free article] [PubMed] [Google Scholar]
- Elston GN, Rockland K. 2002. The pyramidal cell of the sensorimotor cortex of the macaque monkey: phenotypic variation. Cereb Cortex. 12:1071–1078. 10.1093/cercor/12.10.1071. [DOI] [PubMed] [Google Scholar]
- Elston GN, Rosa MG. 1997. The occipitoparietal pathway of the macaque monkey: Comparison of pyramidal cell morphology in layer III of functionally related cortical visual areas. Cereb Cortex. 7:432–452. [DOI] [PubMed] [Google Scholar]
- Fisher R. 1935. The logic of inductive inference. J R Stat Soc. 98:39–54. [Google Scholar]
- Franklin KBJ, Paxinos G. 1997. The mouse brain in stereotaxic coordinates. San Diego: Academic Press. [Google Scholar]
- Hendry SH, Jones EG. 1983. The organization of pyramidal and non-pyramidal cell dendrites in relation to thalamic afferent terminations in the monkey somatic sensory cortex. J Neurocytol. 12(2):277–298. [DOI] [PubMed] [Google Scholar]
- Hollander M, Wolfe DA. 1973. Nonparametric Statistical Methods. Hoboken: John Wiley; p. 115–120. [Google Scholar]
- Jacobs B, Schall M, Prather M, Kapler E, Driscoll L, Baca S, Jacobs J, Ford K, Wainwright M, Treml M. 2001. Regional dendritic and spine variation in human cerebral cortex: a quantitative study. Cereb Cortex. 11:558–571. [DOI] [PubMed] [Google Scholar]
- Jain N, Diener PS, Coq JO, Kaas JH. 2003. Patterned activity via spinal dorsal quadrant inputs is necessary for the formation of organized somatosensory maps. J Neurosci. 23:10321–10330. [DOI] [PMC free article] [PubMed] [Google Scholar]
- Jammalamadaka S, SenGupta A. 2001. Topics in circular statistics. River Edge: World Scientific Publishing Co. [Google Scholar]
- Jones EG. 1984. Laminar distribution of cortical efferent cells. In: Peters A, Jones EG, editors. Cerebral Cortex. Vol. 1 Cellular Components of the Cerebral Cortex. New York: Plenum Press; p. 521–553. [Google Scholar]
- Jones EG. 1975. Varieties and distribution of non-pyramidal cells in the somatic sensory cortex of the squirrel monkey. J Comp Neurol. 160:205–267. [DOI] [PubMed] [Google Scholar]
- Koch C, Poggio T, Torre V. 1982. Retinal ganglion cells: a functional interpretation of dendritic morphology. Phil Trans R Soc Lond Ser B. 298:227–264. [DOI] [PubMed] [Google Scholar]
- Larkman AU. 1991. Dendritic morphology of pyramidal neurones in the visual cortex of the rat: I. Branching patterns. J Comp Neurol. 306:307–319. [DOI] [PubMed] [Google Scholar]
- London M, Häusser M. 2005. Dendritic computation. Annu Rev Neurosci. 28:503–532. [DOI] [PubMed] [Google Scholar]
- Lund JS, Yoshioka T, Levitt JB. 1993. Comparison of intrinsic connectivity in different areas of macaque monkey cerebral cortex. Cereb Cortex. 3:148–162. [DOI] [PubMed] [Google Scholar]
- Malach R. 1994. Cortical columns as devices for maximizing neuronal diversity. Trends Neurosci. 17:101–104. [DOI] [PubMed] [Google Scholar]
- Oberlaender M, de Kock CP, Bruno RM, Ramirez A, Meyer HS, Dercksen VJ, Helmstaedter M, Sakmann B. 2012. Cell type-specific three-dimensional structure of thalamocortical circuits in a column of rat vibrissal cortex. Cereb Cortex. 22:2375–2391. [DOI] [PMC free article] [PubMed] [Google Scholar]
- Oga T, Aoi H, Sasaki T, Fujita I, Ichinohe N. 2013. Postnatal development of layer III pyramidal cells in the primary visual, inferior temporal, and prefrontal cortices of the marmoset. Front Neural Circuits. 7:31 10.3389/fncir.2013.00031. [DOI] [PMC free article] [PubMed] [Google Scholar]
- Perry VH, Linden R. 1982. Evidence for dendritic competition in the developing retina. Nature. 297:683–685. [DOI] [PubMed] [Google Scholar]
- Poirazi P, Mel BW. 2001. Impact of active dendrites and structural plasticity on the memory capacity of neural tissue. Neuron. 29:779–796. [DOI] [PubMed] [Google Scholar]
- R Core Team. 2014. R: A Language and Environment for Statistical Computing. Vienna: (Austria: ): R Foundation for Statistical Computing. [Google Scholar]
- Rakic P. 1972. Extrinsic cytological determinants of basket and stellate cell dendritic pattern in the cerebellar molecular layer. J Comp Neurol. 146:335–354. [DOI] [PubMed] [Google Scholar]
- Ramaswamy S, Hill SL, King JG, Schürmann F, Wang Y, Markram H. 2012. Intrinsic morphological diversity of thick-tufted layer 5 pyramidal neurons ensures robust and invariant properties of in silico synaptic connections. J Physiol. 590:737–752. [DOI] [PMC free article] [PubMed] [Google Scholar]
- Rao JS. 1967. Large sample tests for homogeneity of angular data. Sankhya Ser B. 28:172–174. [Google Scholar]
- Romand S, Wang Y, Toledo-Rodriguez M, Markram H. 2011. Morphological development of thick-tufted layer v pyramidal cells in the rat somatosensory cortex. Front Neuroanat. 5:5. [DOI] [PMC free article] [PubMed] [Google Scholar]
- Spruston N. 2008. Pyramidal neurons: Dendritic structure and synaptic integration. Nat Rev Neurosci. 9:206–221. [DOI] [PubMed] [Google Scholar]
- Staiger JF, Flagmeyer I, Schubert D, Zilles K, Kotter R, Luhmann HJ. 2004. Functional diversity of layer IV spiny neurons in rat somatosensory cortex: quantitative morphology of electrophysiologically characterized and biocytin labeled cells. Cereb Cortex. 14:690–701. [DOI] [PubMed] [Google Scholar]
- Van Aerde, Feldmeyer D. 2015. Morphological and physiological characterization of pyramidal neuron subtypes in rat medial prefrontal cortex. Cereb Cortex. 25(3):788–805. [DOI] [PubMed] [Google Scholar]
- van Elburg RA, van Ooyen A. 2010. Impact of dendritic size and dendritic topology on burst firing in pyramidal cells. PLoS Comput Biol. 6(5):e1000781 10.1371/journal.pcbi.1000781. [DOI] [PMC free article] [PubMed] [Google Scholar]
- Welker C, Woolsey TA. 1974. Structure of layer IV in the somatosensory neocortex of the rat: description and comparison with the mouse. J Comp Neurol. 158:437–453. [DOI] [PubMed] [Google Scholar]
- Wheeler S, Watson G. 1964. A distribution-free-two-sample test on the circle. Biometrika. 51:256–257. [Google Scholar]
- White EL. 1989. Cortical Circuits: Synaptic Organization of the Cerebral Cortex. Structure, Function and Theory. Boston: Birkhäuser. [Google Scholar]
- Wong-Riley MTT, Welt C. 1980. Histochemical changes in cytochrome oxidase of cortical barrels after vibrissal removal in neonatal and adult mice. Proc Natl Acad Sci USA. 77:2333–2337. [DOI] [PMC free article] [PubMed] [Google Scholar]
Associated Data
This section collects any data citations, data availability statements, or supplementary materials included in this article.


