Abstract
This paper reports a method for generating an intact and perfusable microvascular network that connects to microfluidic channels without appreciable leakage. This platform incorporates different stages of vascular development including vasculogenesis, endothelial cell (EC) lining, sprouting angiogenesis, and anastomosis in sequential order. After formation of a capillary network inside the tissue chamber via vasculogenesis, the adjacent microfluidic channels are lined with a monolayer of ECs, which then serve as the high-pressure input (“artery”) and low pressure output (“vein”) conduits. To promote a tight interconnection between the artery/vein and the capillary network, sprouting angiogenesis is induced, which promotes anastomosis of the vasculature inside the tissue chamber with the EC lining along the microfluidic channels. Flow of fluorescent microparticles confirms the perfusability of the lumenized microvascular network, and minimal leakage of 70 kDa FITC-dextran confirms physiologic tightness of the EC junctions and completeness of the interconnections between artery/vein and the capillary network. This versatile device design and its robust construction methodology establish a physiological transport model of interconnected perfused vessels from artery to vascularized tissue to vein. The system has utility in a wide range of organ-on-a-chip applications as it enables the physiological vascular interconnection of multiple on-chip tissue constructs that can serve as disease models for drug screening.
Graphical abstract
An advanced 3D microvascular network model enabled by engineering physiological anastomosis between tissue chamber-embedded capillary network and endothelial cell-lined microfluidic channels.
Introduction
The cardiovascular-based circulation system plays a vital role in maintaining homeostasis of the human body. The blood vessel system comprises a closed network of arteries, veins and capillaries that allow blood to circulate throughout the body for gas exchange and mass transportation, which is essential to maintaining organ viability. Therefore, in order to mimic the characteristics and functions of organs in vitro, it is necessary to integrate a functional 3D microvasculature system for a more physiological organ-on-a-chip [1,2].
Towards this goal several research groups have developed different 3D in vitro microvascular models using microfluidic technology to better study vascular biology [3]. Microfluidic structure design allows for the confinement of cells to restricted regions with controlled cellular interactions based on patterned tissue chamber designs. Furthermore, microfluidic flow control can establish complex microenvironment concentrations at physiological levels by regulating chemical factors (e.g. molecular gradients) or mechanical factors (e.g. shear force from interstitial flow). One strategy for developing a 3D microvascular model is to create microfabricated vessel scaffolds by lining microfluidic channels with ECs. Since the geometries of these scaffolds are pre-determined by the microfabricated patterns, the imposed shear stress on the lined ECs can be precisely controlled based on the microchannel dimension and applied flow rate [4,5,6]. An alternative strategy is to seed cells in 3D extracellular matrix (ECM), which allows spontaneous formation and remodeling of vascular networks through vasculogenesis and angiogenesis [7–12]. Compared to the EC lining strategy, this strategy closely mimics vascular development in vivo. However, the disadvantage is that although the microvascular morphology (e.g. number of branches, average branch length, average vessel diameter, etc.) can be regulated by different control factors (e.g. paracrine signaling, cell-seeding density and hydrogel mechanical properties, etc.), the microvascular network pattern cannot be well controlled and easily perfused [13].
Recognizing the need to better replicate the in vivo vasculature, we have developed a novel microfluidic device with robust methodology that combines the above-mentioned two strategies into an advanced 3D microvascular network model. This model would need to closely emulate the intact physiological blood vessel network with tight interconnections between artery/vein and capillary vessel network. Further, it is essential that these interconnections be without non-physiological leakage. Therefore, in order to mimic the complete and contiguous microvascular network with intact and perfusable lumen, the engineering artery/vein and capillary network must fuse with each other tightly in a process known as anastomosis [14]. In our design, the capillary network is induced via vasculogenesis in a middle tissue chamber and EC linings along the microfluidic channel on either side serve as the artery and vein. Anastomosis is induced bi-directionally with our methodology, guaranteeing a good connection between EC lining along microfluidic channel and capillaries inside the tissue chamber. First, some ECs will migrate out from tissue chamber and proliferate along microfluidic channel during vasculogenesis process, facilitating the connection with subsequent EC lining. Second, sprouting of lined EC monolayer on the matrix interface is induced to invade into ECM and form connection with the capillary network inside tissue chamber. Thus, this microfluidic platform enables multiple stages of microvascular network development such as vasculogenesis, EC lining, angiogenesis, and anastomosis to take place on a single platform. Furthermore, perfusion of 70 kDa FITC-dextran validates tight connection between the lined ECs inside microfluidic channels and the capillary network inside the tissue chamber without non-physiological leakage. The significance of this work is in the prevention of non-physiologic leakage from vasculature into ECM, which is critically important for drug screening applications [15]. In addition, the platform can provide a promising avenue for the integration of multiple organ-on-chips towards the vision of body-on-chip by establishing the vascular interfaces from artery to vein [16,17].
Materials and methods
Microfluidic device design
Fig. 1A illustrated the concept of decoupling device design by using four medium reservoirs with different hydrostatic pressures that could separately control flow to the tissue chamber and along the microfluidic channel. The former resulted in interstitial flow across the tissue chamber that induced vasculogenesis, and the latter induced shear stress on the lined EC within the microfluidic channels. The decoupling of these two microfluidic flows also allowed for precise control of the transendothelial flow conditions that promoted sprouting angiogenesis as well as formation and maintenance of anastomosis.
Fig. 1.
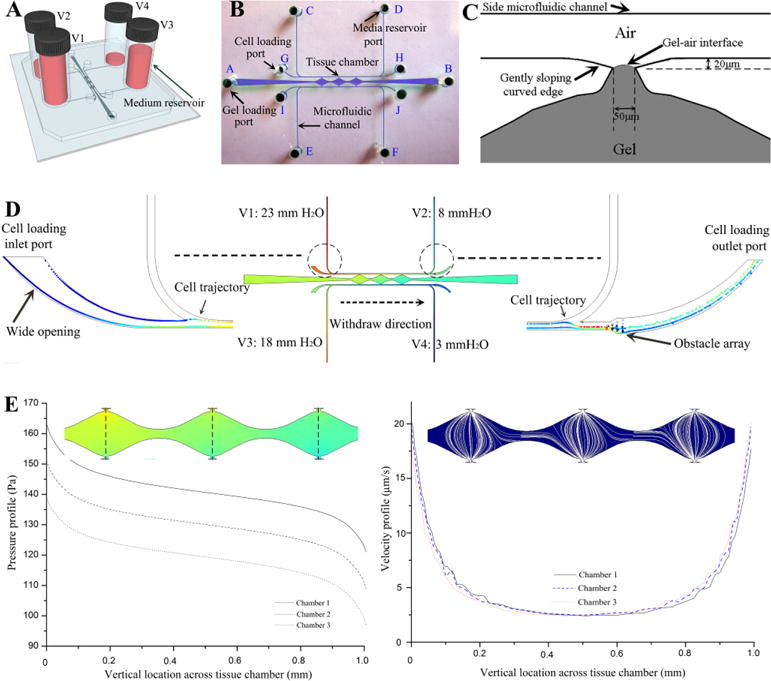
Microfluidic device design. (A) Schematic of decoupling design with four media reservoirs containing different medium volume. (B) Top-view of channel structure and ports for gel loading, cell loading and media reservoir. (C) Schematic of the optimized hourglass shaped communication pore design that can precisely stop advancing gel at its vertexes with relatively flat gel-air interface, and enable the formation of a smooth EC monolayer on the gel interface. (D) Simulation result on pressure distribution inside the entire device, and the particle tracing from cell loading inlet port with wide opening to cell loading outlet port with obstacle array through withdrawal mode. (E) Simulation results on pressure drop and velocity profile of interstitial flow across three tissue chambers.
The entire device structure consisted of three central millimeter-sized diamond tissue chambers (1×2 mm) and two side square cross-sectional microfluidic channels (100×100 μm) (Fig. 1B) that connected to the tissue chambers through a series of communication pores (Fig. 1C). Based on the quantitative analysis of Laplace pressure at the gel-air interface, the widths of both communication pores and chamber-connecting channels were optimized to prevent gel bursting (or leaking) into side microfluidic channels from pressure built-up during the gel loading process (ESI† Fig. S1). In our design, the burst pressure (Pburst-max=3983 Pa) of communication pores with a width of 50μm was much higher than the advancing pressure (Padvancing-min=1655 Pa) of the chamber-connecting channels with a width of 200μm, calculated based on the Young-Laplace equation [18]. Since there was a large pressure range (ΔP=2328 Pa) between the burst pressure and advancing pressure, there was a low probability of gel bursting into the side microfluidic channels during loading, as long as the applied gel loading pressure was within the pressure boundary (Padvancing-min<Ploading<Pburst-max). Therefore, the communication pores functioned as capillary burst valves to prevent gel from flowing out of the tissue chambers and into the outer channels [19]. In addition, the hourglass shaped communication pores, with gently sloping curved edges, were designed to precisely stop advancing gel at a specific position closest to the microfluidic channel (Dgel-max=20 μm) with relatively flat gel-air interface (Fig. 1C). This enabled the formation of a smooth EC monolayer on the gel interface at the communication pore, a critical condition for EC lining and sprouting angiogenesis. Furthermore, since the time needed for vasculogenesis was longer than that for EC lining, the cell loading port configuration allowed EC lining at later days after embedding cells inside the tissue chambers for capillaries formation. Both cell loading inlet ports for the EC lining were designed with a wider opening than the media inlet ports in order to prevent cell blocking when introducing cells for EC lining (Fig. 1D). In both cell loading outlet channels, an obstacle array was integrated as a sieve to concentrate cells inside the microfluidic channels during the EC lining process (Fig. 1D). This procedure facilitated sufficient contact of ECs with the laminin-coated microfluidic channel, which was essential for EC lining.
Finite-element simulations on the pressure distribution and velocity profiles for the device were performed using COMSOL Multiphysics 4.3 (Comsol Inc., Burlington, MA, USA). In the 3D microfluidic model, the Brinkman equation was employed for momentum transportation through a porous fibrin gel confined in the tissue chamber and driven by the hydrostatic pressure drop. Due to the low permeability (1.5×10⁻¹³ m2) of fibrin gels, which created high hydraulic resistance, only small volumes of media flowed into the tissue chamber. Furthermore, due to the fully symmetrical configuration of communication pores along both side microfluidic channels, the pressure drop across each tissue chamber from the top communication pore to the bottom one was almost the same (ΔPchamber~5 mm H2O), which induced a uniform interstitial flow profile inside each tissue chamber to stimulate vasculogenesis (Fig. 1E). When loading cells for EC lining, the particle tracing module was coupled with the fluidic flow module to track trajectories of cells inside the microfluidic channel. The simulation result demonstrated that the loaded cells only travelled from cell loading inlet port to cell loading outlet port and did not enter the vertical section of side microfluidic channels by using withdrawal mode (Fig. 1D).
The microfluidic device was made of polydimethylsiloxane (PDMS) (Sylgard-184, Dow Corning) by micro-molding from SU-8 patterned silicon wafers using standard soft lithography techniques. The height of the microfluidic channels and the tissue chambers were all 100μm. After plasma bonding the microfluidic chip with the PDMS coated glass slide, four bottomless plastic vials were glued at four media reservoir ports using the PDMS mixed with curing agent. Fabricated devices were autoclaved at 121°C for 30 minutes before being used for experiments.
Cell culture
Human endothelial colony forming cell-derived ECs (ECFC-ECs) were isolated from cord blood as previously described [20] and expanded on gelatin-coated flasks in EGM-2 (Lonza). ECFC-ECs were transduced with lentivirus constructs (Addgene) to express blue fluorescent protein (BFP), green fluorescent protein (GFP), or mCherry fluorescent protein and used between passages 4–7. Normal human lung fibroblasts (NHLFs) were purchased from Lonza, cultured in DMEM (Corning) containing 10% Fetal Bovine Serum (FBS, Gemini Bio Products), and used between passages 5–8. All cell types were grown in a 37°C/5% CO2/20% O2 incubator in 100% humidified air.
Experimental procedures and fluidic flow control
The cell-matrix mixture was prepared by suspending ECs (5×10⁶ cells/mL) and NHLFs (5×10⁶ cells/mL) in fibrinogen solution (10 mg/mL, Sigma-Aldrich) [21,22,23]. The suspension was then mixed with 50U/mL thrombin (Sigma-Aldrich) for a final concentration of 3 U/mL and quickly injected into tissue chambers through the gel loading port (A to B) using a micropipettor. The gel was allowed to polymerize in the incubator at 37°C for 15 minutes. Next, laminin (1 mg/mL, Life Technologies) was introduced through the cell loading port (G to H, and I to J) to coat the inner surface of the microfluidic channels as the basement membrane. These four cell loading ports were then blocked by plugs, and EGM-2 with full supplements was loaded through the media reservoir ports (C to D, and E to F). Pre-coating the microfluidic channels with laminin before adding culture medium was crucial to stimulate EC adherence to PDMS when lining, as well as EC migration outward from the tissue chamber during vasculogenesis. The initial pressure drop to maintain the physiological level of mechanical stimuli on vasculogenesis was established by filling the reservoirs to different culture medium heights (V1: 23 mm H2O, V2: 8 mm H2O, V3: 18 mm H2O, V4: 3 mm H2O). After 12 hours, the fully supplemented EGM-2 within both channels were replaced by EGM-2 without basic fibroblast growth factor (bFGF) and vascular endothelial growth factor (VEGF), and leveled at the same initial pressure drop. After formation of a capillary network inside the tissue chambers via vasculogenesis, a pipette tip containing high density (2×10⁷ cells/mL) ECs was inserted into the cell loading inlet port (I) and medium was withdrawn from the corresponding cell loading outlet port (J) until the cells filled up the microfluidic channel. The device was then incubated at 37°C for 2 hours to allow ECs to adhere to all side walls, and reverse flow (J to I) was then gently applied to remove non-adhering ECs from the microfluidic channel. By re-establishing flow under the same initial pressure drop, adhered ECs elongated to form a monolayer in response to shear stress generated by the pressure drop along the microfluidic channel (ΔPchannel=15 mm H2O). Meanwhile, the basal-to-apical transendothelial flow across the matrix-cell interface pinned at communication pores triggered the transition of lined ECs from a quiescent to an invasive phenotype leading to sprouting angiogenesis [24]. To promote the angiogenesis process, a positive VEGF gradient was also utilized in our methodology [25,26], which was induced by switching the medium inside “arterial” microfluidic channel to the fully supplemented EGM-2. After two days, the other microfluidic channel was lined with ECs using the same cell loading procedure, except that the hydrostatic pressure distribution (V1: 18 mm H2O, V2: 3 mm H2O, V3: 23 mm H2O, V4: 8 mm H2O) and the positive VEGF gradient direction were reversed.
Immunostaining and imaging
For immunostaining, the device was fixed by flowing 4% paraformaldehyde (Sigma-Aldrich) for 1 hour at room temperature, following by overnight PBS wash at 4°C. Blocking, washing, antibody incubation, and nuclei staining steps were also conducted by flowing reagents through the microfluidic channels overnight at 4°C. Static images and time-lapse image sequences were taken using a SPOT Pursuit High Speed Cooled CCD camera (SPOT Imaging).
Shear stress estimation along the microfluidic channels
The average wall shear stress along microfluidic channels is estimated based on the following equation [4].
| (1) |
where μ is the dynamic viscosity of fluid flow, ε is the aspect ratio of microfluidic channel semi-minor axis c and semi-major axis b, V is the average fluid velocity inside the microfluidic channel, A is the cross-sectional area of the microfluidic channel, and P is the perimeter of the microfluidic channel.
Dextran perfusion and permeability quantification
For evaluating perfusion of microvascular networks, medium was replaced with DPBS with similar hydrostatic pressure profile, and the device was positioned onto a microscope stage. 70 kDa-FITC dextran (Sigma-Aldrich) was added to the reservoir with highest hydrostatic pressure to a final concentration of 50 μg/mL and allowed to perfuse through the microfluidic channel. A time-lapse image sequence was recorded for 15 minutes.
For vascular permeability quantification, the device was set up in a similar manner as described above. Once the device was mounted on the microscope stage, an image of background fluorescent intensity was acquired. After allowing FITC-dextran to fully perfuse the microvascular network for 15 minutes, time-lapse images were acquired every 15 minutes for a time course of 45 minutes. The diffusive component of the solute permeability coefficient P was calculated using the equation previously described [27], by quantifying background average fluorescence intensity (Ib), initial average fluorescence intensity (Ii) step change after FITC-dextran influx reached equilibrium at the initial time point, and final average fluorescence intensity (If) at the final time point, which can be expressed as:
| (2) |
where D is the average diameter of the microvessels, and Δt is the time interval between the initial time point and the final time point.
Results and discussion
Gel loading and vasculogenesis inside the tissue chamber
By optimizing the structure of the communication pore and analyzing the relative values of burst pressure at the communication pore and advancing pressure at the chamber-connecting channel we have been able to not only prevent gel bursting, but also precisely control the gel interface at a pre-defined position aligned with the microfluidic channel wall. Fig. 2A showed the fibrin gel raised to the vertexes of communication pores with a flat gel-air interface without bursting into the microfluidic channels, which could not be achieved with the previous design (ESI† Fig. S2) [21,22,23]. After establishing interstitial flow across the tissue chamber, ECFC-ECs formed vascular fragments as early as Day 2, and continued to develop into a capillary network through Day 5. By Day 7, the capillary network was lumenized and interconnected (Fig. 2B). Fig. 2C showed the CD 31 immunostaining image of the developed capillary network inside tissue chamber. Importantly, the laminin coating inside the microfluidic channels promoted migration of EC out from the tissue chamber through the communication pore and onto the surface of the channels, thereby facilitating interconnection of the capillary network with the outer channels (Fig. 2D). This is in line with reports that laminin is also a potent chemoattractant for EC migration besides being a major component of basement membrane [28]. To verify perfusion of the developed capillary network, 15 μm diameter fluorescent microparticles were introduced into the high pressure outer channel and these then flowed through the microvascular network from one communication pore to the other and out into the low pressure outer channel, as shown in Fig. 2E and a movie clip (ESI† Movie S1).
Fig. 2.
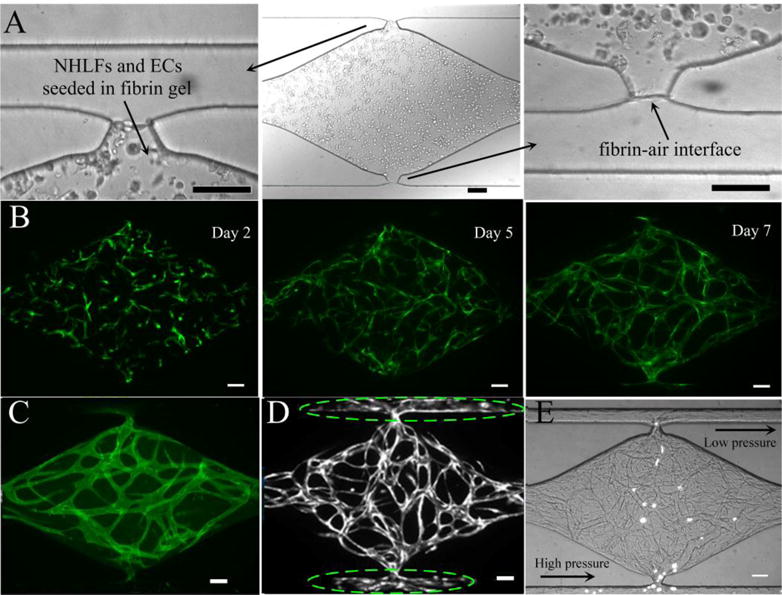
Experimental results on cell-seeded gel loading and vasculogenesis inside the tissue chamber. (A) Cell-seeded gel loading was arrested at a pre-defined location closed to the side microfluidic channel resulting in a flat gel-air interface without bursting. (B) Progression of vasculogenesis over time. (C) CD31 immunostaining image of a capillary network inside a tissue chamber. (D) ECs migrate out from tissue chamber and move along the microfluidic channel adjacent to the communication pore, as indicated by dashed ellipse. (E) Perfusion of 15 μm fluorescent microparticles inside vessel lumens. Scale bars: 100μm.
EC lining along the microfluidic channels
Since the microfluidic channels were coated with laminin and subsequently lined with an EC monolayer, its cross sectional area decreased from 100 μm×100 μm to approximately 90 μm×90 μm. The average fluid velocity was ~4300 μm/s, calculated from CFD analysis and the dynamic viscosity of the cell culture medium EGM-2 was 1×10⁻³ Pa·s. Therefore, the calculated average wall shear stress was 3.82 dyn/cm2, which was close to the average shear stress of 4 dyn/cm2 in normal microvasculature [29].
After 24 hours under laminar shear stress, the ECs lining the outer channel proliferated and formed a monolayer. By 48 hours after lining, the EC monolayer became confluent, and ECs adopted an elongated morphology and aligned with the direction of laminar flow established inside the channel (Fig. 3A). In contrast, when ECs migrated out from the tissue chamber during vasculogenesis (in the absence of EC added directly to the outer channel), ECs only coated a small portion of the channel, near the communication pore (Fig. 2D). EC lining resulted in the entire inner surface of the microfluidic channels being covered with ECs, which then represent the artery (high pressure) and vein (low pressure) of our 3D microvascular model (Fig. 3B and C). The lined EC monolayer remained intact along the channel surface for more than 7 days after lining without any collapse or regression.
Fig. 3.
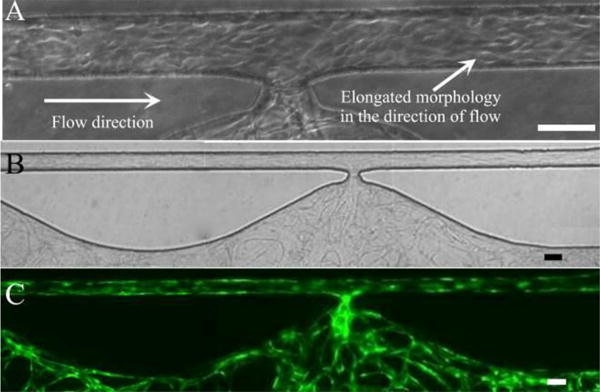
EC lining along microfluidic channel. (A) ECs with elongated morphology in the direction of fluidic flow. (B) Bright field image of EC lining along entire microfluidic channel after vasculogenesis. (C) Corresponding fluorescent image. Scale bars: 100μm.
Sprouting angiogenesis and anastomosis
Since the independent capillary network and artery/vein were formed by vasculogenesis and EC lining respectively, it was necessary to interconnect them together to form the intact microvascular network. After the EC lining process, a confluent EC monolayer formed on the gel interface at the communication pore, as shown in Fig. 4A. By applying a basal-to-apical transendothelial flow as well as generating a positive VEGF gradient, the lined ECs at the cell-matrix interface invaded into the 3D fibrin gel and formed microvascular sprouts as early as 24 hours post-lining (Fig. 4B). After 48 hours, highly branched and abundant sprouts further extended into the gel, which provided a precondition for anastomosis with the capillary network inside the tissue chamber (Fig. 4C).
Fig. 4.
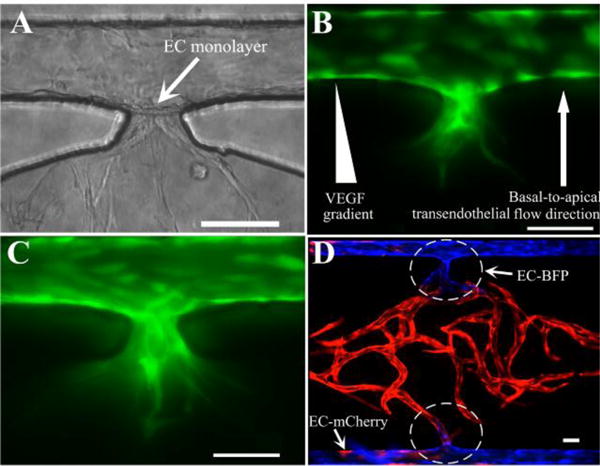
Sprouting angiogenesis and anastomosis. (A) Formation of an EC monolayer on the gel interface at the communication pore after EC lining. (B) Invasion of microvascular sprouts from the lined EC monolayer into the gel after 24 hours. (C) More sprouts and deep invasion after 48 hours post-lining. (D) Tight interconnection between EC lining along the outer channel and the capillary network inside tissue chamber by anastomosis with bidirectional migration. Scale bars: 100μm.
Anastomosis was achieved by two processes with our methodology (Fig. 4D). From inside the tissue chamber, mCherry-expressing (red) ECs (ECs-mCherry) migrated outward to the laminin-coated microfluidic channel to connect with the lined BFP-labeled ECs (ECs-BFP) in the channels. From the outer microfluidic channels, the lined ECs-BFP invaded into the 3D gel and formed sprouts (Fig. 4C) to connect with the capillaries in the tissue chamber. These bidirectional processes produced a tight connection at the communication pore between EC lining along the microfluidic channels and the capillary network inside the tissue chamber.
Multi-step microvascular network development
By integrating vasculogenesis and EC lining strategies, an intact and perfusable microvascular network of artery/vein and capillaries could be developed in this microfluidic device via a multi-step process. Fig. 5 showed development of the microvascular network through 12 days. Vasculogenesis of ECs-mCherry started to occur 3 days after introducing cell-seeded fibrin gels into the tissue chamber. ECs-BFP were added to an outer channel at this point. After 24 hours post-lining, these lined ECs-BFP began to elongate and form connections with ECs-mCherry through the communication pore. On Day 5, the other channel was lined with EC-BFP and the direction of interstitial flow, which was also the transendothelial flow direction, was reversed to promote remodeling of the capillaries inside the tissue chamber and to stimulate angiogenic sprouting of lined ECs. In addition, ECs-mCherry also migrated out from the tissue chamber and interlaced with ECs-BFP lining the microfluidic channel. ECs-BFP along both microfluidic channels continued to proliferate, elongate, and form connections with the microvascular network inside the tissue chamber thereafter. By Day 12, a fully lumenized capillary network inside the tissue chamber had anastomosed with both EC-lined microfluidic channels to form the intact microvascular network.
Fig. 5.
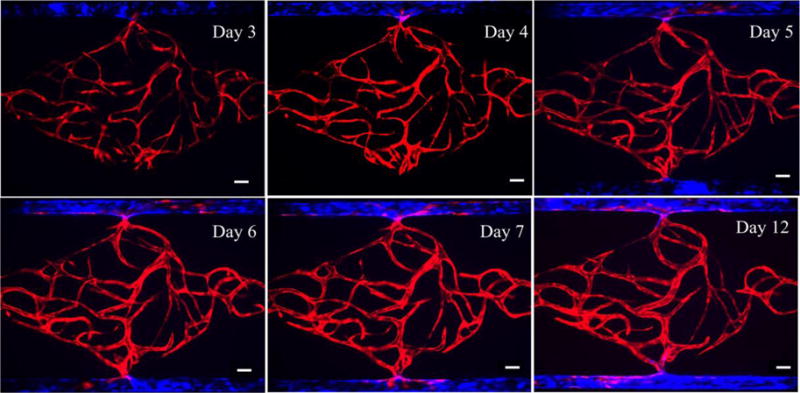
Formation of intact and perfusable microvascular network with artery/vein and capillary network by multi-step processes throughout 12 days. Scale bars: 100μm.
Perfusion in the absence of non-physiological leakage
To verify whether non-physiological leakage was present in the developed anastomotic microvascular network, 70 kDa FITC-dextran was introduced into the vessels, as shown in Fig. 6A and movie clip (ESI† Movie S2). After loading dextran from left to right in an EC-lined microfluidic channel for 4 minutes (the lower channel in the figure), it quickly flowed into the capillary network through the communication pore. Over time, the fluorescence intensity in the lumen of microvessels increased due to the intensive dextran influx. Finally, dextran passed through the capillaries and flowed into the low pressure side microfluidic channel and exited within 15 minutes, validating the connectivity and perfusability of the microvascular network. More importantly, no dextran was observed outside the vessel during the 15 minutes perfusion (and only minimal leakage at 45 minute), including the communication pore region where lined ECs connect to the microvascular network (Fig. 6B). This demonstrated the strong barrier property of the microvascular network, and the tightness of the anastomosis.
Fig. 6.
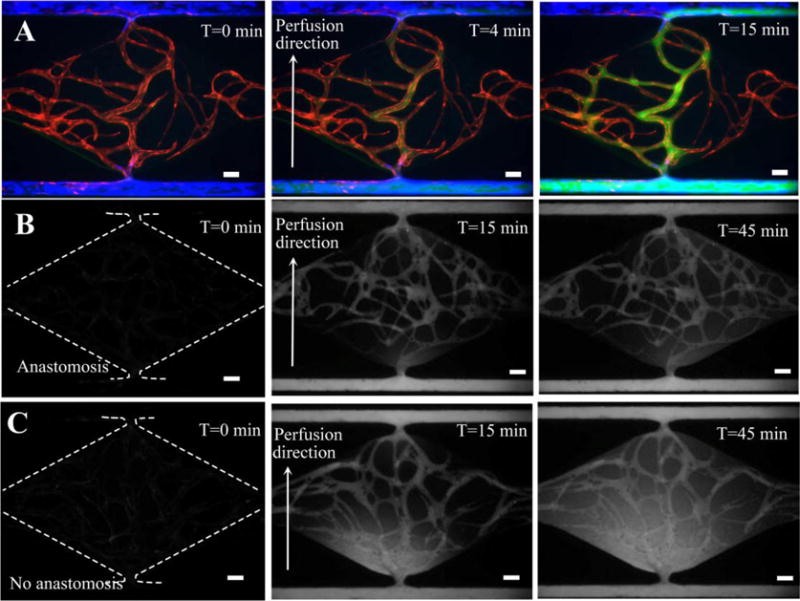
70 kDa dextran perfusion test and permeability coefficient measurement. (A) Fluorescence images showing dextran perfusion in the absence of non-physiological leakage. (B) Time lapse images of intensity change in anastomotic microvascular network for permeability coefficient measurement. (C) Time lapse images of intensity change in non-anastomotic microvascular network as a control. Scale bars: 100μm.
The reason we chose 70 kDa dextran to test barrier function is that it has a molecular weight close to human serum albumin (MW ~66.5 kDa) which is the main protein of human plasma. In addition, 4 kDa dextran was also perfused into the developed 3D microvascular network (ESI† Fig. S3). As expected, its transportation rate across vascular wall into the interstitial space was faster than that of 70 kDa dextran due to the small molecular weight, which was the same as that in vivo.
Finally, quantitative assessment of the permeability coefficient at the interconnection region was performed on both the anastomotic and non-anastomotic microvascular network with 70 kDa dextran. The fluorescence image at 0 minute was considered as background, and the fluorescence images at 15 minute and 45 minute were utilized to calculate the initial average fluorescence intensity and final average intensity, respectively. The average vessel diameter around the communication pore was 50 μm, and the time interval between the initial time point and final point was 30 minutes. The permeability coefficient of 70kDa FITC-dextran for a non-anastomotic microvascular network was measured to be 6.1×10⁻⁸ cm/s (n=2), which was 2.18 fold higher than that of 2.8×10⁻⁸ cm/s (n=2) for the anastomotic microvascular network. This result further confirmed the tight interconnection between artery/vein and capillary network with our bidirectional anastomosis process.
Discussion
This model is both biology-driven and engineering-inspired. The microvascular network formed inside tissue chamber is biology-driven via vasculogenesis, thus better recapitulating the capillary network in vivo compared to other pre-patterned network approaches utilized in previously published studies [30,31]. At the outer microfluidic channels, our engineering approach to line EC and control shear stress allows better mimicking of artery/vein, and facilitates anastomosis of the microvascular network. Compared to previous 3D microvascular models, our model provides an intact and perfusable microvascular system with artery/vein and capillary network tightly interconnected without appreciable leakage. This model represents a major advance in tools available for vascular biology research. Traditional studies of biotransportation across the blood vessel wall have been done using transwell assays, where EC are plated on one side of a transwell membrane and perivascular cells are plated on the other side to mimic the blood vessel basement membrane. However, due to the transwell membrane thickness, this method fails to capture the close interactions between EC and perivascular cells, as well as the basement membrane that they share in vivo. Thus, the blood barrier and transport properties are not fully recapitulated. With our model, intravascular physiological transport and EC-perivascular interactions can be better studied in real time with fluorescent imaging. In addition, other types of cells can be co-cultured inside the tissue chamber to produce a specific vascularized organ-on-a-chip (e.g., heart, liver, tumor, etc.). Since each functional organ unit with this design has its respective vascular interface, multiple organ-on-chips can be interconnected artery-to-artery and vein-to-vein via the EC-lined microfluidic channels, forming a basic 3D microvascular model to study organ-to-organ interactions. This model can also be applied to drug screening by eliciting the reaction of different organs to the same drugs or other chemical substances. However, there are certain limitations in our approach. While lining EC inside the microfluidic channels promotes anastomosis and limits leakage, the production process is more complex, requiring multiple additional steps. Consequently, this method cannot easily be scaled-up for high-throughput screening applications. In addition, while the EC-lined microfluidic channels mimic the inner layer of larger vessels, the lack of smooth muscle cell coverage at the outer layer limits vasoconstriction, an important mechanism in vascular regulation. We also note that the average diameter of the microvessels in the device (50μm) is larger than that of the typical capillaries (10–20μm) in vivo. Control of microvessel diameter is a complex process, dependent upon flow rate, shear, pressure, presence of pericytes/smooth muscle cells, and stiffness of the matrix. This is an interesting phenomenon that we will be further exploring.
Conclusions
In this paper, we developed an advanced 3D microvascular model by integrating vasculogenesis and EC lining strategies on one novel microfluidic device. This model is based on a robust multi-step process enabled by engineering the microfluidic device to include a microenvironment conducive for physiological vascular network development. The microvascular networks we can form in this device have excellent vascular barrier properties, and show minimal leakage. A major advantage of this model is the ability to create intact and perfusable microvascular networks including “arteries”, “veins” and capillaries that can undergo remodeling. This device can be customized for the development of specific vascularized micro-organs inside on-chip tissue chambers by co-culturing with other cell types. The vascular interfaces developed here could interconnect multiple organ units towards the vision of a human “body-on-a-chip”.
Supplementary Material
Acknowledgments
This work was supported by grants from National Institutes of Health UH3 TR00048.
Footnotes
Electronic Supplementary Information (ESI) available: See DOI: 10.1039/x0xx00000x.
Contributor Information
Christopher C. W. Hughes, Email: cchughes@uci.edu.
Abraham P. Lee, Email: aplee@uci.edu.
References
- 1.Lee H, Chung M, Jeon NL. MRS Bulletin. 2014;39(1):51. [Google Scholar]
- 2.Schimek K, Busek M, Brincker S, Groth B, Hoffmann S, Lauster R, Lindner G, Lorenz A, Menzel U, Sonntag F, Walles H, Marx U, Horland R. Lab Chip. 2013;13(18):3588. doi: 10.1039/c3lc50217a. [DOI] [PubMed] [Google Scholar]
- 3.Hasan A, Paul A, Vrana NE, Zhao X, Memic A, Hwang YS, Dokmeci MR, Khademhosseini A. Biomaterials. 2014;35(26):7308. doi: 10.1016/j.biomaterials.2014.04.091. [DOI] [PMC free article] [PubMed] [Google Scholar]
- 4.Esch MB, Post DJ, Shuler ML, Stokol T. Tissue Eng. 2011;17(23–24):2965. doi: 10.1089/ten.tea.2010.0371. [DOI] [PMC free article] [PubMed] [Google Scholar]
- 5.Bischel LL, Young EWK, Mader BR, Beebe DJ. Biomaterials. 2013;34(5):1471. doi: 10.1016/j.biomaterials.2012.11.005. [DOI] [PMC free article] [PubMed] [Google Scholar]
- 6.Booth R, Noh S, Kim H. Lab Chip. 2014;14(11):1880. doi: 10.1039/c3lc51304a. [DOI] [PubMed] [Google Scholar]
- 7.Lee H, Kim S, Chung M, Kim JH, Jeon NL. Microvascular Research. 2014;91:90. doi: 10.1016/j.mvr.2013.12.001. [DOI] [PubMed] [Google Scholar]
- 8.Kim S, Lee H, Chung M, Jeon NL. Lab Chip. 2013;13(8):1489. doi: 10.1039/c3lc41320a. [DOI] [PubMed] [Google Scholar]
- 9.Yeon JH, Ryu HR, Chung M, Hu QP, Jeon NL. Lab Chip. 2012;12(16):2815. doi: 10.1039/c2lc40131b. [DOI] [PubMed] [Google Scholar]
- 10.Vickerman V, Blundo J, Chung S, Kamm R. Lab Chip. 2008;8(9):1468. doi: 10.1039/b802395f. [DOI] [PMC free article] [PubMed] [Google Scholar]
- 11.Young EWK. J Lab Autom. 2013;18(6):427. doi: 10.1177/2211068213495206. [DOI] [PubMed] [Google Scholar]
- 12.Chiu LL, Montgomery M, Liang Y, Liu H, Radisic M. Proc Nat Acad Sci. 2012;109(50):E3414. doi: 10.1073/pnas.1210580109. [DOI] [PMC free article] [PubMed] [Google Scholar]
- 13.Whisler JA, Chen MB, Kamm RD. Tissue Eng. 2014;20(7):543. doi: 10.1089/ten.tec.2013.0370. [DOI] [PMC free article] [PubMed] [Google Scholar]
- 14.Diaz-Santana A, Shan M, Stroock AD. Integr Biol. 2015;7:454. doi: 10.1039/c5ib00052a. [DOI] [PMC free article] [PubMed] [Google Scholar]
- 15.Chan CY, Huang PH, Guo F, Ding X, Kapur V, Mai JD, Yuen PK, Huang TJ. Lab Chip. 2013;13(24):4697. doi: 10.1039/c3lc90115g. [DOI] [PMC free article] [PubMed] [Google Scholar]
- 16.Bhatia SN, Ingber DE. Nat Biotechnol. 2014;32(8):760. doi: 10.1038/nbt.2989. [DOI] [PubMed] [Google Scholar]
- 17.Huh D, Torisawa YS, Kim HJ, Ingber DE. Lab Chip. 2012;12(12):2156. doi: 10.1039/c2lc40089h. [DOI] [PubMed] [Google Scholar]
- 18.Huang CP, Lu J, Seon H, Lee AP, Flanagan LA, Kim HY, Putnam AJ, Jeon NL. Lab Chip. 2009;9(12):1740. doi: 10.1039/b818401a. [DOI] [PMC free article] [PubMed] [Google Scholar]
- 19.Cho H, Kim HY, Kang JY, Kim TS. J Colloid Interface Sci. 2007;306:379. doi: 10.1016/j.jcis.2006.10.077. [DOI] [PubMed] [Google Scholar]
- 20.Chen X, Aledia AS, Popson SA, Him L, Hughes CC, George SC. Tissue Eng A. 2010;16(2):585. doi: 10.1089/ten.tea.2009.0491. [DOI] [PMC free article] [PubMed] [Google Scholar]
- 21.Hsu YH, Moya ML, Hughes CC, George SC, Lee AP. Lab Chip. 2013;13(1):81. doi: 10.1039/c2lc40787f. [DOI] [PMC free article] [PubMed] [Google Scholar]
- 22.Hsu YH, Moya ML, Hughes CC, George SC, Lee AP. Lab Chip. 2013;13(15):2990. doi: 10.1039/c3lc50424g. [DOI] [PMC free article] [PubMed] [Google Scholar]
- 23.Moya ML, Hsu YH, Lee AP, Hughes CCW, George SC. Tissue Eng. 2013;19(9):730. doi: 10.1089/ten.tec.2012.0430. [DOI] [PMC free article] [PubMed] [Google Scholar]
- 24.Vickerman V, Kamm RD. Integr Biol. 2012;4(8):863. doi: 10.1039/c2ib00184e. [DOI] [PMC free article] [PubMed] [Google Scholar]
- 25.Song JW, Bazou D, Munn LL. Integr Biol. 2012;4:857. doi: 10.1039/c2ib20061a. [DOI] [PMC free article] [PubMed] [Google Scholar]
- 26.Song JW, Munn LL. Proc Nat Acad Sci. 2011;108(37):15342. doi: 10.1073/pnas.1105316108. [DOI] [PMC free article] [PubMed] [Google Scholar]
- 27.Jeon JS, Bersini S, Whisler JA, Chen MB, Dubini G, Charest JL, Moretti M, Kamm RD. Integr Biol. 2014;6(5):555. doi: 10.1039/c3ib40267c. [DOI] [PMC free article] [PubMed] [Google Scholar]
- 28.Simon-Assmann P, Orend G, Mammadova-Bach E, Spenlé C, Lefebvre O. Int J Dev Biol. 2011;55(4–5):455. doi: 10.1387/ijdb.103223ps. [DOI] [PubMed] [Google Scholar]
- 29.Buchanan CF, Voigt E, Szot CS, Freeman JW, Vlachos PP, Rylander MN. Tissue Eng. 2014;20(1):64. doi: 10.1089/ten.tec.2012.0731. [DOI] [PMC free article] [PubMed] [Google Scholar]
- 30.Miller JS, Stevens KR, Yang MT, Baker BM, Nguyen DH, Cohen DM, Toro E, Chen AA, Galie PA, Yu X, Chaturvedi R, Bhatia SN, Chen CS. Nature Materials. 2012;11:768. doi: 10.1038/nmat3357. [DOI] [PMC free article] [PubMed] [Google Scholar]
- 31.Zheng Y, Chen J, Craven M, Choi NW, Totorica S, Diaz-Santana A, Kermanie P, Hempstead B, Fischbach C, Lopez JA, Stroock AD. Proc Nat Acad Sci. 2012;109(24):9342. doi: 10.1073/pnas.1201240109. [DOI] [PMC free article] [PubMed] [Google Scholar]
Associated Data
This section collects any data citations, data availability statements, or supplementary materials included in this article.


