

Abstract
Optical coherence tomography (OCT) of the human retina is now becoming established as an important modality for the detection and tracking of various ocular diseases. Voxel based morphometry (VBM) is a long standing neuroimaging analysis technique that allows for the exploration of the regional differences in the brain. There has been limited work done in developing registration based methods for OCT, which has hampered the advancement of VBM analyses in OCT based population studies. Following on from our recent development of an OCT registration method, we explore the potential benefits of VBM analysis in cohorts of healthy controls (HCs) and multiple sclerosis (MS) patients. Specifically, we validate the stability of VBM analysis in two pools of HCs showing no significant difference between the two populations. Additionally, we also present a retrospective study of age and sex matched HCs and relapsing remitting MS patients, demonstrating results consistent with the reported literature while providing insight into the retinal changes associated with this MS subtype.
Keywords: voxel-based morphometry, optical coherence tomography, retina, registration, normalized atlas, multiple sclerosis, RAVENS
1. INTRODUCTION
Optical coherence tomography (OCT) is an imaging modality that provides micrometer images of the human retina using the optical scattering properties of biological tissues. The approach detects reflected or back-scattered light from tissue by passing a near-infrared beam of light through the lens of the eye and observing the reflection interference with a reference beam originating from the same light source. The resultant signal provides a profile of the reflectivity along the beam axis, known as an A-scan. Multiple A-scans along the same plane of acquisition are used to create 2D images, also known as B-scans, and collections of these form 3D volumes. Quantitative measurements obtained from these images of the cellular layers within the retina, such as average layer thicknesses, has allowed for the study of disease-induced morphological changes. The retinal nerve fiber layer (RNFL) and the ganglion cell & inner plexiform complex (GCIP) in particular, have been observed to thin significantly in multiple sclerosis (MS) patients.1,2
There has been significant development of segmentation based methods3–8 of retinal OCT for identifying the retinal layers. These approaches provide a gross breakdown of anatomical changes within patients, it does not however provide insights into the more subtle changes that may be taking place. Voxel based morphometry (VBM)9 is a standard neuroimaging analysis tool that is used to compare patients with controls or to identify correlations with age and test-scores. It generates maps of the statistically different voxel locations and is based on comparing the volumes of regions of interest across cohorts. A particular type of VBM, known as the regional analysis of volumes examined in normalized space (RAVENS), uses a tissue segmentation in an unbiased normalized atlas space10,11 along with learned deformation fields from each of the subjects in the study with respect to the normalized space. RAVENS maps consider the relative local volume change, which allows for the subtle exploration of the mean compression and expansion of cohorts at each voxel. The key component in any VBM, including RAVENS, is a deformable registration method that can be used to build unbiased normalized atlases and map subjects into those atlases. The recent work of Chen et al.12,13 presented an intensity based deformable registration based approach for OCT data with a preliminary demonstration of the potential application of the approach. A brief review of Chen et al.12,13 is included in Section 2.
Traditional analyses of OCT data have thus far only considered the average regional thicknesses of individual layers. For instance, the early treatment diabetic retinopathy study (ETDRS) grid is frequently used in the analyses of macular scans. Rectangular grids of varying size are also currently available as part of on-board software suites on certain spectral domain OCT (SD-OCT) scanners. These global measures have proved successful in providing insight into numerous diseases including macular edema,14 age-related macular degeneration,15 Alzheimer’s disease,16 and Parkinson’s disease.17 However, these types of analyses have focused on large regional changes and are not well suited to detecting complex disease-related patterns of atrophy. VBM based approaches, on the other hand, can provide a more nuanced understanding of these changes while controlling for specific confounding factors (age, sex, etc.). VBM style analyses could prove to be more sensitive than thickness changes alone if the disease-related changes lie within specific layers, such as small cysts common in microcystic macular edema.18,19
Here, we provide an overview of the framework for the VBM analysis of SD-OCT scans: From the creation and validation of the normalized atlas spaces; to the generation of RAVENS maps; and finally to the statistical comparison of controls and patient data.
2. METHOD
SD-OCT volumetric scans were acquired from both eyes of 114 healthy controls (HC) and 142 patients diagnosed with relapsing-remitting multiple sclerosis (RRMS). The macula raster scans (approximately 6mm×6mm×2mm) were acquired on a Spectralis OCT system (Heidelberg Engineering, Heidelberg, Germany) with 49 B-scans, where each B-scan had 1024 A-scans with 496 pixels per A-scan. The healthy control cohort was stratified by age (≤30, 31–40, 41–50, 51–60, ≥60) and sex, thus creating 10 strata. Each stratum was then divided into two, thereby creating two age- and sex-matched sets, HC Set I and HC Set II, with 57 subjects each (see Table 1). An equal number of patients within each stratum were also selected from the RRMS cohort to create an equivalent age- and sex-matched RRMS cohort. Thus, any changes noted in specific retinal layers can be attributed with more certainty to the disease rather than extraneous confounding factors. This was also verified by controlling for age and sex in an additional experiment.
Table 1.
Summary of age and sex statistics of the subjects in each of the three cohorts.
| Cohort | # Males | # Females | Mean Age ± SD | Sample Size |
|---|---|---|---|---|
|
|
|
|||
| HC Set I | 22 | 35 | 35.72 ± 12.07 | 57 |
| HC Set II | 21 | 36 | 36.70 ± 13.87 | 57 |
| RRMS | 22 | 35 | 39.56 ± 12.10 | 57 |
The registration method described by Chen et al.13 begins by using the fovea as a global landmark to affinely align two OCT images. Each A-scan is subsequently rescaled to align the inner limiting membrane (ILM) and Bruch’s membrane (BM), and finally, 1D radial basis functions are used to register the retinal layers. To construct a normalized atlas space (NAS), the ILM, BM, and fovea were used to globally align all the scans in the cohort in order – this centers the scans and eliminates tilts induced by off-axis SD-OCT acquisition. The average of these centered scans was then used as the initial reference and the scans are registered to it using the deformable registration approach.13 These registered scans were then averaged to create a new atlas. This process – of registering to the atlas and then updating to a new average–is iterated through until changes in the average image fall below a threshold. In our experiments, a total of three iterations were required to create the normalized atlas spaces. This method was used to construct two atlases, NAS I and NAS II, which denote the normalized atlas spaces created using HC Sets I and II, respectively.
Registering scans to the NAS brings the data into a common reference frame; however, this changes the anatomy of the registered structure. RAVENS10,11 is a tissue density based analysis technique which preserves the volume of the registered tissue. It does this by maintaining a counter for each voxel location that is incremented (by fractional or integer values) each time a voxel is mapped into that location. NAS I & II were segmented using an automated layer segmentation approach6 that detects nine retinal surfaces. Figure 1(b) shows the segmented retinal surfaces at the central B-scan of NAS I (Fig. 1(a)), which was also used to divide the RAVENS map into eight retinal layers. Figures 1(c) and (d) show the RNFL region of the RAVENS map from a HC and RRMS scan overlaid on NAS I, respectively. The overall RAVENS maps values are noticeably higher in Fig. 1(c) than (d), indicating that the RNFL in this HC was thicker than the RNFL of the RRMS subject. Figures 1(e) and (f) show a similar comparison of the GCIP region of the RAVENS map from a HC and RRMS scan overlaid on NAS I, respectively. As SD-OCT scans are not always perfectly centered on the fovea and the registration begins by centering the scans on the fovea. However, this affine correction can sometimes lead to the peripheral regions not being well represented in the NAS. Thus, our analyses are limited to a 5mm circular region centered on the fovea. Our segmentations and RAVENS maps depicted in Figs. 1 are also limited to this 5mm region.
Figure 1.
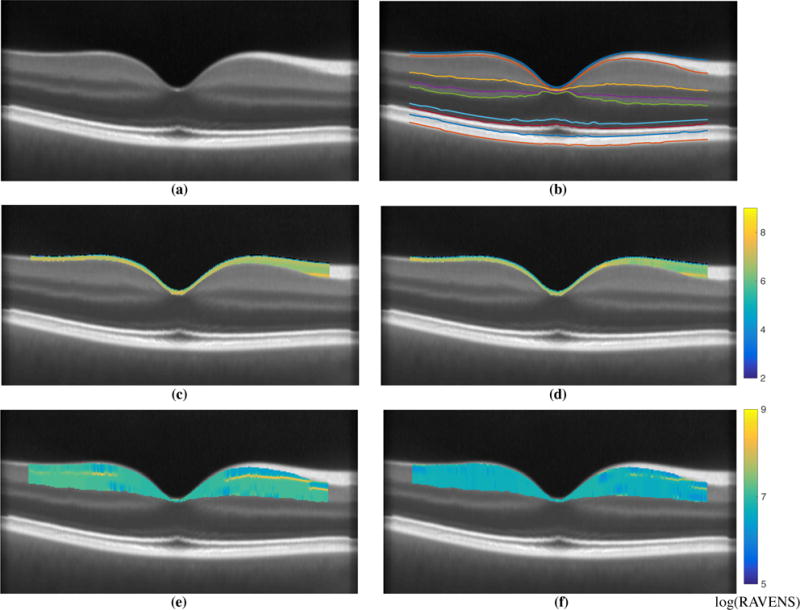
Shown in (a) is central B-scan from NAS I and (b) the overlaid corresponding automated segmentation6 used to extract the relevant layers. Example RAVENS maps of the extracted RNFL are shown for a (c) a HC, and (d) a RRMS subject scan. For the same two subjects we also show the GCIP RAVENS map in (e) the HC, and (f) the RRMS subject. Note the differing RAVENS scale for the two layers. The segmented surfaces and the RAVENS maps are only depicted within a 5mm circular region centered on the fovea.
3. EXPERIMENTS & RESULTS
We conducted two experiments using HC Sets I and II, and the age- and sex-matched RRMS cohort. These experiments were focused on 1) establishing the validity of the VBM analysis method, and 2) comparing the cohorts.
3.1 Validating VBM Framework
In order to validate the VBM analysis framework, HC Sets I and II were first compared to each other as illustrated by the flowchart in Fig. 2(a). For this, HC Sets I and II were registered to NAS I and RAVENS maps were generated for the valid retinal region bounded by the ILM and BM. The RAVENS maps from the two sets were then compared using a two sample t-test. This VBM analysis was conducted using the statistical package SPM8.20 Multiple hypothesis correction was done by controlling the false discovery rate (FDR),21 q ≤ 0.05. Of the approximately five million voxels in the retinal region bounded by the ILM and BM, not a single voxel reached significance.
Figure 2.
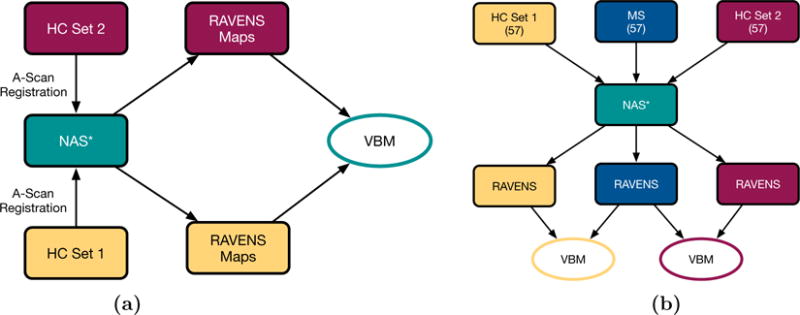
Flowcharts depicting (a) the validation experiment where the two age- and sex-matched HC sets were compared to each other, and (b) the comparison of the two HC sets and the MS cohort. The * denotes that the experiment was conducted twice, once using NAS I and once using NAS II.
This experiment was repeated using NAS II as the normalized atlas space, by registering HC Sets I and II to NAS II. The VBM analysis was repeated with SPM8 and again no significant voxels were detected in the retinal volume. Thus verifying that the two healthy control cohorts are not statistically different from each other.
3.2 Comparing HC and RRMS with VBM
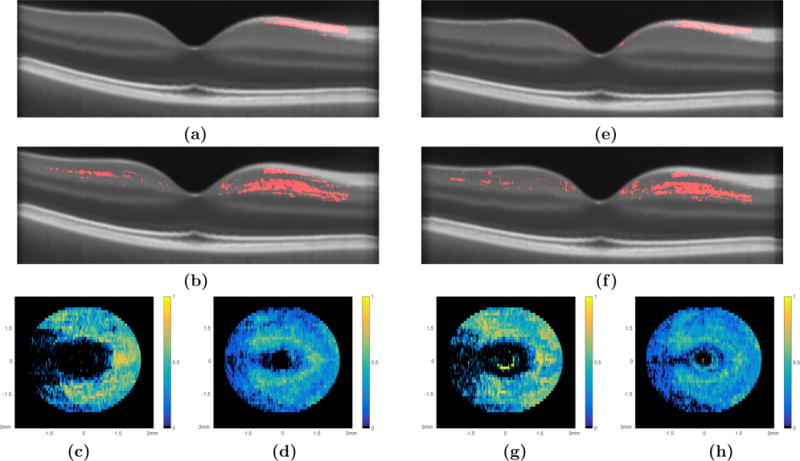
The second test conducted compared the control cohorts and the RRMS cohort, the flowchart in Fig. 2(b) explains the experimental setup. First, HC Set I and the RRMS cohort were registered to NAS II, followed by the statistical comparison of the RAVENS maps using a two sample t-test (FDR bound set to 0.05). Figures 3(a) and (b) show a central B-scan from NAS II with the location of the significantly differing voxels within the RNFL and GCIP overlaid, respectively.
Figure 3.
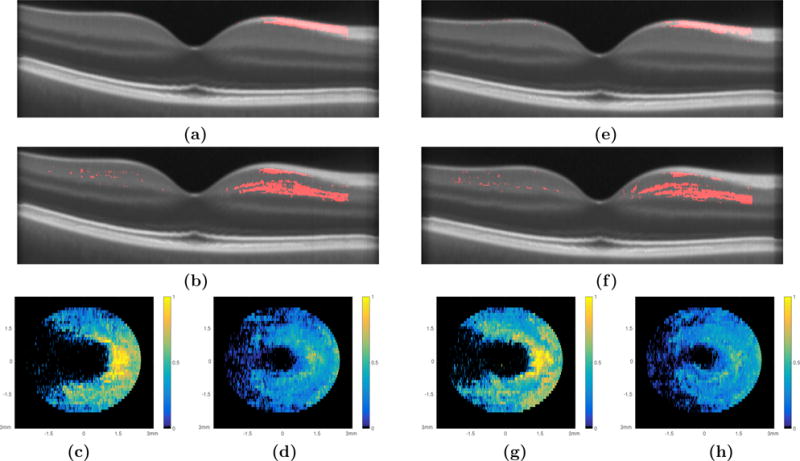
The comparison of HC Set I and the RRMS set are summarized with central B-scans depicting the significant voxels as detected through VBM analysis of (a) the RNFL and (b) the GCIP and the density maps of the (c) RNFL and (d) GCIP, respectively. An example of the density map computation can be seen in Fig. 4. The comparison of HC Set II and the RRMS set; central B-scans depicting the significant voxels as detected through VBM analysis of (e) the RNFL and (f) the GCIP and the density maps of the (g) RNFL and (h) GCIP, respectively.
In addition to visualizing the 3D locations of these voxels, density maps were created in order to summarize and visualize the results in a manner that is equivalent to the more prevalent thickness maps. This was done by computing the number of significant voxels detected per A-scan (Fig. 4(a)) and normalizing by the thickness of the layer at that specific A-scan location (Fig. 4(b)). The density maps computed for these two layers are as shown in Figs. 3(c) and (d), respectively. The density maps indicate a pattern to the RNFL and GCIP thinning that is nasally dominant and extends around the fovea in a pattern similar to a “horse shoe”.
Figure 4.
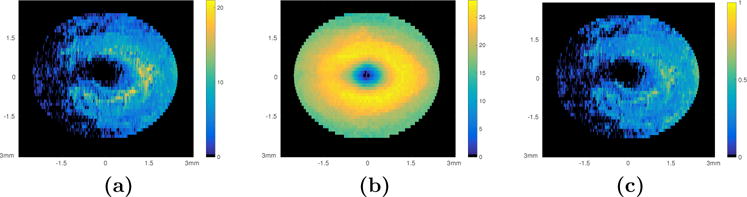
Density map generation. (a) The sum of the significant voxels in each A-scan location within the GCIP layer, (b) the thickness of the GCIP layer (in voxels) created using the layer segmentation of the NAS II, and (c) the density map created by normalizing the sum of the significant voxels by the thickness of the layer.
The comparison was repeated using HC Set II and the RRMS cohort registered to NAS I, with results shown in Figs. 3(e)–(h). While minor local differences exist between these two density maps of the RNFL (see Figs. 3(c) and (g)), the overarching pattern remains the same. Similar results were noted for the GCIP density maps, shown in Figs. 3(d) and (h).
An additional multivariate analysis was also used to compare the two HC sets and the RRMS set while controlling for age and sex. First, the RAVENS maps obtained from HC Set II and the RRMS scans after normalization with respect to NAS I were analyzed using the multivariate regression option in SPM. T-tests conducted on the coefficients associated with age and sex did not yield any significant voxels in the retinal volume. The density maps of the significant voxels obtained for the disease coefficient in the RNFL and GCIP are shown in Fig. 5(c) and (d), respectively. This experiment was repeated for the RAVENS maps obtained from HC Set I and the RRMS scans after they were normalized to NAS II. The density maps obtained for the RNFL and GCIP are shown in Fig. 5(g) and (h), respectively.
Figure 5.
The multivariate regression comparison of the HC Set I and the RRMS cohort while controlling for age and sex are summarized with central B-scans depicting the significant voxels within (a) the RNFL and (b) the GCIP and the density maps of the (c) RNFL and (d) GCIP, respectively. Similar analysis of HC Set II and the RRMS set; central B-scans depicting the significant voxels as detected through VBM analysis of (e) the RNFL and (f) the GCIP and the density maps of the (g) RNFL and (h) GCIP, respectively.
4. DISCUSSION & CONCLUSIONS
The VBM analysis framework presented describes an analysis pipeline that can be used to compare SD-OCT scans from two cohorts within a normalized atlas space. Specifically, this statistical analysis can be used to identify voxels/regions of significant differences between the two groups. The method is robust as shown by the comparison of the two age- and sex-matched healthy control cohorts within the two normalized atlas spaces, where no significantly differing voxels were detected in any of the retinal layers.
The statistical comparison of the HCs and the RRMS cohorts provides a 3D view of regions where significant difference exist between the two groups. Visualizing these regions in density maps revealed a pattern of structural loss, that has only been hinted at in thickness-based OCT analysis.1,22 Regional thickness map analysis is able to detect the significant atrophy in the RNFL and GCIP, however visualizing minor local variations can be challenging. The multivariate analysis further indicated age and sex had not contributed towards these significantly different voxels.
VBM presents an alternative to thickness analysis alone, and is capable of providing a more detailed picture of the subtle morphological changes associated with disease progression. Furthermore, the segmentations of inner retinal surfaces, which are typically harder to reliably identify, are not required for the registration of the OCT scans. The segmentation of the normalized atlas space was only utilized for the visualization of the layer specific density maps, and only the normalized atlas was segmented.
It is also noteworthy that unlike numerous neuroimaging studies,9,10 the RAVENS maps were not smoothed prior to the statistical analysis and a minimum size was also not imposed on the statistically differing regions. Our results may benefit from some smoothing as it could make our results more uniform across the normalized atlas spaces when comparing HC Set I and II with the RRMS cohort. The density maps shown in Fig. 3(c) and (g) for example, show minor differences, which could be eliminated by smoothing the RAVENS map prior to the analysis.
In the future, we intend to extend this VBM framework to a larger MS cohort with other subtypes of the disease, the goal being to characterize any subtle differences that may exist. In combination with longitudinal analysis,23 we expect to be able to chart different disease trajectories.
Acknowledgments
This work was supported by the National Institutes of Health through grants with the NEI (R21-EY022150) and the NINDS (R01-NS082347 & R01-NS082347).
References
- 1.Saidha S, Sotirchos ES, Oh J, Syc SB, Seigo MA, Shiee N, Eckstein C, Durbin MK, Oakley JD, Meyer SA, Frohman TC, Newsome S, Ratchford JN, Balcer LJ, Pham DL, Crainiceanu CM, Frohman EM, Reich DS, Calabresi PA. Relationships between retinal axonal and neuronal measures and global central nervous system pathology in multiple sclerosis. JAMA Neurol. 2013;70(1):34–43. doi: 10.1001/jamaneurol.2013.573. [DOI] [PMC free article] [PubMed] [Google Scholar]
- 2.Ratchford JN, Saidha S, Sotirchos ES, Oh JA, Seigo MA, Eckstein C, Durbin MK, Oakley JD, Meyer SA, Conger A, Frohman TC, Newsome SD, Balcer LJ, Frohman EM, Calabresi PA. Active MS is associated with accelerated retinal ganglion cell/inner plexiform layer thinning. Neurology. 2013;80(1):47–54. doi: 10.1212/WNL.0b013e31827b1a1c. [DOI] [PMC free article] [PubMed] [Google Scholar]
- 3.Antony BJ, Song Q, Abràmoff MD, Sohn EH, Wu X, Garvin MK. Incorporation of learned shape priors into a graph-theoretic approach with application to the 3D segmentation of intraretinal surfaces in SD-OCT volumes of mice. Proc SPIE 2014 Med Imaging Biomed Appl Mol Struct Funct Imaging. 2014;9038:90380D. [Google Scholar]
- 4.Antony BJ, Abràmoff MD, Harper MM, Jeong W, Sohn EH, Kwon YH, Kardon R, Garvin MK. A combined machine-learning and graph-based framework for the segmentation of retinal surfaces in SD-OCT volumes. Biomed Opt Express. 2013 Dec;4:2712–2728. doi: 10.1364/BOE.4.002712. [DOI] [PMC free article] [PubMed] [Google Scholar]
- 5.Song Q, Bai J, Garvin MK, Sonka M, Buatti JM, Wu X. Optimal multiple surface segmentation with shape and context priors. IEEE Trans Med Imag. 2013 Feb;32:376–86. doi: 10.1109/TMI.2012.2227120. [DOI] [PMC free article] [PubMed] [Google Scholar]
- 6.Lang A, Carass A, Hauser M, Sotirchos ES, Calabresi PA, Ying HS, Prince JL. Retinal layer segmentation of macular OCT images using boundary classification. Biomed Opt Express. 2013;4(7):1133–1152. doi: 10.1364/BOE.4.001133. [DOI] [PMC free article] [PubMed] [Google Scholar]
- 7.Lang A, Carass A, Calabresi PA, Ying HS, Prince JL. An adaptive grid for graph-based segmentation in retinal OCT. SPIE Med Imaging 2014. 2014 Mar;9034:903402. doi: 10.1117/12.2043040. [DOI] [PMC free article] [PubMed] [Google Scholar]
- 8.Garvin MK, Abràmoff MD, Wu X, Russell SR, Burns TL, Sonka M. Automated 3-D intraretinal layer segmentation of macular spectral-domain optical coherence tomography images. IEEE Trans Med Imag. 2009;28(9):1436–1447. doi: 10.1109/TMI.2009.2016958. [DOI] [PMC free article] [PubMed] [Google Scholar]
- 9.Ashburner J, Friston KJ. Voxel-based morphometry-the methods. Neuroimage. 2000;11(6):805–821. doi: 10.1006/nimg.2000.0582. [DOI] [PubMed] [Google Scholar]
- 10.Davatzikos C, Genc A, Xu D, Resnick SM. Voxel-based morphometry using the RAVENS maps: methods and validation using simulated longitudinal atrophy. Neuroimage. 2001;14(6):1361–1369. doi: 10.1006/nimg.2001.0937. [DOI] [PubMed] [Google Scholar]
- 11.Joshi S, Davis B, Jomier M, Gerig G. Unbiased diffeomorphic atlas construction for computational anatomy. Neuroimage. 2004;23:151–60. doi: 10.1016/j.neuroimage.2004.07.068. [DOI] [PubMed] [Google Scholar]
- 12.Chen M, Lang A, Sotirchos E, Ying HS, Calabresi PA, Prince JL, Carass A. Deformable Registration of Macular OCT Using A-Mode Scan Similarity. Proc IEEE Int Symp Biomed Imaging. 2013:476–479. doi: 10.1109/ISBI.2013.6556515. [DOI] [PMC free article] [PubMed] [Google Scholar]
- 13.Chen M, Lang A, Ying HS, Calabresi PA, Prince JL, Carass A. Analysis of macular OCT images using deformable registration. Biomed Opt Express. 2014;5(7):2184–2195. doi: 10.1364/BOE.5.002196. [DOI] [PMC free article] [PubMed] [Google Scholar]
- 14.Browning DJ, Glassman AR, Aiello LP, Bressler NM, Bressler SB, Danis RP, Davis MD, Ferris FL, Huang SS, Kaiser PK, Kollman C, Sadda S, Scott IU, Qin H. Optical coherence tomography measurements and analysis methods in optical coherence tomography studies of diabetic macular edema. Ophthalmology. 2008;115(8):1366–1371. doi: 10.1016/j.ophtha.2007.12.004. [DOI] [PMC free article] [PubMed] [Google Scholar]
- 15.Keane PA, Patel PJ, Liakopoulos S, Heussen FM, Sadda SR, Tufail A. Evaluation of Age-related Macular Degeneration With Optical Coherence Tomography. Surv Ophthalmol. 2012;57(5):389–414. doi: 10.1016/j.survophthal.2012.01.006. [DOI] [PubMed] [Google Scholar]
- 16.Lu Y, Li Z, Zhang X, Ming B, Jia J, Wang R, Ma D. Retinal nerve fiber layer structure abnormalities in early Alzheimer’s disease: Evidence in optical coherence tomography. Neurosci Lett. 2010;480(1):69–72. doi: 10.1016/j.neulet.2010.06.006. [DOI] [PubMed] [Google Scholar]
- 17.Hajee ME, March WF, Lazzaro DR, Wolintz AH, Shrier EM, Glazman S, Bodis-Wollner IG. Inner retinal layer thinning in Parkinson disease. Arch Ophthalmol. 2009;127(6):737–741. doi: 10.1001/archophthalmol.2009.106. [DOI] [PubMed] [Google Scholar]
- 18.Gelfand JM, Nolan R, Schwartz DM, Graves J, Green AJ. Microcystic macular oedema in multiple sclerosis is associated with disease severity. Brain. 2012;135:1786–1793. doi: 10.1093/brain/aws098. [DOI] [PMC free article] [PubMed] [Google Scholar]
- 19.Saidha S, Sotirchos ES, Ibrahim MA, Crainiceanu CM, Gelfand JM, Sepah YJ, Ratchford JN, Oh J, Seigo MA, Newsome SD, Balcer LJ, Frohman EM, Green AJ, Nguyen QD, Calabresi PA. Microcystic macular oedema, thickness of the inner nuclear layer of the retina, and disease characteristics in multiple sclerosis: a retrospective study. Lancet Neurol. 2012;11(11):963–972. doi: 10.1016/S1474-4422(12)70213-2. [DOI] [PMC free article] [PubMed] [Google Scholar]
- 20.Penny WD, Friston KJ, Ashburner JT, Kiebel SJ, Nichols TE, editors. Statistical parametric mapping: the analysis of functional brain images. 1. Academic Press; 2011. [Google Scholar]
- 21.Genovese CR, Lazar Na, Nichols T. Thresholding of statistical maps in functional neuroimaging using the false discovery rate. Neuroimage. 2002;15(4):870–878. doi: 10.1006/nimg.2001.1037. [DOI] [PubMed] [Google Scholar]
- 22.Saidha S, Syc SB, Ibrahim Ma, Eckstein C, Warner CV, Farrell SK, Oakley JD, Durbin MK, Meyer SA, Balcer LJ, Frohman EM, Rosenzweig JM, Newsome SD, Ratchford JN, Nguyen QD, Calabresi PA. Primary retinal pathology in multiple sclerosis as detected by optical coherence tomography. Brain. 2011;134(2):518–533. doi: 10.1093/brain/awq346. [DOI] [PubMed] [Google Scholar]
- 23.Lang A, Carass A, Al-Louzi O, Bhargava P, Ying HS, Calabresi PA, Prince JL. Longitudinal graph-based segmentation of macular OCT using fundus alignment. SPIE Med Imaging 2015. 2015;9413:94130M. doi: 10.1117/12.2077713. [DOI] [PMC free article] [PubMed] [Google Scholar]