

Abstract
Optical coherence tomography (OCT) is a noninvasive imaging modality that has begun to find widespread use in retinal imaging for the detection of a variety of ocular diseases. In addition to structural changes in the form of altered retinal layer thicknesses, pathological conditions may also cause the formation of edema within the retina. In multiple sclerosis, for instance, the nerve fiber and ganglion cell layers are known to thin. Additionally, the formation of pseudocysts called microcystic macular edema (MME) have also been observed in the eyes of about 5% of MS patients, and its presence has been shown to be correlated with disease severity. Previously, we proposed separate algorithms for the segmentation of retinal layers and MME, but since MME mainly occurs within specific regions of the retina, a simultaneous approach is advantageous. In this work, we propose an automated globally optimal graph-theoretic approach that simultaneously segments the retinal layers and the MME in volumetric OCT scans. SD-OCT scans from one eye of 12 MS patients with known MME and 8 healthy controls were acquired and the pseudocysts manually traced. The overall precision and recall of the pseudocyst detection was found to be 86.0% and 79.5%, respectively.
Keywords: graph-theoretic approach, graph-cuts, retina, multiple surface segmentation, optical coherence tomography, microcysts
1. INTRODUCTION
Spectral-domain optical coherence tomography (SDOCT)1,2 has begun to find widespread use in the diagnosis and management of a variety of ocular diseases. This noninvasive imaging modality uses near-infrared light to image the retina and allows for the quantitative analysis of retinal structures. SDOCT has also begun to find application in studying neurological disorders such as multiple sclerosis (MS), where optic neuropathy has been observed in a significant number of patients.3 In addition to decreasing estimates of the retinal nerve fiber layer (RNFL) and ganglion cell layer (GCL) thicknesses, pseudocysts or microcystic macular edema (MME) may occur in the eyes of about 5% of MS patients.4 They occur most frequently in the inner nuclear (INL), outer plexiform (OPL), and outer nuclear layers (ONL). However, these pseudocysts are not limited to MS5 and has also been found to be associated with other causes.6,7 Figure 1 shows an example of a scan obtained from an MS subject, with the MME overlaid on the scanning laser ophthalmoscope fundus image and a B-scan from an SDOCT image. While the underlying cause of these cysts has not been identified, their presence has been correlated with disease severity in MS,8 thus warranting accurate identification and tracking of these structures.
Figure 1.
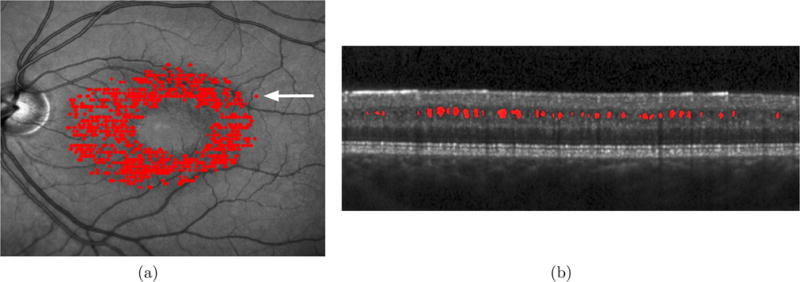
Visualization of the pseudocysts seen in an SDOCT volume obtained from an MS subject on (a) the scanning laser ophthalmoscope fundus image, and (b) a B-scan from the parafoveal location indicated by the white arrow.
Previously, we proposed two separate approaches for the segmentation of the retinal layers and the MME, where the surfaces were segmented using a graph-theoretic approach9 and the MME were detected using voxel classification,10,11 respectively. A graph-based approach was previously proposed by Chen et al. for the segmentation of larger fluid regions in the outer retina.12 This method however, relies on a preprocessing stage at which the 2-D locations of the regions are detected. Moreover, this method did not perform well in the case of small cysts, as is usually the case with MME. More recently, a combined machine-learning and graph-cut approach was proposed for the segmentation of fluid filled regions in the retina,13 however the retinal surfaces were not simultaneously segmented in this formulation.
Herein, we propose a graph-theoretic approach for the simultaneous segmentation of retinal surfaces and pseudocysts. These structures are not independent and the simultaneous segmentation of the retinal surfaces and MME could help prevent errors, such as the detection of MME in unexpected locations or errors in the surface segmentation. This is done by combining the closed set multiple surface segmentation approach14,15 and multi-region graph-cuts.16,17 The final graph is solved using a minimum s-t cut, thereby ensuring the global optimality of the final solution. Previously, Chen et al.12 described a graph-based method for the detection of large fluid filled regions in the outer retina. However, this method requires a 2-D footprint as a prior, while the proposed method does not require an estimate of the location of the pseudocysts. Furthermore, the absence of the cysts will not affect the retinal surface segmentation accuracy. The overall precision and recall of pseudocyst detection was found to be 86.0% and 79.5%, respectively. The surface segmentation frequently seen errors, specifically in the segmentation of the NFL-GCL and the GCL-INL boundaries, were also seen to improve when using this combined graph-theoretic framework.
2. METHOD
The simultaneous segmentation of multiple retinal surfaces and the pseudocysts is achieved by combining two graph-based approaches – namely graph-cuts17 and the minimum cost closed set formulation.14,18 The graph-cuts allow for the segmentation of multiple foreground structures, and while this may not be suitable for the segmentation of layered structures, it is well suited to the segmentation of disjointed structures such as pseudocysts. On the other hand, the minimum-cost closed set formulation allows for the simultaneous segmentation of multiple surfaces, and has proven to be extremely useful in the segmentation of retinal surfaces in SDOCT images.9,15,19–21 Both of these graph-theoretic formulations are solved using a minimum s-t cut, and thus, it is possible to link the graphs whereby multiple surfaces and pseudocysts can be segmented simultaneously, while ensuring a globally optimal solution. The graph structure and the cost functions used in this formulation are described in further detail below.
2.1 Graph-theoretic Formulation
The graph for the minimum-cost closed set assumes that the surface of interest intersects each column of the image of size X × Y × Z, at exactly one location, such that with . The topology of the surface is constrained by an upper bound on the expected change in the surface at adjacent columns p, q (given a predefined neighborhood , e.g., a 4-neighbor relationship) such that
| (1) |
where and represent the upper and lower bounds on the expected change in the surface between two adjacent columns p and q, respectively. These values can also be learned a priori from a training set and vary by column location and surface.22 Similarly, the expected distances between surfaces i and j can also be constrained such that
| (2) |
where and represent the expected distances between surfaces i and j, respectively.
Figure 2(a) illustrates the incorporation of these surface topology and interaction constraints. The nodes are also connected to a source and sink using directed edges.14 The minimum-cost closed set is found by finding the minimum s-t cut on this graph, and envelope of the closed set of each subgraph gives us the final multiple segmented surfaces. The key aspect of this graph is the closed set structure that ensures the continuity of the segmented surfaces.
Figure 2.
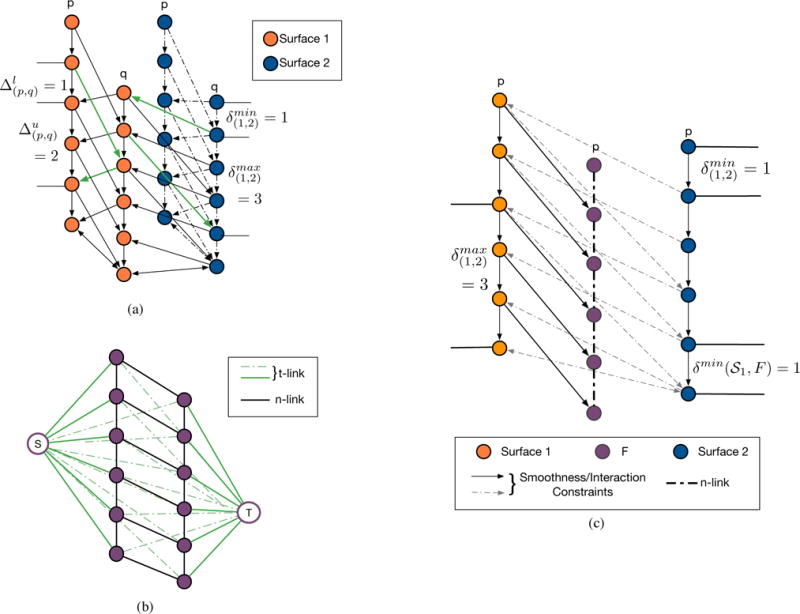
Illustrations of (a) the minimum-cost closed set formulation proposed14 for the segmentation of multiple surfaces, and (b) the graph-cut17 image segmentation, and (c) the combined graph used for the segmentation of multiple retinal surfaces and the pseudocysts.
In graph-cuts,17 each image voxel is represented by a node, which is connected by weighted edges, referred to as terminal links (t-links), to the source S and the sink T. Node , for instance, is connected to the S by the edge E(S, v) = CS(v), where CS(v) indicates the cost associated with the pixel belonging to the foreground (or belonging to the source node set). Similarly, the node n is also connected to T by the edge E(v,T) = CT(v), where CT(v) indicates the cost associated with the pixel belonging to the background (or belonging to the sink node set). Figure 2(b) shows an example with the nodes of the image connected to the source S and the sink T. Adjacent nodes vi and vj within a specified neighborhood are also connected to each other by neighborhood links (n-links), E(vi, vj) = B(vi, vj), where B(vi, vj) represents the boundary cost associated with the edge E(vi, vj) belonging to the minimum cut. Figure 2(b) shows a simple two-column example of such a graph, with the t-links shown in green and the n-links shown in black.
This formulation can also be extended to geometric configurations involving more than one foreground structure, such as when one structure is contained within another. Delong et al.16 described a multi-region framework, where infinity-weighted arcs are introduced to enforce geometric constraints such as inclusion or exclusion criteria among interacting foreground structures. Subgraphs are created for each foreground structure and are connected in order to enforce the a priori constraints. For instance, consider voxels vn and vm that belong to regions n and m, respectively. If the region n is contained with region m, then setting the weight on edge E(vn,vm) = ∞ will prevent the edge E(vn,vm) from being a part of the minimum cut.
We can formulate the combined MME and layer segmentation into this geometric constraint framework by connecting the MME and boundary sub-graphs such that the MME is constrained to lie below a particular boundary and the ordering of consecutive boundaries is enforced. Figure 2(c) shows one column (orange) from Surface 1 subgraph, corresponding to the surface above the pseudocysts, Surface 2 (blue) lies below Surface 1 and is connected using interaction constraints. The pseudocyst subgraph (purple) is connected to Surface 1, but there are no interaction constraints between the pseudocysts and Surface 2. Note, the neighborhood can also be defined to enforce a minimum distance between Surface 1 and the pseudocysts. The infinity weighted arcs (solid black) will not be part of the cut, and thus, enforce the inclusion and boundary distance constraints.
Figure 3 shows the steps involved in creating the graph used to simultaneously segment the retinal surfaces and the pseudocysts. In the previously described approach that segmented nine retinal surfaces, the inner retinal surfaces,9 namely the bottom of the RNFL, GCL, INL, and OPL are segmented simultaneously, after the ILM and the outer retinal surfaces are detected. These steps remain unchanged in the current method, and the subgraphs for these four surfaces are created using the minimum-cost closed set framework. The pseudocyst subgraph is constructed using the graph-cut formulation. Moreover, since the pseudocysts are known to occur in either the INL, OPL, or ONL, this subgraph is linked to the INL such that the pseudocysts are included within this surface closed set. This prevents any pseudocysts from being detected above this surface.
Figure 3.
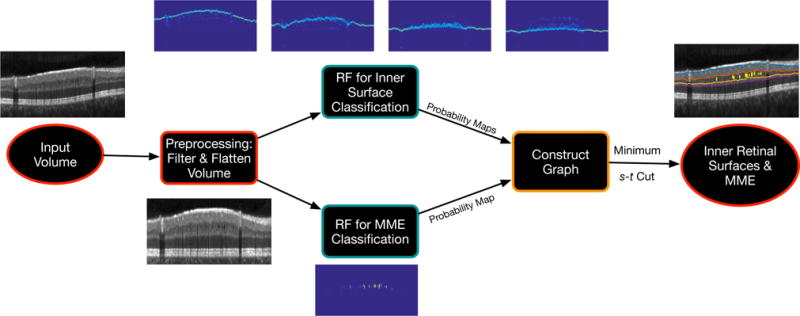
Flowchart illustrating the simultaneous segmentation of 4 inner retinal surfaces and the pseudocysts using the proposed graph-theoretic approach.
2.2 Cost Function Design
The total cost of the set of n surfaces and the pseudocysts can be represented as CT = Csurf + Ccyst, where Csurf represents the cost of the n surfaces and Ccyst represents the cost associated with the pseudocysts. In particular,
| (3) |
where ci(x, y, z) is the cost associated with voxel (x, y, z) lying on surface i. This cost function was designed using a machine-learning approach,9 where a random forest23 was trained on an independent set of manually delineated scans, in order to create probability maps for the retinal surfaces.
The second term Ccyst was designed as follows:
| (4) |
where c(v) is the cost of voxel v belonging to the foreground F, and B(vi, vj) is the boundary cost associated with the voxel vi lying on the boundary of the foreground object.
The pseudocyst region cost was also designed using a random forest classifier,10,11 where c(v) = ηe−p, where p reflects the probability value obtained from the random forest. The boundary cost was computed as , where I(v) is the intensity of voxel v. The parameters η, α, and σ were empirically chosen and set to 180, 20, and 130, respectively.
3. EXPERIMENTAL METHODS & RESULTS
Twelve volumetric SDOCT scans were acquired from nine MS patients that presented with MME and 8 healthy controls (HC).11 The macular raster scans were acquired on a Spectralis OCT system (Heidelberg Engineering, Heidelberg, Germany) and imaged a region approximately 6mm×6mm×2mm. The volume consisted of 49 B-scans, 1024 A-scans per B-scan, and 496 voxels per A-scan. A leave-one-subject-out procedure was used to train the pseudocyst random forest and test the remaining eight subjects. The random forest for the surface segmentation was trained on a completely independent set of scans.9 The pseudocyst detection precision, recall, and F-measure were computed as shown below.
| (5) |
where, TP is the number of pseudocysts correctly found, FP is the number of false positives, and FN is the number of false negatives or pseudocysts missed. (A pseudocyst is marked as a true positive if the automated method and the manual segmentation overlap.) The pseudocysts were also segmented using the voxel classification approach11 and the results from the two approaches were compared.
The twelve MS scans were divided into two groups—low density and high density scans—based on the number of cysts present. On average, the low density set contained approximately 16 cysts per scan, while the high density set contained 346 per scan. The results of the MME detection are shown in Table 1. The previously proposed voxel classification method11,24 showed an overall precision, recall and, F-measure of 86.2%, 77.5%, and 81.6% respectively. The proposed graph-theoretic method, on the other hand, showed an overall precision, recall and, F-measure of 86.0%, 79.5%, and 82.6% respectively. Figure 4 shows an example of a B-scan with the detected pseudocysts. Whereas for the healthy control cohort of eight scans, the voxel classification approach erroneously detected two pseudocysts while the proposed method only detected one.
Table 1.
Summary of pseudocysts detection accuracy statistics in the MS patients and the HC scans.
| Method | Metric | Low Density | High Density | Healthy Controls |
|---|---|---|---|---|
| # Cysts | 98 | 2076 | 0 | |
|
| ||||
| Voxel Classification11,24 | # Cysts detected | 43 | 1641 | 2 |
| Precision | 0.896 | 0.861 | – | |
| Recall | 0.439 | 0.790 | – | |
| F - measure | 0.589 | 0.824 | – | |
|
| ||||
| # Cysts detected | 43 | 1685 | 1 | |
| Proposed Method | Precision | 0.935 | 0.849 | – |
| Recall | 0.439 | 0.812 | – | |
| F - measure | 0.597 | 0.830 | – | |
Figure 4.
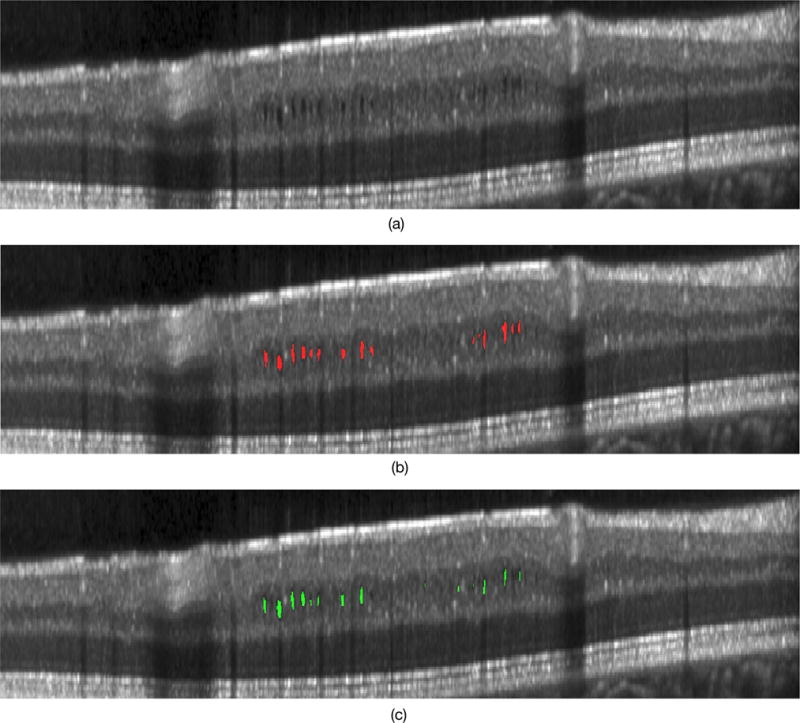
A slice from an MS patient scan showing (a) the original B-scan, (b) the manual tracings and (c) the automated result obtained using the proposed method.
The surfaces using the proposed method and the alternative automated method were qualitatively examined. No differences were noted in regions free of pseudocysts; however, in certain locations, the thin nerve fiber layer combined with the presence of the disruptive pseudocysts caused the surface segmentation algorithm9 to fail, while the proposed method was able to correct the surface segmentation in these location. Figure 5 shows an example of one of these problem areas.
Figure 5.
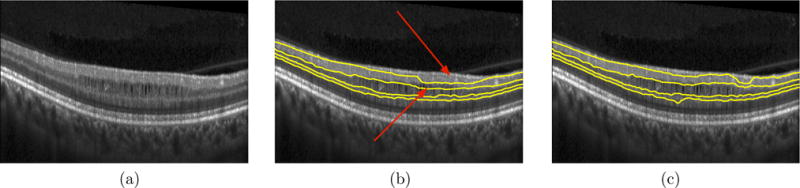
A slice from an MS patient scan showing (a) the original B-scan, (b) the segmentation result of the inner surfaces obtained using the previously described graph method9 and (c) the segmentation result obtained by the proposed method that simultaneously segments the surfaces and the pseudocysts. The red arrows indicate areas where the segmentation of the RNFL-GCIP and the GCIP-INL boundaries failed, even cutting through MMEs at certain locations. However, the use of the proposed method where the MMEs and the surfaces are simultaneous segmented prevents such errors.
4. CONCLUSION
Microcystic macular edema are an elusive and ill-understood phenomenon, occurring within a small percentage of the MS population. While these cysts are known to occur within specific retinal layers, their presence is hard to estimate. The proposed method incorporates this crucial information and simultaneously segments the retinal layers and any cysts that may be present in the images. The biggest advantage of using the simultaneous formulation is the ability to prevent surface segmentation errors that may occur in the presence of a large number of cysts as shown in Fig. 5. Moreover, the absence of cysts will also not affect the surface segmentation accuracy.
The proposed method’s graph structure utilizes an additional subgraph for the pseudocysts which does increase the memory requirements and runtime of the method as compared to the graph-based retinal layer segmentation approach.9,15 Furthermore, graph-cuts requires that the data cost be submodular, and thus certain geometric configurations cannot be optimized using the multi-region framework. For instance, if a foreground structure is included within another while also being excluded from a third, only one of these constraints, either the inclusion or the exclusion, can be enforced. Thus, in the method described here, the pseudocysts can be explicitly defined as structures that exist below the IPL-INL boundary, but a lower bound cannot be simultaneously set.
In our future work, we intend to explore the possibility of enforcing both, the upper and lower boundary constraints, perhaps using α-expansion.25 Additionally, we expect that the ability to accurately monitor and track pseudocysts in MS patients will provide insight into the cause and ultimate impact of these cysts on visual function.
References
- 1.Huang D, Swanson EA, Lin CP, Schuman JS, Stinson WG, Chang W, Hee MR, Flotte T, Gregory K, Puliafito CA. Optical coherence tomography. Science. 1991;254(5035):1178–1181. doi: 10.1126/science.1957169. [DOI] [PMC free article] [PubMed] [Google Scholar]
- 2.de Boer JF, Cense B, Park BH, Pierce MC, Tearney GJ, Bouma BE. Improved signal-to-noise ratio in spectral-domain compared with time-domain optical coherence tomography. Opt Lett. 2003;28(21):2067–2069. doi: 10.1364/ol.28.002067. [DOI] [PubMed] [Google Scholar]
- 3.Ratchford JN, Saidha S, Sotirchos ES, Oh JA, Seigo MA, Eckstein C, Durbin MK, Oakley JD, Meyer SA, Conger A, Frohman TC, Newsome SD, Balcer LJ, Frohman EM, Calabresi PA. Active MS is associated with accelerated retinal ganglion cell/inner plexiform layer thinning. Neurology. 2013;80(1):47–54. doi: 10.1212/WNL.0b013e31827b1a1c. [DOI] [PMC free article] [PubMed] [Google Scholar]
- 4.Saidha S, Sotirchos ES, Ibrahim MA, Crainiceanu CM, Gelfand JM, Sepah YJ, Ratchford JN, Oh J, Seigo MA, Newsome SD, Balcer LJ, Frohman EM, Green AJ, Nguyen QD, Calabresi PA. Microcystic macular oedema, thickness of the inner nuclear layer of the retina, and disease characteristics in multiple sclerosis: a retrospective study. Lancet Neurol. 2012;11(11):963–972. doi: 10.1016/S1474-4422(12)70213-2. [DOI] [PMC free article] [PubMed] [Google Scholar]
- 5.Burggraaff MC, Trieu J, de Vries-Knoppert WAEJ, Balk L, Petzold A. The clinical spectrum of microcystic macular edema. Investig Ophthalmol Vis Sci. 2014;55(2):952–961. doi: 10.1167/iovs.13-12912. [DOI] [PubMed] [Google Scholar]
- 6.Abegg M, Dysli M, Wolf S, Kowal J, Dufour P, Zinkernagel M. Microcystic macular edema. Ophthalmology. 2014;121(1):142–149. doi: 10.1016/j.ophtha.2013.08.045. [DOI] [PubMed] [Google Scholar]
- 7.Kaufhold F, Zimmermann H, Schneider E, Ruprecht K, Paul F, Oberwahrenbrock T, Brandt AU. Optic neuritis is associated with inner nuclear layer thickening and microcystic macular edema independently of multiple sclerosis. PLoS One. 2013;8(8):e71145. doi: 10.1371/journal.pone.0071145. [DOI] [PMC free article] [PubMed] [Google Scholar]
- 8.Gelfand JM, Nolan R, Schwartz DM, Graves J, Green AJ. Microcystic macular oedema in multiple sclerosis is associated with disease severity. Brain. 2012;135:1786–1793. doi: 10.1093/brain/aws098. [DOI] [PMC free article] [PubMed] [Google Scholar]
- 9.Lang A, Carass A, Hauser M, Sotirchos ES, Calabresi PA, Ying HS, Prince JL. Retinal layer segmentation of macular OCT images using boundary classification. Biomed Opt Express. 2013;4(7):1133–1152. doi: 10.1364/BOE.4.001133. [DOI] [PMC free article] [PubMed] [Google Scholar]
- 10.Swingle EK, Lang A, Carass A, Ying HS, Calabresi PA, Prince JL. Microcystic macular edema detection in retina OCT images. SPIE Med Imaging. 2014;2014:90380G. [Google Scholar]
- 11.Lang A, Carass A, Swingle EK, Al-Louzi O, Bhargava P, Saidha S, Ying HS, Calabresi PA, Prince JL. Automatic segmentation of microcystic macular edema in OCT. Biomed Opt Express. 2015;1601(2010):921–932. doi: 10.1364/BOE.6.000155. [DOI] [PMC free article] [PubMed] [Google Scholar]
- 12.Chen X, Niemeijer M, Zhang L, Lee K, Abramoff MD, Sonka M. Three-dimensional segmentation of fluid-associated abnormalities in retinal OCT: Probability constrained graph-search-graph-cut. IEEE Trans Med Imaging. 2012;31(8):1521–1531. doi: 10.1109/TMI.2012.2191302. [DOI] [PMC free article] [PubMed] [Google Scholar]
- 13.Bogunović H, Abràmoff MD, Sonka M. Geodesic graph cut based retinal fluid segmentation in optical coherence tomography. In: Chen X, Garvin MK, L J, Trucco E, Xu Y, editors. Proc Ophthalmic Med Image Anal (OMIA 2015), Held Conjunction with MICCAI 2015. 2015. pp. 49–56. [Google Scholar]
- 14.Li K, Wu X, Chen DZ, Sonka M. Optimal surface segmentation in volumetric images-a graph-theoretic approach. IEEE Trans Pattern Anal Mach Intell. 2006 Jan;28:119–134. doi: 10.1109/TPAMI.2006.19. [DOI] [PMC free article] [PubMed] [Google Scholar]
- 15.Garvin MK, Abràmoff MD, Wu X, Russell SR, Burns TL, Sonka M. Automated 3-D intraretinal layer segmentation of macular spectral-domain optical coherence tomography images. IEEE Trans Med Imag. 2009;28(9):1436–1447. doi: 10.1109/TMI.2009.2016958. [DOI] [PMC free article] [PubMed] [Google Scholar]
- 16.Delong A, Boykov Y. Globally optimal segmentation of multi-region objects. IEEE Int Conf Comput Vis Pattern Recognit (CVPR 2009) 2009:285–292. [Google Scholar]
- 17.Boykov Y, Jolly MP. Med Image Comput Comput Interv 2000. Vol. 1935. Springer; Heidelberg: 2000. Interactive organ segmentation using graph cuts; pp. 276–286. [Google Scholar]
- 18.Wu X, Chen DZ. Proc 29th Int Colloq Autom Lang Program (ICALP), LNCS 2380. Springer-Verlag; 2002. Optimal net surface problems with applications; pp. 1029–1042. [Google Scholar]
- 19.Lee K, Niemeijer M, Garvin MK, Kwon YH, Sonka M, Abràmoff MD. Segmentation of the optic disc in 3D-OCT scans of the optic nerve head. IEEE Trans Image Process. 2009;29(1):159–168. doi: 10.1109/TMI.2009.2031324. [DOI] [PMC free article] [PubMed] [Google Scholar]
- 20.Antony BJ, Abràmoff MD, Lee K, Sonkova P, Gupta P, Kwon Y, Niemeijer M, Hu Z, Garvin MK. Automated 3D segmentation of intraretinal layers from optic nerve head optical coherence tomography images. Proc SPIE Med Imaging 2010 Biomed Appl Mol Struct andgar Funct Imaging. 2010;7626:76260U. [Google Scholar]
- 21.Antony BJ, Abràmoff MD, Harper MM, Jeong W, Sohn EH, Kwon YH, Kardon R, Garvin MK. A combined machine-learning and graph-based framework for the segmentation of retinal surfaces in SD-OCT volumes. Biomed Opt Express. 2013 Dec;4:2712–2728. doi: 10.1364/BOE.4.002712. [DOI] [PMC free article] [PubMed] [Google Scholar]
- 22.Haeker M, Abràmoff MD, Wu X, Kardon R, Sonka M. Proc 10th Int Conf Med Image Comput Comput Interv (MICCAI 2007), Lecture Notes in Computer Science. Vol. 4791. Springer-Verlag; 2007. Use of varying constraints in optimal 3-D graph search for segmentation of macular optical coherence tomography images; pp. 244–251. [DOI] [PubMed] [Google Scholar]
- 23.Breiman L. Random forests. Mach Learn. 2001;45(1):5–32. [Google Scholar]
- 24.Swingle EK, Lang A, Carass A, Al-louzi O, Saidha S, Prince JL, Calabresi PA. Segmentation of microcystic macular edema in Cirrus OCT scans with an exploratory longitudinal study. SPIE Med Imaging 2015. 2015;9417:94170P. doi: 10.1117/12.2082164. [DOI] [PMC free article] [PubMed] [Google Scholar]
- 25.Boykov Y, Veksler O, Zabih R. Fast approximate energy minimization via graph cuts. IEEE Trans Pattern Anal Mach Intell. 2001;23(11):1222–1239. [Google Scholar]