. 2016 May 17;5:e15744. doi: 10.7554/eLife.15744

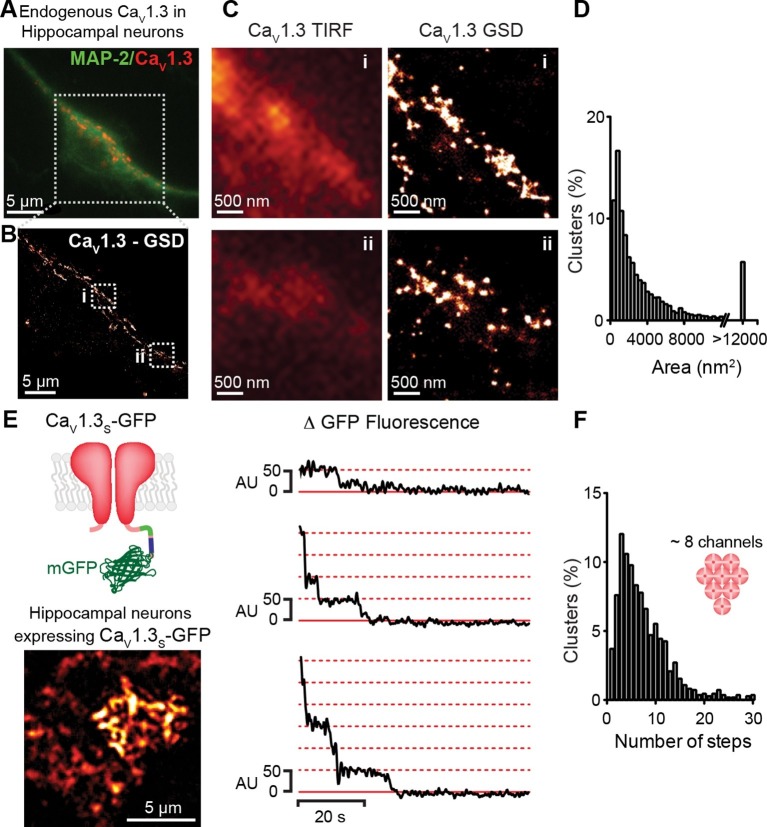
Figure 3. CaV1.3 channels assemble into clusters in the plasma membrane of cultured hippocampal neurons.

(A) Wide-field image of a representative cultured hippocampal neuron immunostained for CaV1.3 channels (red) and the neuronal marker microtubule-associated protein 2 (MAP2; green). (B) Super-resolution (GSD) image of CaV1.3 channels in the outlined region in (A). (C) Comparison of conventional (TIRF, left) and super-resolution (GSD, right) images of CaV1.3 clusters in zones i and ii outlined in (B). (D) Frequency distribution of the area of CaV1.3 channel clusters (n = 5320 clusters from 5 cells). (E) TIRF image of CaV1.3S-mGFP channels expressed in cultured hippocampal neurons (left). Examples of sequential photobleaching steps for three different clusters (right). (F) Frequency distribution of CaV1.3S cluster bleaching steps (n = 1105 clusters from 18 cells). Clustering of CaV1.3S and CaV1.3L channels was tested in tsA-201 cells expressing the respective isoform (See also Figure 3—figure supplement 1).

DOI: http://dx.doi.org/10.7554/eLife.15744.006

Figure 3.

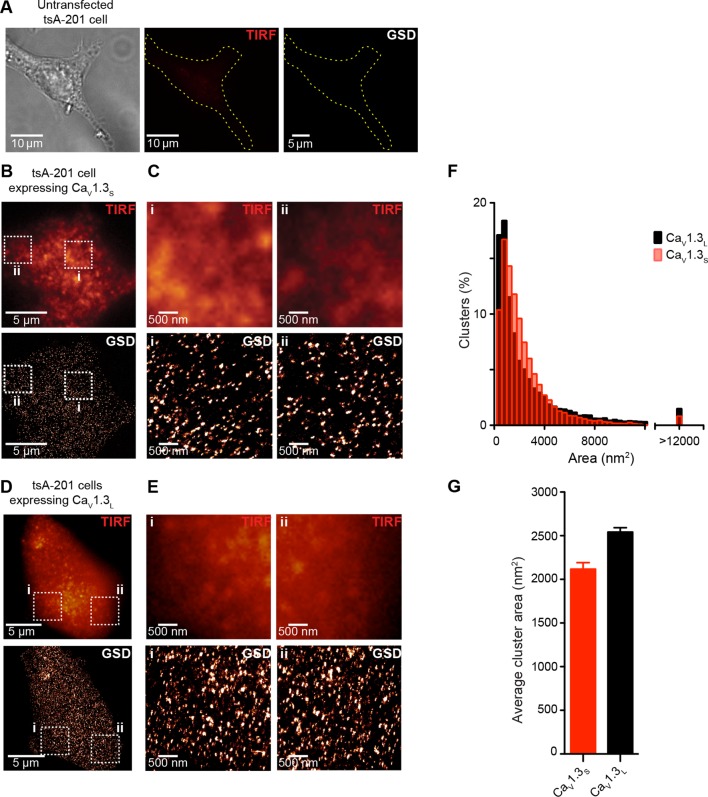
Figure 3—figure supplement 1. CaV1.3S and CaV1.3L channels form clusters in tsA-201 cells.

Figure 3—figure supplement 1.

(A) Untransfected tsA-201 cells immunostained against CaV1.3 channels. Bright field (left), TIRF (center) and super-resolution (GSD, right) images, outline depicts the periphery of the cell. (B) TIRF (top) and GSD (bottom) of the immunostaining of a representative tsA-201 cell expressing CaV1.3S channels. (C) Zoom in of the CaV1.3S clusters in zones i and ii outlined in (B). (D) TIRF (top) and GSD images (bottom) of the immunostaining of a representative tsA-201 cell expressing CaV1.3L (E) Zoom in of CaV1.3L clusters in zones i and ii in (D). (F) Frequency distributions of the area of CaV1.3S and CaV1.3L channel clusters (n = 19,143 clusters from 7 cells for CaV1.3S and 15,580 cluster from 5 cells for CaV1.3L). (G) Bar plot of the average cluster area for CaV1.3S and CaV1.3L channel clusters (n = 7 and 5 cells).
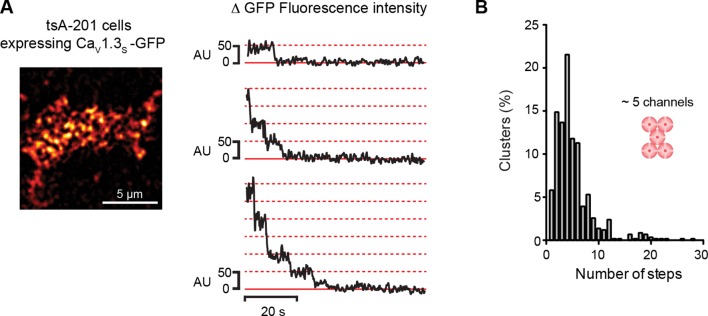
Figure 3—figure supplement 2. CaV1.3S organize in clusters of ~5 channels in tsA-201 cells.

Figure 3—figure supplement 2.

(A) TIRF image of CaV1.3S-mGFP channels expressed in tsA-201 cells (left). Sequential photobleaching steps for three different clusters (right). (B) Frequency distribution of CaV1.3S cluster bleaching steps (n = 585 clusters from 11 cells).