Abstract
Flow cytometry is a powerful means for in vitro cellular analyses where multi-fluorescence and multi-angle light scattering can indicate unique biochemical or morphological features of single cells. Yet, to date, flow cytometry systems have lacked the ability to capture complex fluorescence dynamics due to the transient nature of flowing cells. In this contribution we introduce a simple approach for measuring multiple fluorescence lifetimes from a single cytometric event. We leverage square wave modulation, Fourier analysis, and high frequency digitization and show the ability to resolve more than one fluorescence lifetime from fluorescently-labelled cells and microspheres.
Keywords: flow cytometry, fluorescence lifetime, frequency-domain, phase shift, square wave modulation, frequency harmonics
Graphical abstract
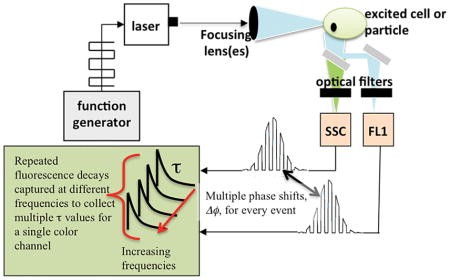
Illustration of a flow cytometer that captures more than one average fluorescence lifetime per channel. This image depicts the potential for a single cytometer to be expanded such that time-resolved signals that are multi-parametric can be obtained for every color channel. The ability to rapidly collect multiple fluorescence lifetimes from each emission detector is a powerful technique for single cell analysis and sorting.
1. Introduction
Flow cytometry is a statistically powerful in vitro analysis technique that utilizes optical measurements to examine and count large populations of heterogeneous cells and particles. Multiple biochemical, molecular, and morphological features of individual cells can be obtained with a flow cytometer, and these multi-parametric measurements make cytometry a reliable approach for blood cell counting, enrichment of cultured cell subpopulations through sorting, and other clinical cell analyses [1]. Flow cytometry systems measure fluorescence and Rayleigh scattered light from individual cells as they are hydrodynamically focused into a single fluidic stream and pass through a laser excitation source. The total fluorescence and angle-dependent scattering intensity indirectly report the presence of extrinsic fluorophores inside or on the surface of cells, cell size, and membrane granularity. Because of the many cellular features that cytometry provides, fluorescence channels have increased considerably with now up to 18 emission channels possible on new cytometers [2–8]. Such polychromatic measurements are also enabled by a plethora of synthesized organic fluorophores that bind to specific locations in the interior or on the surface of cells.
Although many polychromatic signals are now possible for cell counting and sorting, time-dependent photophysical properties cannot be measured with current commercial systems. That is, fluorescence activated cell sorting (FACS™) systems cannot measure excited state fluorescence lifetimes or track fluorescence decay kinetics from any color channel as a basis for sorting and analysis. The fluorescence lifetime is not a standard cytometry parameter for several reasons including the fact that substantial hardware changes have been necessary for implementation. The limited fluorescence lifetime instrumentation has also been coupled with a lack of common assays that leverage de-excitation times in cells.
In work by us and others, cytometry systems have been configured to measure the fluorescence lifetime [9–14]. The demonstrated systems are typically laboratory-built, or are independent efforts to retrofit commercial systems. In published research from the 1990s, fluorescence lifetime-dependent flow cytometry was established as feasible, yet the systems required specialty analog devices, high frequency filters, mixers, and data acquisition boards to capture the average fluorescence lifetime from a single color bandwidth [9, 10, 15–19]. The fluorescence lifetime changes measured have enabled differentiation of DNA content in the presence of RNA, separation of overlapping fluorescence during microsphere-based multiplexing, protein localization with fluorescent protein expression, apoptotic from non-apoptotic cell separation, and estimation of receptor site saturation on cell surfaces [20–26]. In more recent research efforts we have implemented easier methods to digitally capture average fluorescence lifetimes not only for cell counting but also cell sorting [11, 13, 14, 26].
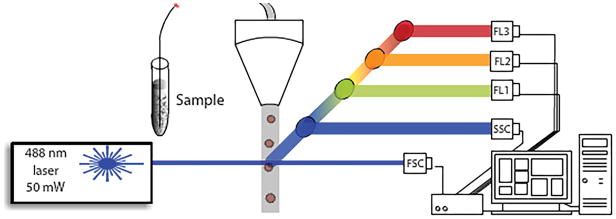
The principle method for capturing the fluorescence lifetime in flow cytometry involves frequency-domain analysis, although time-domain cytometry systems are emerging [14, 27]. Frequency-domain approaches take modulated laser excitation at a radio frequency (RF) and detect fluorescence emission and scattering signals to process for extraction of the average fluorescence lifetime [28]. The RF modulation process occurs while cells are rapidly transiting the laser beam in single file (Figure 1). The fluorescence lifetime is immediately calculated from the degree of demodulation and phase shift between the thousands of correlated fluorescence and scattered signals [11]. The fluorescence lifetime can be measured at any color channel and is an average value (i.e. single exponential decay assumption for each cell) [28].
Figure 1.
Schematic of a flow cytometry system where single flowing cells flow through a laser source and scattering and fluorescence are collected at 90 degrees by photomultiplier tubes (PMTs, denoted with nomenclature for side scatter and fluorescence channels: SSC, FL1, FL2, and FL3).
Obtaining a single average fluorescence lifetime (mono-kinetic) from each cell is a result of single frequency modulation, and therefore this methodology neglects scenarios such as multiple decay kinetic models, multiple types of fluorophores in the cell, and changing de-excitation pathways for the same types of fluorophores. Interestingly, multiple lifetime measurements were implemented decades ago in static instruments (e.g. fluorimetry, microscopy) where a stationary cell can be excited at different RFs in order to obtain multiple phase shifts and demodulation values. Yet flow cytometers have lacked poly-kinetic capabilities because of the high-throughput nature of these systems.
In this contribution, we significantly advance fluorescence lifetime-dependent flow cytometry by introducing a means to perform simultaneous, multiple RF excitation using a high-throughput instrument. We leverage digital laser modulation and digital signal processing to do so. We present measurements of multiple fluorescence lifetimes from single cells and refer to this approach as multi-frequency flow cytometry (MFFC). Future implementation of multiple fluorescence decay kinetic measurements is critical for cytometrists to fully leverage information content with polychromatic assays, label-free diagnostics (i.e. discrimination of autofluorescence signals), and assays that alter intracellular biochemistry (e.g. microenvironmental changes, pH, recruitment of a quenchers, protein movement, signal transduction, etc).
2. Experimental
2.1 Theory
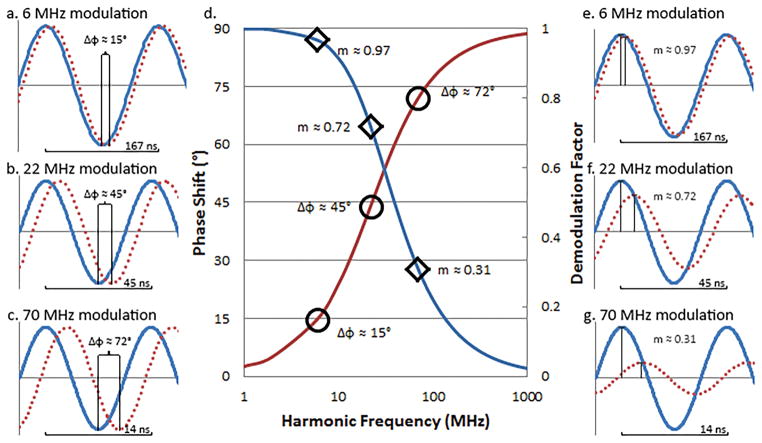
Our multi-frequency flow cytometry approach exploits the fact that the phase shift of a fluorescence signal relative to a correlated excitation signal does not maintain a constant phase shift across various frequencies. This is due to the constant lifetime value of a fluorescence decay competing with sinusoidal peak to peak times decreasing as frequency increases. The resulting phase shift thus increases as the frequency increases; the behavior of which can be seen in Figure 2a–c. The demodulation of a fluorescence signal will decrease as frequency increases for the same reason, as can be seen in Figure 2e–g. Therefore capturing many phase shifts and many demodulation values from a single cell is required to extract more than one fluorescence lifetime within that cell, as illustrated in Figure 2d.
Figure 2.
Reference (blue lines) and calculated phase shifted signal (red dotted lines) resultant from a fluorescence event for a fluorophore with an excited state lifetime of 7 ns as seen for three frequencies; a. 6 MHz, b. 22 MHz, and c. 46 MHz. d. Bode plot illustrating calculated demodulation (blue line) and phase shifts (red line) across three decade range of sinusoidal frequencies possibly used to detect fluorescence lifetime of a 7 ns fluorophore, as well as phase shifts for frequencies a, b, & c and demodulation factors for e, f, & g. Reference (blue line) and calculated demodulated signal(red line) resultant from a fluorescent event for a fluorophore with an excited state lifetime of 7 ns as seen for three example frequencies; e. 6 MHz, f. 22 MHz, and g. 46 MHz
If modeled mathematically, single frequency flow cytometry signals are typically expressed as a combination of a Gaussian function with a cosine function. Therefore when the laser is RF modulated at a single frequency, the Gaussian-shaped signal contains fixed peak-to-peak cycles for each ‘event,’ or single cell transiting the laser. Thus the excitation, Ex(t), and emission Fl(t), functions are expressed as:
| (1) |
| (2) |
with A and a being the amplitude of the waveform, B and b, the demodulation, ω the angular frequency of modulation, g and to Gaussian response parameters, and ϕ the shift in phase related to the excited state kinetic processes of fluorescence emission.
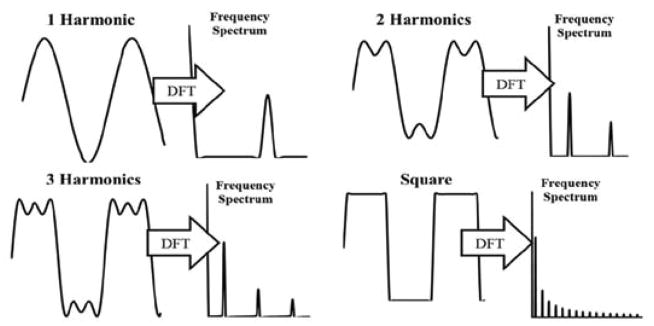
We adopt similar theory for a new multiple-frequency approach. This approach exploits square-wave modulation. Pure on-to-off digital modulation can be accomplished with solid state lasers and is mathematically represented by a square wave function. Square waves are inherently multiharmonic and are comprised of an increasing Fourier series of distinct, odd multiple sine waves of a principle frequency. Square wave functions are expressed by:
| (3) |
with i being an increasing harmonic index number, ω being angular frequency (ω = 2·π·f) based upon a given base frequency f in Hertz, and t being a time vector over the excitation pulse range. As the number of i additive harmonics increases, the sinusoidal character of the wave decreases to give a waveform resembling ceiling and floor values matching the amplitude of the primary harmonic (Figure 3).
Figure 3.
Harmonic frequency development into a square wave showing the additive sine waves and frequency spectrum post following Discrete Fourier Transform (DFT).
Therefore, square wave modulation effectively produces multi-harmonic signals in order to extract multiple phase shifts (i.e. fluorescence lifetimes) from a single event. We describe the square wave version of Equations 1 and 2 as:
| (4) |
and
| (5) |
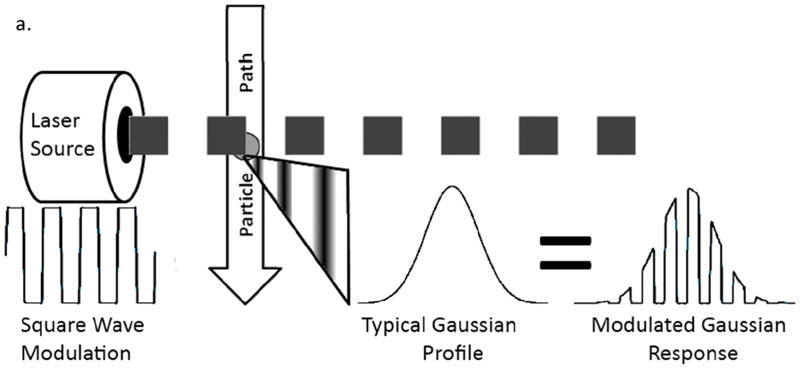
The representation of square wave modulation with a flow cytometer is illustrated by Figure 4.
Figure 4.
Illustration depicting how square wave modulation in flow cytometry results in a Gaussian-like signal with a superimposed square wave modulation to be used for fluorescence lifetime extraction.
Using this square wave approach, multiple fluorescence lifetimes are extracted; [15] each i^th sine wave is distinct and is spectrally separated with distinct phase and modulation. Thus, multiple phase and demodulation values are collected for each frequency component present within the square wave. The phase (ϕ) and modulation (m) fluorescence lifetime values (τpj and τmj) for each successive frequency are therefore expressed as:
| (6) |
| (7) |
with j being a reference to any given frequency represented within the square wave at a harmonic number i.
At the fundamental, or square-wave, frequency, which is the lowest, the determined fluorescence lifetime is biased towards that of long fluorescence decays amongst a heterogeneous mixture of decay times. When a series of higher frequencies are observed, the calculated fluorescence lifetime biasing will shift toward that of shorter-lived fluorescence components that exist along with other complex fluorescence decays in the signal.
2.2 Simulations
We evaluated this approach first with MATLAB (The MathWorks® Inc., Natick, MA) to simulate cytometry waveforms with combinations of two different single exponential decay times. We solved an excited state population balance differential equation using the square wave modulated Gaussian equations described previously. The Gaussian envelope was fixed at 10 μs (preserving typical cytometric waveforms), the square-wave modulation frequency was 2 MHz (higher inherent harmonics equivalent to 6-, 10-, 14-, 18-, and 22-MHz) and the fluorescence lifetimes simulated were 4-, 7-, 15- and 19-ns. The resultant solution is a fluorescence signal phase shifted from the excitation signal by an amount equal to the fluorescence lifetimes of the simulation input.
A Fourier analysis of each resultant signal was performed to extract the phase shift at the harmonic frequencies present within the square wave excitation waveform. From this, the phase difference between the fluorescence and excitation reference signal was found and used for lifetime determination, which was calculated by Equation 6, with j corresponding to each increasing harmonic frequency. The determined phase lifetimes from all frequencies are then used as inputs into a non-linear regression routine based on the additive single exponential decay fluorescence function.
2.3 Experiments with instrumentation, microspheres and cells
To experimentally demonstrate multi-frequency measurements a commercial flow cytometer was modified similar to that described in previous fluorescence lifetime analyses [11]. We retrofit a Becton Dickinson® (Franklin Lakes, NJ) FACSVantage™ SE cell sorter with a new 50-mW Vortran® (Sacramento, CA) Stradus™ 488-50 488nm diode laser. The laser was digitally modulated at different fundamental frequencies (see Table 1) for all experiments using a Tektronix® (Beaverton, OR) AFG-3102 arbitrary function generator.
Table 1.
Fundamental modulation frequencies evaluated during experiments with fluorescence microspheres. The associated harmonic frequencies used to extract the phase shifts and multiple fluorescence lifetimes are also listed.
| Fundamental | 5 MHz | 6.25 MHz | 12.5 MHz | 25 MHz |
|---|---|---|---|---|
| 15 | 18.75 | 37.5 | 75 | |
| 25 | 31.25 | 62.5 | ||
| 35 | 43.75 | 87.5 | ||
| 45 | ||||
| 55 |
Harmonic frequencies [MHz] evaluated for lifetimes
Cytometric signals (like that illustrated by Figure 4) representing side scattered light (SSC) and fluorescence (FL) were detected with PMTs onboard the FACSVantage™. The SSC channel is filtered with a band pass filter (488-nm/10-nm) at the laser line to remove the fluorescence contributions and the FL channel is filtered with a long pass filter (>496 nm). The output scatter and fluorescence signals from the stock PMTs are rerouted to high bandwidth preamplifiers from Advanced Research Instruments Corp. (Golden, CO, model DC-100 pre-amps at 60 dB gain).
Fluorescence and side scatter waveforms are digitized using a custom data acquisition system (DAQ), data analysis program, and dedicated computer (Dell® Optiplex 780. Round Rock, TX). The DAQ hardware (Innovative Integration® X5-210M, 250MSPS, Simi Valley, CA) is controlled, and the acquired data are visualized, with a custom analysis program (Kytos, DarklingX LLC., Los Alamos, NM). Field programmable gate array processing algorithms are accomplished by interfacing with MATLAB. The Nyquist frequency for this DAQ is 125MHz. Owing to the Nyquist upper limit and rapid attenuation of each increasing odd harmonic, only 1 to 5 higher harmonics were chosen for any given fundamental square wave modulation experiment (see again Table 1).
Fluorescent microspheres labeled with fluorophores having known fluorescence decays, were first evaluated to establish the MFFC approach. In this work, 6-μm Flow-Check™ fluorospheres from Beckman-Coulter® (Brea, CA) were used for optimal optical alignment and calibration of the fluorescence lifetime. Flow-Check™ fluorospheres have been independently measured for their excited state lifetime by our laboratory and others [10, 11] and have a single-exponential fluorescence decay variation of 6.5 ns to 7 ns. Other fluorescently-labeled microspheres were prepared and include, fluorescein labeled, Alexa Fluor® 488 microspheres (Life Technologies, Thermo Fisher Scientific), and Acridine orange-labeled microspheres. All microspheres were diluted in phosphate buffered saline (PBS) for adequate sample concentration and counting with the flow cytometer, and all have previously reported fluorescence lifetime values [28–30].
Lastly, mammalian cells were prepared and measured, and in contrast to the microsphere measurements (Table 1), the cells were evaluated using a primary modulation frequency of 2MHz and corresponding harmonics of 6-, 14-, 18-, and 22- MHz. Standard CHO-K1 Chinese hamster ovary cells (ATCC®, Manassas, VA) were grown to healthy confluence in MEM Alpha medium (Life Technologies, Carlsbad CA) and re-suspended in PBS for cytometric analysis. The CHO cells were fixed with ethanol, RNase, and labeled for cellular protein with fluorescein isothiocyanate (FITC) or for nucleic acid content with ethidium bromide (EB). Labeling of FITC and EB was performed at the standard concentrations of 1 μg and 1.5 μg per 1×10⁶ cells, respectively. A mixture of both fluorophores were added to CHO-K1 cells in order to study the ability for MFFC to discriminate between the emission of two fluorophores with spectrally overlapping fluorescence (concentrations: 1 μg FITC and 1.5 μg EB per 1×10⁶ cells). Prior to cytometric analysis all cell suspensions were brought to a concentration of 1×10⁶ cells/mL.
3. Results and discussion
The results summarized below include (i) average phase shift and average fluorescence lifetime values measured for each sample; (ii) multiple phase shift values measured for each sample; and (ii) multiple fluorescence lifetime values collected at the corresponding phase shifts at different harmonic frequencies for each sample.
Table 2 provides simulation results where the fluorescence lifetimes are determined from phase shift values by Fourier analysis at the initial harmonic and higher harmonics, or from the results of a non-linear regression of the lifetime data to an additive single exponential decay impulse model. Reduced χ2 statistics are computed for the deviation of the fluorescence model of the determined lifetime pairs from the initial fluorophore pair. The vector of determined lifetimes is found to decrease as the investigated harmonics increase due to a general biasing of the fluorophore lifetimes. At lower investigation frequencies, the determined lifetimes from a dual fluorophore system will bias towards that of the longer lived fluorophore, while at higher frequencies the determined singular lifetime will bias towards that of the shorter lived lifetime. This behavior provides a basis for possible fluorophore discrimination based upon lifetime detection at multiple frequencies.
Table 2.
Fluorescence lifetime results from simulating cytometric events. For input fluorescence lifetime pairs, simulation results from a Fourier analysis of the calculated phase shifts are shown as well as χ2 fitting parameters for those determined lifetimes to an additive single exponential fluorescence decay model. These calculated phase shifts were used as initial parameters for a nonlinear regression fitting onto this additive single exponential model, and resultant regressed fluorescence lifetimes as well as improved χ2 statistics are shown.
| Input lifetime pairs (ns) | Lifetimes from Fourier analysis (ns) | χ2R Statistic | Lifetimes from non-linear regression (ns) | χ2R Statistic | |||
|---|---|---|---|---|---|---|---|
| 4 | 7 | 4.55 | 5.39 | 0.006* | 4.1 | 7.01 | 0.341* |
| 4 | 15 | 5.71 | 9.26 | 0.044 | 4.03 | 14.9 | 0.589 |
| 4 | 19 | 6.04 | 10.7 | 0.078 | 4.04 | 19.0 | 0.7132 |
| 7 | 15 | 7.25 | 10.2 | 0.048 | 7.07 | 15.0 | 0.682 |
| 7 | 19 | 7.06 | 11.5 | 0.0829 | 7.03 | 19.0 | 0.8062 |
| 15 | 19 | 15.2 | 16.0 | 0.0443 | 15.1 | 19.1 | 1.0543 |
NaN values were calculated during the χ2 statistic for these runs. These NaN values were replaced with zeros for statistic calculation.
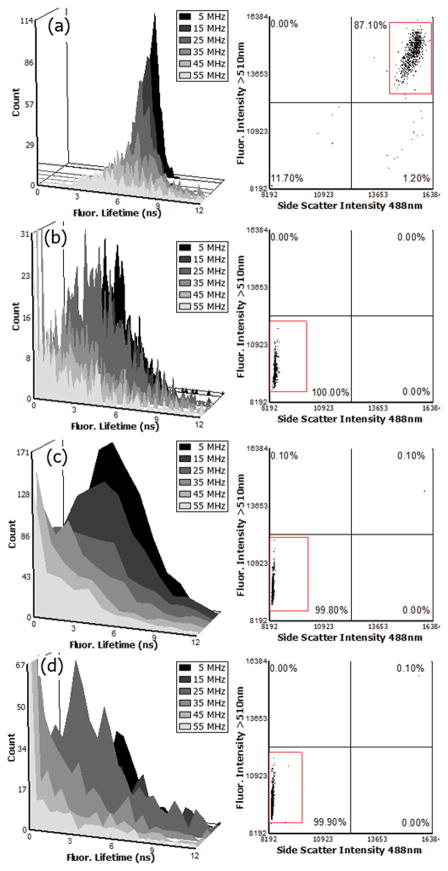
Table 3 provides results from the fluorescence lifetimes measured of different fluorescent microspheres. The Flow-Check™ fluorosphere reference was measured at 7 ns at all frequencies. The single exponential decay value for these microspheres has been measured independently by others [16, 31, 32]. As shown in Table 3, all other fluorescence microsphere populations measured had an expected consistency of their respective excited state lifetimes, which are known to generally follow single exponential decay, depending on the microenvironment [28, 29, 33–36]. In comparison with previous reports, we are measuring approximately one thousand microspheres and computing multiple fluorescence lifetimes from all 1000 events on an individual basis. This is compared to the collection of the fluorescence lifetime from a single soluble fluorophore suspension, or a small group of fluorescently-labeled cells. The results are mean fluorescence lifetime values that fall within an upper and lower bound gate on each cytometric histogram. We demonstrate this in Figure 5, which provides example FACS™ histograms of selected microspheres. These include data acquired at 5 MHz square-wave modulation frequency. In general the fluorescence lifetimes measured were consistent across each harmonic with a slight weighting of smaller lifetimes at the higher frequencies. In some cases, the measured fluorescence lifetime was large or out of expected range owing to individual event outliers and low signal-to-noise. For all lifetimes measured the standard deviation ranged from 500 ps to 6 ns, depending on the harmonic evaluated.
Table 3.
Fluorescence lifetimes measured from different fluorescent microspheres. Values were calculated from the phase shifts at each harmonic frequency, when measured.
| Fundamental frequency (harmonics) [MHz] | 5 (15,25,35 45, 55) | 6.25 (18.75, 31.25, 43.75) | 12.5 (37.5, 62.5, 87.5) | 25 (75) |
| Fluorescence lifetimes [ns] from each frequency | ||||
| Flow-Check™ | 7.0 (7.0, 6.9, 7.12, 7.18) | 6.99 (6.99, 6.73, 6.94, 5.03) | 7.06 (6.71, 5.9, 6.14) | 7.02 (7.3) |
| Fluorescein | 4.21 (5.5, 3.71, 2.8, 3.2) | 3.73 (4.3, 2.9, 2.31, 2.6) | 3.89 (2.33, 3.43, 5.8) | --- |
| Alexa Fluor® 488 | 4.17 (3.9, 3.84, 3.29, 3.23) | 25.1 (8.1, 5.1, 0.89, 0.35) | 3.62 (1.99, 4.2, 3.66) | --- |
| Acridine Orange | 4.03 (4.08, 3.77, 2.61) | 16.1 (4.2, 3.5, 1.3, 0.48) | 3.87 (2.59, 2,65, 2,62) | 3.99 (2.29) |
Figure 5.
FACS™ data of ~ 1000 counted fluorescence microspheres (Flow-Check™ (a), Acridine Orange (b), Alexa 488 (c), and fluorescein (d)). The dot plots and histograms were generated using FCS Express® (De Novo Software Inc.) after collecting .fcs files with the lifetime-modified FACSVantage™ flow cytometer. Side scatter vs. fluorescence dot plots show the gated events foreach microsphere population. Histograms of fluorescence lifetimes represent results at 5 MHz and include overlays of the associated odd harmonics (15, 25, 35, 45, and 55 MHz) lifetimes calculated. A marker with a fixed lower and upper bound that ranges across the entire population was used for averaging and calculating the standard deviations (shown in Table 3)
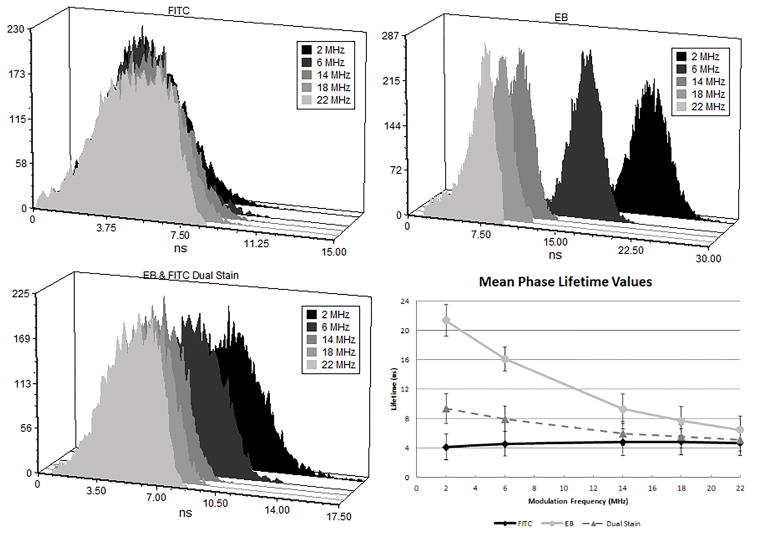
The power of the MFFC method is to enable measurements of two-lifetime component mixtures within cells. Therefore after determining that the single exponential decay values remained steady at the higher harmonics we tested this approach with fluorescently labeled cells that were stained with FITC and EB using a base frequency of 2 MHz, with subsequent harmonics at 6, 14, 18, and 22 MHz. It was found that there was electronic noise interference within the MFFC at the 10 MHz harmonic, and these data were removed. The FITC-labeled cells had measured lifetimes ranging from 4.12 +/−1.7 ns to 4.67 ns +/−1.79 ns. The measured phase lifetime at successive harmonics were found to be consistent with single exponential decay kinetics for the FITC stained CHO cells [31]. Again, approximately 1000 cells were individually measured and the fluorescence lifetimes are an average after gating the population histogram. Alternatively, EB is known to exhibit long fluorescence lifetimes coupled with multiple exponential decay kinetics [37]. The EB-labeled cell average lifetimes ranged from 21.32 ns to 6.44 ns. Finally, the fluorescence lifetimes measured for CHO cells labeled with both FITC and EB as shown in Figure 6 were 9.34 ns at 2 MHz, 7.93 ns at 6 MHz, 5.97 ns at 14 MHz, 5.57 ns at 18 MHz, and 5.15 ns at 22 MHz.
Figure 6.
FACS™ data of counted CHO-K1 cells stained with FITC only (top left), EB only (top right), and both fluorophores (bottom left). The mean values for each cell population at the 5 different frequencies evaluated is also plotted (bottom right).
Because the cell data contained fluorescence lifetimes from a two-component mixture we collected both phase and magnitude data post-data acquisition. The goal was thus to compare the fluorescence lifetimes calculated from both phase and modulation data. This offline analysis involved modifying MATLAB .m files with our own analysis code and subsequently loading these signal processing filed into our data system (KY-TOS, DarklingX LLC). In this case, a DFT was performed on the cytometric waveforms corresponding to a single cytometric event. Phase and magnitude values were recorded for each waveform at each harmonic frequency of interest with the square wave series. These data, as well as standard cytometric parameters were exported into an .fcs file for analysis via FCS Express ® (De Novo Software Inc.). Using FCS Express® parameter math functionality, the phase and magnitude values at each harmonic frequency were used to calculate the fluorescence lifetime values, through Equations 6 and 7. Due to limitations involved with scaling in the digital analysis system output, the DC component that is normally used as a demodulation reference (Bj in Equation 7) is always measured at the maximum recordable level.
In order to calculate a demodulation index m, we have instead used the demodulation factors of the primary frequency of the square wave as this reference and calculated demodulation lifetimes at each subsequent harmonic frequency. These lifetime values were then plotted as histograms where other statistics could be gathered. In this work we calculated the modulation lifetimes for the cell measurements at 6, 14, 18, and 22 MHz based on a 2 MHz square wave and found the values to confirm the phase shift measurements. The mean modulation lifetimes for each of the three fluorescently-labeled cell samples decreased with increasing harmonic frequencies examined. For the FITC stained cells, mean values of 6.95, 5.25 ns, 5.09 ns, and 4.98 ns were calculated at 6, 14, 18, and 22 MHz with standard deviations ranging from 2.5 to 4.5 ns. The mean modulation lifetimes of the EB stained cells were calculated to be 16.9, 14.48 ns, 12.06 ns, and 9.21 ns at the same frequencies with standard deviations of 115.7 ns, 13.8 ns, 24.6 ns, and 47.9 ns. For the CHO cells dually stained with both EB and FITC the modulation lifetimes calculated were 8.53, 5.59, 5.34, and 5.28 ns at 6, 14, 18, and 22 MHz, with standard deviations ranging from 3.3 to 5.0 ns
4. Conclusion
By leveraging square wave modulation and the multiple harmonics within a square wave, we demonstrate a simple and reliable way in which multiple fluorescence lifetime data can be extracted from a single cell in a flow cytometer. The results in this study demonstrate by simulations and cytometry measurements that discrimination of unique fluorescence lifetimes from fluorophores that emit similar fluorescence intensities and that have a large degree of spectral overlap is possible. Experimental MFFC results with fluorescently labeled cells presented here foreshadow the great potential for multi-lifetime and data extraction in flow cytometry. With the development of digital signal processing techniques such as those described herein, the fluorescence lifetime can be exploited and instrumentation can be gradually improved to reveal multiple distinct lifetime changes in the form of multiple list mode parameters, not unlike spectral differences exploited in standard cytometry. Our future lifetime systems will bring multi-frequency lifetime analysis ‘on-line’ for flow cytometric data acquisition and analysis. This development will allow for lifetime calibration at each harmonic frequency and the addition of the ability to sort based upon multiple lifetime measurements.
Supplementary Material
Acknowledgments
This research was funded by the National Institutes of Health Grant 2U54CA 132383-06A1
Footnotes
Author biographies Please see Supporting Information online.
References
- 1.Shapiro HM. Practical Flow Cytometry. John Wiley & Sons Inc; Hoboken, MJ: 2003. [Google Scholar]
- 2.Perfetto SP, Chattopadhyay PK, Roederer M. Nat Rev Immunol. 2004;4:648–655. doi: 10.1038/nri1416. [DOI] [PubMed] [Google Scholar]
- 3.Chattopadhyay PK, Price DA, Harper TF, Betts MR, Yu J, Gostick E, Perfetto SP, Goepfert P, Koup RA, De Rosa SC, Bruchez MP, Roederer M. Nat Med. 2006;12:972–977. doi: 10.1038/nm1371. [DOI] [PubMed] [Google Scholar]
- 4.Chattopadhyay PK, Yu J, Roederer M. Methods Mol Biol. 2007;374:175–184. doi: 10.1385/1-59745-369-2:175. [DOI] [PubMed] [Google Scholar]
- 5.Chattopadhyay PK, Hogerkorp CM, Roederer M. Immunology. 2008;125:441–449. doi: 10.1111/j.1365-2567.2008.02989.x. [DOI] [PMC free article] [PubMed] [Google Scholar]
- 6.Perfetto SP, Ambrozak D, Nguyen R, Chattopadhyay PK, Roederer M. Nat Protoc. 2012;7:2067–2079. doi: 10.1038/nprot.2012.126. [DOI] [PubMed] [Google Scholar]
- 7.Chattopadhyay PK, Gaylord B, Palmer A, Jiang N, Raven MA, Lewis G, Reuter MA, Nur-ur Rahman AK, Price DA, Betts MR, Roederer M. Cytometry A. 2012;81:456–466. doi: 10.1002/cyto.a.22043. [DOI] [PubMed] [Google Scholar]
- 8.Nguyen R, Perfetto S, Mahnke YD, Chattopadhyay P, Roederer M. Cytometry A. 2013;83:306–315. doi: 10.1002/cyto.a.22251. [DOI] [PMC free article] [PubMed] [Google Scholar]
- 9.Pinsky BG, Ladasky JJ, Lakowicz JR, Berndt K, Hoffman RA. Cytometry. 1993;14:123–135. doi: 10.1002/cyto.990140204. [DOI] [PubMed] [Google Scholar]
- 10.Steinkamp JA, Keij JF. Review of Scientific Instruments. 1999;70:4682–4688. [Google Scholar]
- 11.Houston JP, Naivar MA, Freyer JP. Cytometry Part A. 2010;77A:861–872. doi: 10.1002/cyto.a.20930. [DOI] [PMC free article] [PubMed] [Google Scholar]
- 12.Houston JP, Naivar MA, Freyer JP. Current Protocols in Cytometry. 2012 doi: 10.1002/0471142956.cy0125s59. [DOI] [PMC free article] [PubMed] [Google Scholar]
- 13.Cao R, Pankayatselvan V, Houston JP. Opt Express. 2013;21:14816–14831. doi: 10.1364/OE.21.014816. [DOI] [PMC free article] [PubMed] [Google Scholar]
- 14.Li W, Vacca G, Castillo M, Houston KD, Houston JP. Electrophoresis. 2014;35:1846–1854. doi: 10.1002/elps.201300618. [DOI] [PMC free article] [PubMed] [Google Scholar]
- 15.Steinkamp JA, Crissman HA. Cytometry. 1993;14:210–216. doi: 10.1002/cyto.990140214. [DOI] [PubMed] [Google Scholar]
- 16.Steinkamp JA. Methods Cell Biol. 1994;42(Pt B):627–640. doi: 10.1016/s0091-679x(08)61099-7. [DOI] [PubMed] [Google Scholar]
- 17.Deka C, Cram LS, Habbersett R, Martin JC, Sklar LA, Steinkamp JA. Cytometry. 1995;21:318–328. doi: 10.1002/cyto.990210403. [DOI] [PubMed] [Google Scholar]
- 18.Deka C, Steinkamp JA. Appl Opt. 1996;35:4481–4489. doi: 10.1364/AO.35.004481. [DOI] [PubMed] [Google Scholar]
- 19.Keij JF, Bell-Prince C, Steinkamp JA. Cytometry. 1999;35:48–54. doi: 10.1002/(sici)1097-0320(19990101)35:1<48::aid-cyto7>3.0.co;2-5. [DOI] [PubMed] [Google Scholar]
- 20.Keij JF, Steinkamp JA. Cytometry. 1998;33:318–323. [PubMed] [Google Scholar]
- 21.Sailer BL, Nastasi AJ, Valdez JG, Steinkamp JA, Crissman HA. Cytometry. 1996;25:164–172. doi: 10.1002/(SICI)1097-0320(19961001)25:2<164::AID-CYTO5>3.0.CO;2-H. [DOI] [PubMed] [Google Scholar]
- 22.Sailer BL, Nastasi AJ, Valdez JG, Steinkamp JA, Crissman HA. J Histochem Cytochem. 1997;45:165–175. doi: 10.1177/002215549704500203. [DOI] [PubMed] [Google Scholar]
- 23.Sailer BL, Valdez JG, Steinkamp JA, Darzynkiewicz Z, Crissman HA. Exp Cell Res. 1997;236:259–267. doi: 10.1006/excr.1997.3717. [DOI] [PubMed] [Google Scholar]
- 24.Sailer BL, Valdez JG, Steinkamp JA, Crissman HA. Cytometry. 1998;31:208–216. [PubMed] [Google Scholar]
- 25.Cui HH, Valdez JG, Steinkamp JA, Crissman HA. Cytometry A. 2003;52:46–55. doi: 10.1002/cyto.a.10022. [DOI] [PubMed] [Google Scholar]
- 26.Gohar AV, Cao R, Jenkins P, Li W, Houston JP, Houston KD. Biomed Opt Express. 2013;4:1390–1400. doi: 10.1364/BOE.4.001390. [DOI] [PMC free article] [PubMed] [Google Scholar]
- 27.Lu Y, Lu J, Zhao J, Cusido J, Raymo FM, Yuan J, Yang S, Leif RC, Huo Y, Piper JA, Paul Robinson J, Goldys EM, Jin D. Nat Commun. 2014;5:3741. doi: 10.1038/ncomms4741. [DOI] [PMC free article] [PubMed] [Google Scholar]
- 28.Lakowicz JR. Principles of Fluorescence Spectroscopy. Springer; 2006. [Google Scholar]
- 29.Gadella TJ, Jovin TM, Clegg RM. Biophysical Chemistry. 1993;48:221–239. [Google Scholar]
- 30.Boens N, Qin W, Basarić N, Hofkens J, Ameloot M, Pouget J, Lefèvre JP, Valeur B, Gratton E, vandeVen M, Silva ND, Engelborghs Y, Willaert K, Sillen A, Rumbles G, Phillips D, Visser AJ, van Hoek A, Lakowicz JR, Malak H, Gryczynski I, Szabo AG, Krajcarski DT, Tamai N, Miura A. Anal Chem. 2007;79:2137–2149. doi: 10.1021/ac062160k. [DOI] [PMC free article] [PubMed] [Google Scholar]
- 31.Deka C, Lehnert BE, Lehnert NM, Jones GM, Sklar LA, Steinkamp JA. Cytometry. 1996;25:271–279. doi: 10.1002/(SICI)1097-0320(19961101)25:3<271::AID-CYTO8>3.0.CO;2-I. [DOI] [PubMed] [Google Scholar]
- 32.Sands B, Jenkins P, Peria WJ, Naivar M, Houston JP, Brent R. PLoS One. 2014;9:e109940. doi: 10.1371/journal.pone.0109940. [DOI] [PMC free article] [PubMed] [Google Scholar]
- 33.Martí AA, Li X, Jockusch S, Stevens N, Li Z, Raveendra B, Kalachikov S, Morozova I, Russo JJ, Akins DL, Ju J, Turro NJ. Tetrahedron. 2007;63:3591–3600. doi: 10.1016/j.tet.2006.08.109. [DOI] [PMC free article] [PubMed] [Google Scholar]
- 34.Mettikolla P, Luchowski R, Gryczynski I, Gryczynski Z, Szczesna-Cordary D, Borejdo J. Biochemistry. 2009;48:1264–1271. doi: 10.1021/bi801629d. [DOI] [PMC free article] [PubMed] [Google Scholar]
- 35.Sindbert S, Kalinin S, Nguyen H, Kienzler A, Clima L, Bannwarth W, Appel B, Müller S, Seidel CA. J Am Chem Soc. 2011;133:2463–2480. doi: 10.1021/ja105725e. [DOI] [PubMed] [Google Scholar]
- 36.Hammer M, Schweitzer D, Richter S, Königsdörffer E. Physiol Meas. 2005;26:N9–12. doi: 10.1088/0967-3334/26/4/N01. [DOI] [PubMed] [Google Scholar]
- 37.Malak H, Castellano FN, Gryczynski I, Lakowicz JR. Biophys Chem. 1997;67:35–41. doi: 10.1016/s0301-4622(97)00017-3. [DOI] [PubMed] [Google Scholar]
Associated Data
This section collects any data citations, data availability statements, or supplementary materials included in this article.


