

Summary
Antibiotic-resistant infections annually claim hundreds of thousands of lives worldwide. This problem is exacerbated by resistance gene exchange between pathogens and benign microbes from diverse habitats. Mapping resistance gene dissemination between humans and their environment is a public health priority. We characterized the bacterial community structure and resistance exchange networks of hundreds of interconnected human fecal and environmental samples from two low-income Latin American communities. We found that resistomes across habitats are generally structured by bacterial phylogeny along ecological gradients, but identified key resistance genes that cross habitat boundaries and determined their association with mobile genetic elements. We also assessed the effectiveness of widely-used excreta management strategies in reducing fecal bacteria and resistance genes in these settings representative of low- and middle-income countries. Our results lay the foundation for quantitative risk assessment and surveillance of resistance dissemination across interconnected habitats in settings representing over two-thirds of the world’s population.
Text
Antibiotic resistance (AR) in bacterial pathogens causes hundreds of thousands of annual fatalities globally1–3. The spread of resistant organisms and their AR genes occurs by direct contact between humans and via interactions with environmental microbiota4–6. Horizontal gene transfer (HGT) facilitates this dissemination, and the reservoir of AR genes (the ‘resistome’7) in the environment, from which pathogens could theoretically draw, is ancient, diverse, and widespread8–10. Characterizing resistome distributions and their potential for dissemination across diverse habitats can identify the microbiota and AR genes that pose the highest risks to human health.
Most resistome studies have focused on either industrialized11–13 or remote, ‘pristine’ settings8,9,14. However, most of the world’s people reside outside these extremes: ~5.8 billion live in low- and middle-income countries15, with 863 million in slums16. Here, we characterized the microbiomes and resistomes of human fecal and co-localized, ecologically diverse environmental microbiota from two low-income, resource-limited Latin American settings: (1) a rural village of subsistence farmers in El Salvador (RES) and (2) a peri-urban shanty-town (slum) in Lima, Peru (PST), which represent critically understudied microbial ecosystems (Extended Data Figure 1A). Aspects of life in such settings that are distinct from both hunter-gatherer and industrialized populations include crowding (in PST), limited access to clean drinking water and sanitation, supplementation of personally grown produce and livestock with processed foods, and ready access to antibiotics without prescriptions17. Furthermore, such industrializing countries are responsible for the majority of the worldwide 36% increase in antibiotic use between 2000 and 201018, making investigation of AR transfer in these settings a global public health priority.
We analyzed 263 fecal samples from 115 individuals in 27 houses over two years from RES and PST, as well as 209 environmental samples from donor households and surrounding areas in these communities. The environmental samples included feces from domesticated animals, soil, water, and samples from the sanitation facilities of each community: composting latrines in RES and a district-wide sewage system with a modern wastewater treatment plant (WWTP) in PST. We used a combination of 16S sequencing10,19, high-throughput functional metagenomic selections10,20,21, and whole-metagenome shotgun sequencing11,22 to compare the phylogenetic architectures of these microbial populations and their associated resistomes.
Resistome correlates with phylogeny across habitats
Small-insert metagenomic expression libraries in Escherichia coli constructed from 51 human fecal and 45 environmental samples from RES and PST (representing 258 Gb) were selected for functional resistance against 17 antibiotics (Supplementary Table 1). Sequencing and annotation4,23 of these selections identified 1100 unique (100% amino acid identical) encoded AR proteins collectively conferring resistance against all antibiotics except meropenem (see Methods; Supplementary Table 2). 121 of these proteins were novel (<60% amino acid identity to any protein in NCBI nr), the majority of which (72%) were predicted antibiotic modifiers, including 57 class A β-lactamases. RES latrine libraries yielded the most novel proteins (46%), proportionally more than expected (Pearson’s Chi-squared test, p<2x10⁻⁵; Extended Data Figure 1C).
To further characterize RES and PST resistome diversity and abundance, we performed whole metagenome shotgun sequencing on 191 human fecal and 94 environmental samples (representing 344 Gb; Extended Data Figure 1B; see Methods). We used ShortBRED24 to quantify translated AR gene abundance in all sequenced metagenomes using a custom AR database that included AR genes identified here (see Methods; Supplementary Tables 3–5). RES and PST human-associated and environmental resistomes were related along an ecological gradient in terms of input from human feces (Bray-Curtis; Extended Data Figure 2A), with habitat explaining 22.4% of resistome variation (adonis, p<0.001, Bray-Curtis).
A similar ecological gradient by habitat was observed when considering phylogenetic composition, based on 16S sequencing of 228 human fecal and 203 environmental samples from RES and PST (Extended Data Figure 1B; see Methods), with habitat explaining even more of the variation between samples (41.9%; adonis, p<0.001, weighted UniFrac; Extended Data Figure 2B). Procrustes analysis confirmed that AR is significantly correlated with community composition (Bray-Curtis, M2 = 0.360, p<0.001; Extended Data Figure 2C), not randomly distributed across habitats10,23.
RES/PST vs. global human fecal microbiota
The human gut microbiota is highly diverse globally, with phylogenetic and functional variation potentially driven by age, diet, cultural traditions, pathogen carriage, and periodic perturbation (e.g., by antibiotic exposure)19,22. We compared the RES and PST human fecal microbiota to published microbiota datasets from the USA, Malawi, Venezuela, and Peru (Amazonian hunter-gatherers and Andean highlands agriculturalists) (see Methods)14,19,25, classifying PST as “peri-urban industrializing” and RES as “rural agriculturalist”. Fecal microbiota composition clustered by host lifestyle19,25, despite differences in geographic origin and study: RES microbiota clustered with other rural agriculturalists and hunter-gatherers, while peri-urban PST microbiota were intermediate between these and the urban industrialized cohorts (adonis R2 = 23.8%, p<0.001, weighted UniFrac; Figure 1A; Extended Data Figure 3).
Figure 1. RES and PST human fecal microbiota and resistomes versus global populations.
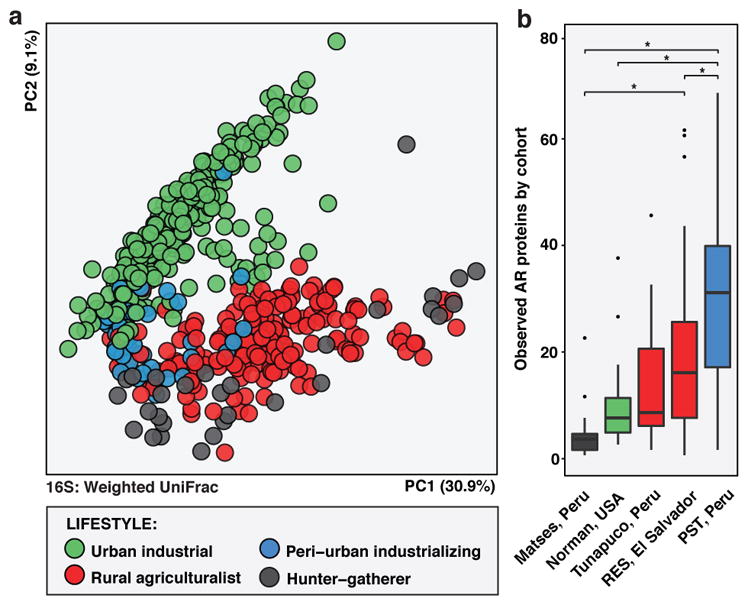
a, PCoA of weighted UniFrac distances between RES (n=60) and PST (n=46) microbiota and published human fecal microbiota from14,19,25 (n=446; see Supplementary Table 14), colored by host lifestyle. Adonis R2=15.4%, p<0.001. b, Number of AR proteins per person in RES (n=42) and PST (n=44) and 25 (n=53; see Supplementary Table 15). Error bars = s.d., center bars = median. *p<0.05, non-parametric Student’s t-tests, Bonferroni correction.
To evaluate whether AR burden correlated with industrialization14,26,27, we compared resistomes from RES and PST to industrialized USA, traditional hunter-gatherer, and rural agriculturalist communities from25, two of which are also Peruvian (Extended Data Figure 4A–F; see Methods). PST had the greatest number of AR proteins per person despite not being the most industrialized cohort analyzed (Figure 1B, Extended Data Figure 4G), consistent with Chinese and Hadza hunter-gatherer fecal microbiota harboring at least as much or more AR as Western industrialized microbiota11,22.
RES human and environmental microbiota
Frequent contact with environmental reservoirs during subsistence farming and inadequate excreta management28 likely promote AR exchange in rural settings. The RES community had only one source of filtered water, and contents of compositing latrines were used to fertilize household agricultural plots after attempted sterilization, potentially recycling AR. Accordingly, we compared the microbiomes and resistomes of RES human fecal samples and their surroundings, including latrines, animal feces, soils, and drinking water sources (see Methods).
The RES human fecal microbiota separated from soil and water along PC1 in a Principal Coordinate Analysis (PCoA) visualization of their phylogenetic composition, and habitats differed at the phylum level (Figure 2A, Extended Data Figure 5A; Supplementary Tables 6–10). Latrines were equidistant to human fecal microbiota and soil (weighted UniFrac, non-parametric Student’s t-tests with Bonferroni correction) and were enriched for Halomonadaceae, a family of halophilic organisms potentially selected by the alkaline latrine environment (Extended Data Figure 5B, Supplementary Discussion). Cow and dog fecal microbiota, which are ecologically similar to human fecal microbiota but with greater environmental exposure, were also intermediate along PC1. Soil and water were closest to each other (p<0.05, non-parametric Student’s t-tests with Bonferroni correction) and varied along PC3 (6.3% of variation). Human fecal microbiota were more homogenous in phylogenetic composition than latrine, soil, and water microbiota, potentially because environmental samples encountered more diverse and variable conditions.
Figure 2. Salvadoran rural agriculturalist (RES) human fecal and environmental microbiota and resistomes.

a,c,e, Phylogenetic composition (n = 60/6/36/84/22 for human/animal/latrine/soil/water). b,d,f, Resistome (n = 42/4/16/30/4 for human/animal/latrine/soil/water). a, PCoA of weighted UniFrac distances between microbiota. Adonis R2=43.2%, p<0.001. b, PCoA of Bray-Curtis distances between resistomes with abundance-weighted coordinates of the top five most discriminative AR categories enriched in human or non-human habitats (squares, size proportional to overall abundance). Adonis R2=26.6%, p<0.001. c-d, *p<0.05, non-parametric Student’s t-tests, Bonferroni correction. c, Faith’s phylogenetic diversity. d, Observed AR proteins. e-f, Percentage of latrine, soil, and water e, microbiota and f, resistomes attributable to human feces, as determined by SourceTracker29. *p<0.05, pairwise Wilcox tests, Bonferroni correction. Error bars = s.d., center bars = median.
The RES resistomes exhibited a similar ecological gradient (Bray-Curtis, Figure 2B). Although RES soil had the highest phylogenetic diversity (Figure 2C), it contained fewer AR proteins per sample than all habitats but water (Figure 2D). In contrast, human fecal microbiota had the lowest phylogenetic diversity, but more AR proteins per sample than both soil and water. However, soil and latrine resistomes were more heterogeneous than human and animal fecal resistomes. In particular, non-human RES resistomes were enriched in aminoglycoside nucleotidyltransferases, class D β-lactamases, SMR transporters, and resistant dihydropteroate synthetases and dihydrofolate reductases (Figure 2B, Extended Data Figure 5C–D; see Methods).
By analyzing RES habitats prone to exchange with human feces using SourceTracker29, we found that direct input from chicken feces represents a potent avenue for the introduction of AR genes compatible with the human fecal microbiota into soil (see Methods). The contribution of RES human fecal resistomes to environmental resistomes (Figure 2F) roughly recapitulated phylogenetic trends, with significantly higher input to latrines than soil or water (Figure 2E; see Supplement). Only the two soils collected adjacent to chicken coops had >1% human fecal resistome input. These two samples clustered away from the other samples along PC3 (5.3% of variation) and were closer to human samples along PC1 in the PCoA visualization of all RES samples (Figure 2A). Overall, RES human fecal microbiota were closer to soil collected near chicken coops than to any other soil location in both phylogenetic and AR composition (Bray-Curtis, non-parametric Student’s t-tests with Bonferroni correction). They shared 80 AR proteins at >99% identity, including three class C β-lactamases, which are common in Enterobacteriaceae, in contrast to two AR proteins shared between RES humans and soil from the pond edge. On average, human fecal and chicken coop soil resistomes shared 10 AR proteins, significantly more than with any other soil type (1–2 AR proteins, non-parametric Student’s t-tests with Bonferroni correction).
PST human and sewage microbiota
To monitor the impact of sewage treatment on resistomes, we sampled wastewater at street-level access points nearest to participating PST households and influent and effluent from the local WWTP and compared their phylogenetic composition and resistome to the fecal microbiota of PST residents (see Methods and Supplement). Portions of treated wastewater effluent are discharged into the Pacific Ocean and also used to irrigate public parks and agricultural fields, potentially enabling re-introduction of antibiotic residues and AR genes into human communities30–32.
Although geographically closest to human donors, street-access sewage was more similar in microbial composition to WWTP influent (non-parametric Student’s t-tests with Bonferroni correction, p<0.001), implying that even relatively brief periods in this non-human, aerobic environment caused a greater shift in bacterial composition than all changes downstream during transit through the sewage system. Overall, PST human waste underwent drastic changes in microbial composition as it progressed through sewage treatment, decreasing in similarity to human fecal microbiota at each subsequent stage (Student’s non-parametric t-tests with Bonferroni correction, p<0.001, weighted UniFrac; Figure 3A, Extended Data Figure 6A–B, Supplementary Table 11).
Figure 3. Peruvian peri-urban slum (PST) human fecal and sewage microbiota and resistomes.

a,c,e, Phylogenetic composition (n = 45/16/14/13 for human/street-access/influent/effluent). b,d,f, Resistome (n = 44/14/13/7 for human/street-access/influent/effluent). a, PCoA of weighted UniFrac distances between microbiota. Adonis R2=58.0%, p<0.001. b, PCoA of Bray-Curtis distances between resistomes with abundance-weighted coordinates of the top five most discriminative AR categories enriched in human or sewage habitats (squares, size proportional to overall abundance). Adonis R2=32.3%, p<0.001. c-d, *p<0.05, non-parametric Student’s t-tests, Bonferroni correction. c, Faith’s phylogenetic diversity. d, Observed AR proteins. e-f, Percentage of sewage e, microbiota and f, resistomes attributable to human feces at each sewage treatment stage, as determined by SourceTracker. *p<0.05, pairwise Wilcox tests, Bonferroni correction. Error bars = s.d., center bars = median.
Sewage resistomes also decreased in similarity to PST human fecal resistomes at each treatment stage, although street-access sewage and WWTP influent were equally similar to human feces in AR content (non-parametric Student’s t-tests with Bonferroni correction, Bray-Curtis; Figure 3B). Although WWTP effluent had the highest phylogenetic diversity (Figure 3C), it had the fewest AR proteins per sample (Figure 3D), as observed for soil in RES. In contrast, street-access sewage and WWTP influent had both higher phylogenetic diversity and more AR proteins per sample than PST human feces. Drug efflux AR mechanisms were higher overall in PST human fecal vs. sewage resistomes (p<0.05, pairwise Wilcox tests with Bonferroni correction; Figure 3B, Extended Data Figure 6C–D. In contrast, sewage was enriched for aminoglycoside acetyltransferases, class D β-lactamases, and resistant dihydrofolate reductases.
As expected, the human fecal contribution to WWTP effluent phylogenetic composition was lower than for street-access sewage or WWTP influent (p<0.05, pairwise Wilcox tests with Bonferroni correction; Figure 3E). Interestingly, this difference was not significant for resistomes, where human fecal input was high at all sewage treatment stages (p>0.05; Figure 3F). Thus, although sewage treatment was successful in reducing the overall carriage of AR genes as well as depleting human fecal microbes, AR genes of fecal origin survived and could be reintroduced into the natural environments where effluent is discharged.
Since the presence of antibiotics in sewage systems may influence resistome diversity and select for HGT, we used a modified solid phase extraction and mass spectrometry protocol33 to detect 16 antibiotics from seven classes in 22 WWTP influent and effluent samples. Chloramphenicol, ciprofloxacin, tetracycline, trimethoprim, and sulfamethoxazole were consistently detected in influent throughout the sampling period, while erythromycin was detected in 36% of influent samples. Only sulfamethoxazole was detected in effluent samples (concentrations of 18 – 26,000 ug/L−1) (Supplementary Table 12). Antibiotics detected in WWTP samples were among the highest selling antibiotics in Peru18 and may enrich for AR in these bacterial communities and in those exposed to effluent. However, no β-lactams were detected in any WWTP sample, despite the high abundance of β-lactam resistance genes found in our metagenomic surveys and amoxicillin being the highest-selling antibiotic in Peru18. This suggests that β-lactam antibiotics are degraded to undetectable levels in humans or the sanitation system before reaching the WWTP.
Highly cosmopolitan AR and HGT across microbiota
Although resistome and phylogenetic composition appear tightly linked in most microbial communities10,23, some clinically relevant AR proteins (e.g., TEM, CTX-M, KPC, AAC-6′) have been extremely successful in global dissemination via clonal expansion and HGT between multiple pathogen hosts34. We identified highly cosmopolitan AR proteins by comparing the prevalence of genes encoding them across all RES and PST habitats (Extended Data Figure 7A). Two proteins, including the sulfonamide-resistant dihydropteroate synthetase (DHPS) Sul2, were found in 50% of samples in six of seven habitats. On our functional metagenomic contigs, ten of the twelve DHPSs were >98% amino acid identical to Sul1, Sul2, or Sul3 and were co-localized with integrases and numerous other AR genes, suggesting multidrug-resistance integrons may facilitate their broad distribution in these settings35.
To further investigate AR exchange potential in RES and PST, we examined flanking genetic sequences in the contig assemblies from our functional selections for evidence of past HGT. 120 (11%) of our unique AR proteins were encoded in more than one genetic context (contigs with <90% local nucleotide identity; Extended Data Figure 7B), and the number of contexts was positively correlated with the number of metagenomic libraries (Spearman’s rho = 0.59, p<2.2x10⁻¹⁶) and habitats (Spearman’s rho = 0.47, p<2.2x10⁻¹⁶) in which an AR protein was encoded. One TEM β-lactamase (TEM-1) was encoded in 25 contexts (Figure 4A). In contrast, 41% of AR proteins found in multiple habitats were always encoded in the same genetic context. For instance, a TetX (a tetracycline-inactivating enzyme) variant was encoded in the same context in human and animal feces, latrines, and sewage influent. Three of the six AR proteins encoded by both human fecal and soil microbiota were encoded in the same genetic context (CblA and TEM class A β-lactamases and a class D β-lactamase).
Figure 4. AR proteins found in multiple habitats and genetic contexts in RES and PST.

a, Representative alignment of 5 of 25 contigs encoding a TEM-type β-lactamase at 99.9% nucleotide identity (full list of contigs in Methods). Contigs were annotated with Resfams v1.2. Source metagenomic libraries are indicated on the left. b, AR networks between human and environmental metagenomes in RES and PST. Small nodes (squares) represent unique AR proteins found in at least one sampled metagenome, colored by predicted resistance mechanism. Large nodes represent individual human/animal (circle) or environmental (triangle) metagenomes, colored by habitat/cohort. Lines connecting samples and AR proteins represent a ShortBRED hit with an RPKM (reads per kilobase per million reads) of ≥10, colored by mechanism.
We revealed a large network of AR gene sharing between microbial communities of human, animal, and environmental origin (Figure 4B), facilitated by HGT between bacterial genomes and spread of bacterial hosts across communities. To further assess the potential mobility of the AR genes found in our contigs, we identified putative mobile genetic elements (MGEs) and multidrug resistance clusters (MDRCs) by annotation (Supplementary Table 13; see Methods). There was a small but significant positive correlation between the proportion of AR contigs with an MGE or MDRC and the number of libraries and habitats in which the AR protein was encoded (Spearman’s rho = 0.11–0.17, p<4.3x10⁻⁴), which supports a role for MGEs and MDRCs in AR transfer across environments and increased accessibility to pathogens36. When ecological analyses were restricted to only AR genes adjacent to an MGE on one of our functional contigs, the results largely recapitulated the trends observed with the full AR set, with resistome correlating with phylogenetic composition across ecological habitats. Additionally, the RES human fecal contribution was reduced in soil compared to latrine resistomes, while the contribution of PST human feces to sewage was not significantly different before or after treatment (Supplementary Discussion, Extended Data Figure 8).
Conclusions
Our characterization of human fecal and environmental microbiota and their resistomes from two low-income settings in Latin America is particularly relevant to global public health. Billions of people currently live in rural or transitional areas around large urban centers, where unregulated access to antibiotics and limited access to clean water and improved sanitation increase the risk of pathogen transmission. Future studies on the factors that promote or restrict AR exchange between environmental microbiota, human commensals, and pathogens, particularly during waste treatment, are merited. These would involve real-time molecular surveillance of ‘high-risk’ environments (e.g., hospitals, large-scale animal feeding operations) to identify specific routes for the spread of resistant bacteria and AR genes and inform the design of public health interventions to decrease their global enrichment and dissemination.
Methods
Site and population overview
The community sampled in Lima (PST) is a ‘pueblo joven’ (or shantytown) built on the slopes of the desert hills ~15 miles southwest of Lima, Peru (Extended Data Figure 1A). The area was largely settled in the 1980s; the 2007 census recorded 56,915 inhabitants in an area of ~5 km2, a population density approximately four times higher than the rest of the Lima Metropolitan Area. Although accurate estimates of socioeconomic status were not available, the community is considered low income (although not uniformly) with an average family income of ~$130 per month. Although the majority of the households have access to electricity, water and sewage, many households in the poorer hilltop settlements still lack access to these services. Most households are now linked to a district-wide sewage system that funnels waste from PST and neighboring communities to the nearby ‘San Juan’ WWTP, one of 19 treatment plants serving the city of Lima. Sewage influent is collected in large aeration lagoons and subjected to stages of oxidation, settling, and chlorination in subsequent lagoons. Diarrheal diseases are common in this community, in particular among children, with an average of three episodes of diarrhea per year due to high prevalence of various bacterial, viral and protozoan infectious agents 37–39. Commonly used antibiotics are commonly purchased without prescription at the local pharmacies.
The rural Salvadoran village (RES) is home to approximately 100 people and is located in the mountains outside of San Salvador. Most individuals are subsistence farmers, although some are employed outside the village. They also participate in communal small-scale commercial enterprises, such as fish cultivation. Although the community has benefitted from infrastructure improvements, including prefabricated houses, drinking water is available only from a sand-filtered communal tap. Drinking water is stored in containers, and washing of dishes and clothing is primarily performed with unfiltered water or rainwater stored in outdoor barrels or reservoirs, which can be visibly contaminated with plant material. Each household has a double-vault composting latrine, a recommended method of waste disposal in low-income areas 40, but which was available to only ~14% of rural Salvadorans in 2013 41. Of the almost half (47%) of all people who live in rural areas worldwide42, 16% do not have drinking water sources protected from contamination with human excreta, and 50% lack sanitation facilities that separate excrement from human contact 28. Urine is diverted away from the latrine, and wood ash is added to the latrine compartment after each use to increase the internal pH. After the compartment is full, it is sealed off to allow heat, desiccation, and alkalinization to destroy fecal microbes. Sterilized waste is then spread onto household agricultural plots as fertilizer, but sterilization may be incomplete43. The village is a two-hour walk from the nearest primary health care center, but many antibiotics are available for purchase over-the-counter. Depending on the season (rainy or dry), villagers consume a combination of food grown in individual household plots and food purchased from the town. They primarily consume beans, as well as starches such as tortillas and rice, and rarely consume meat. Chickens and cows are the most common domestic animals.
Study design
In the Salvadoran village (RES), the study was explained to the community in a public forum at a preliminary visit, and all members of the community were invited to participate. In the Peruvian community (PST), ten households with a minimum of four members and one child <10 years old were randomly selected and invited to participate in the study. All individuals living in the same household were invited, but were not required, to participate. Written informed consent from each participant was obtained before asking survey questions or fecal sample collection. Both studies conform to the guidelines set forth in the Helsinki Declaration. Prior to initiation, the studies were reviewed and received approval from the National Ethics Committee of El Salvador (Comité Nacional de Ética para la Investigación, Acta #039-2012), the Institutional Review Board of Asociación Benéfica Prisma in Lima (Act CE0809.12), and The Washington University in St. Louis Institutional Review Board (IRB ID# 201301049/201206094).
After the initial collection in January 2013, human fecal samples from RES were collected one week, three weeks, and one year later. Human fecal samples from PST were collected between January and May 2012. We sampled 3.6 ± 2.0 individuals per house in RES and 5.7 ± 3.0 in PST. Household environmental samples (soil, water, latrine compartments, and animal feces from dogs, cows, chickens, guinea pigs) were collected with the permission of the residents. In RES, we sampled soils from washing areas adjacent to each house, adjacent to the latrine compartment where treated waste is removed, from urine-diverting tube exits, and where possible, from agricultural plots and chicken coops, as well as mud from the community pond’s edge. We also collected water from the piped source of sand-filtered drinking water, stored drinking water, wash water from outdoor storage barrels, reservoirs, and other containers, and the community pond and its inflow.
Sewage influent (pre-treatment) and effluent (post-treatment) samples from the wastewater treatment plant ‘PTAR San Juan’, located in the vicinity of PST, were collected in collaboration with Water and Sewage Authority of Lima (SEDAPAL). Twelve influent and effluent samples were collected between May 2012 and January 2013 to assess the stability of sewage communities over time. We collected influent and effluent from the districts of San Juan de Miraflores (SJM; which PST is part of) and Villa El Salvador (VES; a neighboring pueblo joven with similar demographic characteristics), which converge in this WWTP and serve a population of ~700,000.
RES demographic survey
In RES, a survey was administered to each study participant at the first three sample collections inquiring about household structure, occupation, diet, and medications, among other topics. Self-reported answers were used to determine participant age, household association, and frequency of travel outside the community, as well as latrine and animal ownership for each household.
DNA extraction
Samples were collected in sterile containers, immediately frozen, and stored at −20 to −80°C until shipment to Washington University in St. Louis, MO, where samples were stored at −80°C until DNA extraction. Metagenomic DNA was extracted from approximately 400 to 600 mg of each fecal and latrine sample with the phenol-chloroform bead-beating protocol described previously 44. Metagenomic DNA was extracted from soil and latrine samples with high ash content using MO BIO PowerSoil and PowerMax Soil DNA isolation kits. Water samples were filtered with sterile 0.22 μm filters, and metagenomic DNA was extracted from the filter membranes using the MO BIO PowerWater DNA isolation kit. For PST sewage influent and effluent, 50 ml of sample was centrifuged at 10,000 rpm for 10 minutes; pellets were resuspended in 0.5 ml PBS, transferred to microcentrifuge tubes, and metagenomic DNA was isolated using the phenol-chloroform extraction protocol used for fecal samples. Although extraction method does have an effect in metagenome studies, large differences in community composition (such as those found between different microbial habitats) have a greater influence on variation between samples 45.
Functional metagenomic selection
Small-insert shotgun expression libraries were created from metagenomic DNA in the vector pZE21 in E. coli DH10B as previously described 4,44. 68 libraries were created from 51 human fecal and 45 soil, latrine, sewage, and animal fecal metagenomes. Libraries were created for all human fecal samples (n = 20) and for soil, latrine, and cow fecal samples from two houses in RES (n = 14). House 4 was a family of four adults, and House 6 was a family of two adults and four children where one parent routinely worked outside of the community. Libraries were also created from latrine samples from four additional houses (n = 4). Six of the human fecal libraries, one soil library, and one animal fecal library from RES were each created from two pooled metagenomes from the same individual/location at different timepoints. Libraries were created from human (n = 31) and animal (n = 5) fecal samples from four houses in PST, as well as pooled sewage treatment plant influent and effluent. Metagenomic DNA from thirteen sewage influent and nine effluent samples were combined into a separate pool for each stage prior to library creation and selection because of low per-sample DNA yield.
Libraries were screened as previously described on Mueller-Hinton agar containing 50 μg/mL kanamycin and another antibiotic at concentrations inhibitory to E. coli DH10B harboring pZE21 without an insert (Supplementary Table 1). The surviving colonies for each selection were pooled. Metagenomic inserts from each pool were isolated via PCR with vector-specific primers, barcoded, and sequenced in parallel with the Illumina HiSeq 2000 (2x101bp or 2x150 reads). Reads were demultiplexed by barcode, assembled into contigs with PARFuMS 4, and annotated with Resfams v1.2 23.
A selection was excluded from analysis of antibiotic resistance if:
More than 100 contigs were assembled
The number of contigs assembled was more than ten times the number of colonies on the selection plate.
With these criteria, 16 out of 568 selections (2.8%) were excluded. Antibiotic resistance genes were identified by Resfam annotation (Supplementary Table 1). If a core, hand-curated, Resfam annotation specific to the antibiotic class was present on a contig, it was preferentially considered the causative resistance gene. Other Resfam annotations plausible for that antibiotic class were then identified from any contig that did not already contain a resistance gene. With this method, less-specific annotations such as efflux pumps were only identified as resistance genes if they were not co-localized with an antibiotic class-specific, canonical resistance gene.
Lipopolysaccharide modification is a conserved mechanism of antimicrobial peptide resistance in the phylum Bacteroidetes 46. In the colistin selections, 25 ORFs were annotated as “PAP2 superfamily” (PF01569.16) and shared 30.4 – 38.5% global amino acid identity with the Bacteroides thetaiotaomicron resistance gene lpxF (AAO76961.1) 46. These open reading frames (ORFs) were also considered antibiotic resistance.
To confirm the function of the ciprofloxacin resistance gene from library 01C_014, the plasmid was isolated from the resistant colony and reintroduced into a susceptible strain of E. coli, and the transformed cells were confirmed to grow in liquid and solid media containing 0.5 μg/ml ciprofloxacin at 48 and 72 hours after inoculation, which was not observed for the negative control. The insert was amplified from the plasmid via PCR and Sanger-sequenced from both ends of the pZE21 vector. The combined Sanger sequence was manually trimmed to remove vector sequence, and the resulting contig (1043 bp) was annotated with Resfams v1.2. The contig and its single ORF were included with the resistant contigs and ORFs identified by annotation above.
2075 AR ORFs were identified on 1955 contigs. The ORFs and the MetaGeneMark-generated protein sequences for each resistance ORF were each clustered at 100% identity over the entire length of the shorter sequence to identify identical sequences, collapsing to 1245 unique (100% nucleotide identical) ORFs and 1100 unique (100% amino acid identical) proteins. The contigs were clustered at 90% local identity (cd-hit-est parameters: -c 0.9 -d 0 -r 1 -G 0 -n 8 -uS 0.05 -aS 0.5) to identify different genetic surroundings.
Identification of top hits in NCBI nr
The MetaGeneMark-generated protein sequence for each ORF was compared to NCBI nr (accessed on 15th September, 2014) with blastp to identify the top local hit(s). A Needleman-Wunsch alignment was generated with EMBOSS needle for each protein and top hit (default parameters), and the global percent identity was calculated as the number of identities over the length of the shorter sequence.
Whole metagenome shotgun sequencing
Metagenomic DNA was sheared to 300–400bp, barcoded by sample, and sequenced on an Illumina HiSeq or NextSeq with 2x150bp paired reads. Reads were demultiplexed by barcode with no mismatches, retaining reads whose pair did not contain the same barcode as unpaired reads. Demultiplexed reads were trimmed with Trimmomatic-0.30 to remove Illumina adapter and low-quality bases (<Q13) from the ends, with default ILLUMINACLIP parameters and a minimum trimmed read length of 36 bases. Paired reads were trimmed in palindrome mode, while single reads were trimmed in simple mode. Human sequences were removed with DeconSeq by mapping to the human reference genome (GRCh38) 51. Any paired read whose pair was a human sequence was also removed. Samples with fewer than 1 million total reads (paired and unpaired) were excluded from further analysis. 85 of the 98 samples interrogated with functional metagenomics were shotgun sequenced.
Assembly of metagenomes from low-diversity metagenomes
Nine shotgun metagenomes from children <3 years old with 150 OTUs/sample or fewer based on 16S data (see below) were assembled using Velvet (Supplementary Table 3). VelvetOptimiser was run on each sample with hash values from 19 to 141 in steps of 2, with both paired and unpaired reads, using n50 as the optimization function. Assembled contigs were annotated with ResFams 23, and ORFs with core ResFams annotations were included in the ShortBRED markers.
Quantification of antibiotic resistance genes in metagenomes with ShortBRED
ShortBRED 24 was used to quantify the abundance of antibiotic resistance genes in the metagenomes. ShortBRED identifies unique marker sequences for clustered proteins that distinguish them from close homologs and maps reads to only those markers. This technique has greater accuracy than mapping to the entire protein, especially for AR genes, many of which evolved from genes performing non-resistance functions in the host.
ShortBRED markers were identified from the antibiotic resistance proteins (1) isolated from the functional selections performed in this study (2075) (2) identified from the human fecal metagenome assemblies in this study (132), (3) the Comprehensive Antibiotic Resistance Database (CARD) (downloaded October 20, 2014; 2972 proteins) 52, and (4) the Lahey β-lactamase database (http://www.lahey.org/studies/; 1145 proteins; one short protein, VEB-6, removed) 53 (Supplementary Table 4), clustered at 100% identity. The reference database was the modified version of the Integrated Microbial Genomes database, version 3.5., described in 24. ShortBRED produced 2275 markers when clustered at 100% identity (Supplementary Table 5) and 1266 markers when clustered at 90% identity. Unless noted, the 100% identity markers were used for all analyses.
7We quantified translated AR gene abundance in all metagenomes by mapping paired and unpaired fastq reads to the ShortBRED markers with 99% sequence identity. This extended our resistome investigation to individuals and sites not interrogated using functional metagenomics and to antibiotics that target Gram-positive bacteria (e.g., vancomycin, macrolides) and are not detectable in functional selections in our Gram-negative E. coli host 54. All analyses were performed on marker abundances normalized to reads per kilobase of per million reads (RPKM).
For AR proteins from the CARD and Lahey databases, metadata (resistance category, mechanism of action, antibiotic target(s)) was hand-curated from information available on the CARD website. For AR proteins identified through functional metagenomic selections and shotgun assemblies, resistance category and mechanism of action were assigned based on Resfams annotation. Antibiotic target(s) for the former were the antibiotics to which they conferred resistance in our functional selections, while the latter were not assigned an antibiotic target. Annotations for ShortBRED markers were drawn from all constituent proteins.
Comparison of human fecal resistomes to published cohorts
For comparison to the resistomes in 25, whole metagenome shotgun reads were downloaded from SRA (accession PRJNA268964). Fastq reads were trimmed with Trimmomatic in simple mode using the same parameters as for the RES and PST reads. Samples with fewer than 1 million total reads and individuals <3 years old were excluded. ShortBRED markers were quantified as above. For 25, the average read length of the paired reads for each sample was specified as the average read length during ShortBRED quantification. Only ShortBRED markers that included proteins from the CARD and Lahey databases were considered for this analysis to avoid bias towards our cohorts.
16S gene V4 amplification, sequencing, and preprocessing
The 16S gene V4 region (515–806) was amplified using the original Earth Microbiome Project (EMP) protocol (http://www.earthmicrobiome.org/emp-standard-protocols/16s/) or with Takara Taq DNA polymerase premix, with barcoded primers designed in 47, from 228 human fecal and 203 environmental samples. 245 samples interrogated by whole metagenome shotgun sequencing were also 16S sequenced. Barcoded amplicons were pooled and sequenced on an Illumina MiSeq with 2x250 bp paired-end reads.
Barcoded Illumina reads were demultiplexed with QIIME version 1.8.0, split_libraries_fastq.py 48. Paired reads were truncated at the first base with quality score ≤Q3 and merged using usearch 49, requiring 100% identity in the overlap region and a merged length of 253bp ± 5bp. Merged reads were filtered with QIIME to remove reads with three or more contiguous bases with quality score ≤Q20.
Open OTU picking with UPARSE for RES and PST comparisons
OTUs were picked from all 12,797,788 merged and filtered RES and PST reads with the UPARSE pipeline 50. Singletons were excluded from OTU picking, and a reference-based chimera check against the GOLD database (downloaded September 1, 2013) was performed on OTUs as recommended. Reads were assigned to OTUs at 97% identity using usearch. Representative sequences from each OTU were assigned taxonomy with uclust against the Greengenes database (release 13_8, 97% clusters), aligned, and used to create a phylogenetic tree using QIIME. 19301 OTUs were picked across all samples. Biom tables were rarefied to 7000 sequences per sample, which excluded eight samples.
Comparison of phylogenetic composition of human fecal samples to published cohorts
Raw 16S amplicons from 19 were downloaded from MG-RAST (accession number qiime:850). 16S amplicons from fecal samples from 14 were downloaded from the European Nucleotide Archive (ENA) (ERP008799). 16S amplicons from 25 were provided by the authors. For all studies, reads were generated with primers F515/R806 on an Illumina platform. We classified each cohort’s lifestyle as described in 25. Only samples from individuals 3 years or older were included in analysis. Individuals labeled with an adult-specific keyword (Family Member: “Mother”, “Father”, or Sample Identifier: “adlt”) in 19 Supplementary Table 2 were also included. Samples from 19 were rarefied to 50,000 reads each to reduce computational load. The merged reads from RES and PST human samples and the reads from 14 were truncated at 101bp.
OTUs were picked from all reads with the reference-based protocol described in 19 against the Greengenes database (13_8, 97% clusters). Reverse strand alignment was permitted, and new clusters were suppressed. The OTU table was rarefied to 5000 sequences per sample, which excluded two samples from 14.
Sample filters
To better characterize within- and between- sample diversity, we limited both the shotgun and 16S analysis to a single sample per human individual except where noted. Infant fecal microbiota undergo large and frequent shifts in microbial composition before stabilizing into an adult-like configuration around three years of age 19. Therefore, except where noted, we limited all analyses with human samples to those from individuals 3 years old or older.
Alpha diversity
For 16S, biom tables were rarefied ten times to 7000 sequences per sample, and equitability, observed species, and Faith’s phylogenetic distance were calculated on all rarefactions and averaged using the QIIME script alpha_diversity.py. For resistome, tables were not rarefied, and only the number of ARGs present in each sample was compared. Alpha diversity was compared between categories using non-parametric Student’s t-tests with 999 permutations at a depth of 7000 sequences per sample with Bonferroni correction for multiple hypothesis testing using the QIIME script compare_alpha_diversity.py. For Extended Data Figure 4G, the total AR RPKM for each sample was summed, multiplied by one million, and divided by the total number of reads for that sample to confirm that the results were robust to sequencing depth.
Beta diversity
Unweighted UniFrac, weighted UniFrac, Sørensen-Dice, and Bray-Curtis dissimilarity matrices were calculated from biom tables with the QIIME script beta_diversity.py, using the Greengenes 13_8 97% phylogenetic tree (for closed reference OTU picking) and the phylogenetic tree generated during de novo OTU picking for UniFrac distances. Principal coordinates analysis was performed with the QIIME script principal_coordinates.py.
ANOSIM and adonis analyses were performed on dissimilarity matrices with the QIIME script compare_categories.py or in R (vegan package functions anosim() and adonis()) with 999 permutations.
Distance to centroid was calculated in R with the vegan package function betadisper(), and significance was tested with a permutation test (permutest()).
Average pairwise dissimilarities between categories were compared with non-parametric Student’s t-tests with 999 Monte Carlo permutations with Bonferroni correction using code adapted from the QIIME script make_distance_boxplots.py. For shared AR proteins, the number of AR proteins shared between each pair of samples was calculated with shared_phylotypes.py, and significance was calculated as above.
Procrustes
The 16S OTU table rarefied to 7000 sequences/sample and the AR abundance table were both filtered to include only samples interrogated with both methods (172). Bray-Curtis dissimilarity matrices were calculated for both, principal coordinates analysis was performed, and procrustes analysis was performed on the PCoA results (QIIME script transform_coordinate_matrices.py) across 172 dimensions with 999 permutations to determine significance.
Identification of discriminatory taxa using LEfSe
Taxa summaries were created from the rarefied OTU table and filtered to levels L1 to L5 (kingdom - family). LEfSe 55 was used to identify taxa that were discriminative between categories. Alpha was 0.05 for both the Kruskal-Wallis and pairwise Wilcoxon rank-sum tests. The Linear Discriminant Analysis (LDA) effect size threshold was set at 3.0 or 4.0, and all-against-all comparison was performed.
Identification of discriminatory AR functions
The AR table was filtered to only AR proteins detected in the sample set under consideration and summarized by each metadata category with the QIIME script summarize_taxa.py. Absolute abundances rather than relative abundances were calculated, because AR genes represent a small fraction of the total metagenome. Supervised learning with the Random Forests classifier was performed to identify AR categories that most discriminated between sample categories (supervised_learning.py, 500 trees, and 10-fold cross-validation). The top discriminatory AR categories (as determined by feature importance scores) enriched in subsets of the samples were plotted onto the principal coordinates of all samples, using the abundance-weighted average for the coordinates. The size of the point is proportional to the overall abundance across all samples under consideration (1/100 RPKM).
SourceTracker
We estimated the proportion of each latrine, soil, and water microbiota attributable to RES human feces and the proportion of each sewage microbiota attributable to PST human feces using SourceTracker 29. AR tables were filtered to remove any samples and markers without any observations. SourceTracker was run through QIIME with default settings using human fecal microbiota as source. Jigger was introduced in boxplots to allow visualization, but some samples with very low abundance are not distinguishable.
Mass spectrometry-based detection of antibiotics in WWTP samples
Solid phase extraction and ultra performance liquid chromatography-tandem mass spectrometry (UPLC-MS/MS) were utilized to detect the presence of 16 antibiotics from 7 classes in 11 influent and 11 effluent samples supernatants using a modified protocol 33. Fifty ml of influent or effluent sample were centrifuged at 10,000 rpm for 10 minutes; supernatants were concentrated using solid phase extraction cartridges (6cc, 200 mg, Waters, Milford, MA). Samples were analyzed on a 4000 QTRAP LC/MS/MS instrument (AB Sciex). The data was normalized based on the internal standard (isotopically labeled caffeine, 13C3, Cambridge Isotope Laboratories) to account for experimental variation and antibiotic extraction/ionization efficiency. A mixture of the antibiotic standards was also processed along with the samples as positive controls to test for recovery. Standards for amoxicillin, cefotaxime, cefoxitin, chloramphenicol, ciprofloxacin, clindamycin, erythromycin, penicillin G, sulfamethoxazole, tetracycline, and trimethoprim were purchased from Sigma-Aldrich (St. Louis, MO). Standards for azithromycin, aztreonam, cefepime, doxycycline, and tigecycline were purchased from AK Scientific (Union City, CA). All analyses were performed at the Proteomics and Mass Spectrometry Facility at the Donald Danforth Plant Science Center (St. Louis, MO).
Network creation
AR gene networks were generated based on ShortBRED results of human and environmental metagenomes, filtering hits with RPKM value of <0.1 to determine sharing across samples. Graphics were generated in Cytoscape 3.2.1 using an edge-weighted spring-embedded layout.
Mobile genetic elements (MGEs)
Putative MGEs were identified from the functional selection contigs by Pfam and TIGRfam annotation (Supplementary Table 13). Antibiotic-resistant ORFs were considered co-localized with an MGE if they shared a contig with a MGE ORF. 365 (19%) AR contigs contained at least one of 236 unique MGEs (100% amino acid identical).
Multidrug resistance clusters
Multidrug resistance clusters were identified as contigs containing multiple AR proteins identified from our selections and/or annotated with a core Resfams profile HMM (18), regardless of the antibiotic used in the selection. 200 (10%) contigs contained multidrug resistance clusters.
Mobilome analysis
For “mobilome” analyses, the ShortBRED markers were restricted to those that included an AR protein encoded in our functional metagenomic selection contigs adjacent to a putative MGE.
Phylogenetic classification of contigs with PhyloPythia
Antibiotic-resistant contigs and metagenomic assembly contigs were classified by PhyloPythia 56,57 using the recommended model (800 genera, 2013).
Extended Data
Extended Data Figure 1.

Overview of study and methods.
a, Location and overview of study sites in El Salvador and Peru. RES photographs by Giordano Sosa-Soto and Melissa Mejía-Bautista, PST photographs by Pablo Tsukayama. b, AR markers and OTUs detected vs. number of samples interrogated by whole metagenome and 16S sequencing by habitat in RES and PST. c, Proportion of metagenomic libraries (n=67), all AR proteins identified from functional metagenomic selections (n=1100), and novel AR proteins identified from functional metagenomic selections (n=121) originating from each microbial habitat. The percent of total libraries/proteins in that category originating from each microbial habitat is listed above the bar. For all AR proteins and novel AR proteins, the total sums to >100% due to proteins identified in more than one habitat. The number of novel AR proteins vs. libraries screened was significantly different than expected compared to the total for human and latrines (Chi-squared test, p< 0.005).
Extended Data Figure 2.

Human fecal and environmental microbiota from RES and PST.
Microbiota are colored by habitat. a, PCoA of Bray-Curtis distances between resistomes. (n = 86/10/16/30/4/27/7 for human/animal/latrine/soil/water/pre-treatment sewage/post-treatment sewage) Adonis R2=22.4%, p< 0.001. b, PCoA of weighted UniFrac distances between microbiota. (n = 105/14/36/84/22/30/13 for human/animal/latrine/soil/water/pre-treatment sewage/post-treatment sewage) Adonis R2 = 41.9%, p<0.001. c, Procrustes transformation of taxonomic composition vs. resistome. Only samples interrogated with both methods were included (n=172). M2=0.360, p<0.001 (172 dimensions, 999 permutations).
Extended Data Figure 3.

Phylogenetic composition of RES and PST human fecal microbiota and published microbiota from previous studies 14,19,25.
a, b, e, f, RES vs. PST. (RES n = 60, PST n = 45) c, d, g, h, RES and PST vs. published human microbiota. (RES n = 60, PST n = 46, other n = 446; see Supplementary Table 14) a, PCoA of weighted UniFrac distances between RES and PST human fecal microbiota, colored by cohort. Adonis R2 = 29.7%, p < 0.001. b, Taxa discriminating between RES and PST human fecal microbiota as determined by LEfSe. The phylogenetic tree includes all kingdom- to family-level taxa present in any sample. Colored taxa are discriminative between cohorts and have an LDA effect size of ≥ 4.0; they are colored by the cohort in which they have the highest abundance. Circle size is relative to the highest abundance in either cohort. c, PCoA of weighted UniFrac distances between RES and PST human fecal microbiota and published human fecal microbiota, colored by cohort. Cohorts are labeled by lifestyle and study (*19, **35, ***14). Adonis R2 = 37.6%, p < 0.001. d, Taxa discriminating between host lifestyles for RES and PST and published human fecal microbiota as determined by LEfSe, effect size threshold 3.0. Discriminative taxa are colored by the host lifestyle in which they are most abundant. e-f, Relative abundances of microbial e, phyla and f, families in human fecal microbiota from RES and PST. * p<0.05, Wilcox test with Bonferroni correction. g-h, Relative abundances of microbial g, phyla and h, families in human fecal microbiota from RES and PST and published human fecal microbiota, by lifestyle. * p<0.05, Kruskal-Wallis test with Bonferroni correction. e-h, Only taxa with a mean relative abundance of ≥1% in one cohort/lifestyle are shown. Taxa are in order of increasing overall mean relative abundance. Error bars = s.d., center bars = median.
Extended Data Figure 4.

RES and PST human fecal resistomes and comparison to the published datasets from 25.
a-e, RES and PST resistomes, colored by cohort. (RES n = 42, PST n = 44) f-g, RES and PST vs. published human datasets, colored by cohort. (RES n = 42, PST n = 44, other n = 53; see Supplementary Table 15) a-c, Absolute abundances of AR a, categories, b, antibiotic targets, and c, mechanisms of action in human fecal resistomes from RES and PST. Only categories with a mean RPKM of >10 in one cohort are shown. Categories are in increasing order of overall mean absolute abundance. Abundances are plotted in log10 scale. *p<0.05, Wilcox test with Bonferroni correction. d, Number of AR proteins per RES and PST human fecal resistome. *p<0.05, non-parametric Student’s t-tests. e, PCoA of Bray-Curtis distances between RES and PST resistomes, with abundance-weighted coordinates of the top five most discriminative AR categories enriched in each cohort (squares, size proportional to overall abundance). Adonis R2=25.0%, p<0.001. f, PCoA of Bray-Curtis distances between human fecal resistomes from RES and PST and 25. Adonis R2=19.7%, p<0.001. g, Total reads mapping to AR markers per person (normalized by marker length) normalized by the total reads in that sample in RES and PST and published human fecal microbiota, by cohort. Includes both paired and unpaired reads. The overall distribution of normalized AR read depth was significantly different than expected (Kruskal-Wallis, p < 1 x 10⁻¹⁵). n.s., not significant. All other comparisons are p<0.05, Wilcox test with Bonferroni correction. a-d, f, Error bars = s.d., center bars = median.
Extended Data Figure 5.

RES human fecal and environmental microbiota and resistomes.
a-b, Relative abundances of microbial a, phyla and b, families in RES microbiota, by habitat. (n = 60/6/36/84/22 for human/animal/latrine/soil/water) Only taxa with a mean relative abundance of ≥1% in one habitat are shown. Taxa are in increasing order of overall mean relative abundance. * p<0.05, Kruskal-Wallis test with Bonferroni correction. c-d, Absolute abundances of AR c, categories and d, antibiotic targets in RES resistomes, by habitat. (n = 42/4/16/30/4 for human/animal/latrine/soil/water) Only categories with a mean RPKM of >10 in one habitat are shown. Categories are in increasing order of overall mean absolute abundance. Abundances are plotted in log10 scale. *p < 0.05, Kruskal-Wallis test with Bonferroni correction. a-d, Error bars = s.d., center bars = median.
Extended Data Figure 6.

PST human fecal and environmental microbiota and resistomes.
a-b, Relative abundances of microbial a, phyla and b, families in human fecal and sewage microbiota from PST, by stage. (n = 45/16/14/13 for human/street-access/influent/effluent) Only taxa with a mean relative abundance of ≥1% in one stage are shown. Taxa are in increasing order of overall mean relative abundance. * p<0.05, Kruskal-Wallis test with Bonferroni correction. c-d, Absolute abundances of AR c, categories and d, antibiotic targets in PST resistomes, by stage. (n = 44/14/13/7 for human/street-access/influent/effluent) Only categories with a mean RPKM of >10 in one stage are shown. Categories are in increasing order of overall mean absolute abundance. Abundances are plotted in log10 scale. * p<0.05, Kruskal-Wallis test with Bonferroni correction. a-d, Error bars = s.d., center bars = median.
Extended Data Figure 7.

AR gene sharing across habitats.
a, Highly cosmopolitan AR proteins. The prevalence of each AR protein in metagenomes from each microbial habitat is depicted for all proteins detected in six of the seven habitats (n=21). Detection was based on ShortBRED quantification of the protein in each metagenome. Prevalences for an AR protein are linked by lines of the same color. The shape of each point reflects the number of habitats in which it was found, as well as the minimum prevalence within each habitat. The legend lists the annotation for each protein. b, Protein sequences of AR genes isolated from functional metagenomic selections were clustered at 100% amino acid identity, and the number of metagenomic libraries, microbial habitats (e.g., human fecal, soil), and cohorts in which each unique protein (n=1100) was encoded were calculated across all members of the cluster. AR contigs (n = 1955) were clustered at 90% local identity to identify different genetic contexts, and the number of genetic contexts in which each unique protein was encoded was calculated across all contigs encoding a protein in that cluster. Spearman’s rho = 0.59, p < 2.2 x 10⁻¹⁶, number of genetic contexts vs. libraries; rho = 0.47, p < 2.2 x 10⁻¹⁶, number of genetic contexts vs. habitats; Wilcox test, p < 2.2 x 10⁻¹⁶, number of genetic contexts vs. cohorts (one or both).
Extended Data Figure 8.

Mobilome analyses.
a, PCoA of Bray-Curtis distances between RES and PST human and environmental resistomes, colored by habitat. (n = 86/10/16/30/4/27/7 for human/animal/latrine/soil/water/pre-treatment sewage/post-treatment sewage) Adonis R2=24.1%, p < 0.001. b, Procrustes transformation of taxonomic composition vs. resistome. Only samples interrogated with both methods were included (n=172). M2=0.493, p<0.001 (172 dimensions, 999 permutations). c, PCoA of Bray-Curtis distances between RES (n = 42) and PST (n = 44) resistomes, colored by cohort. Adonis R2=31.0%, p<0.001. d-f, RES human fecal and environmental microbiota and resistomes, colored by habitat. (n = 42/4/16/30/4 for human/animal/latrine/soil/water). d, PCoA of Bray-Curtis distances between resistomes. Adonis R2=32.0%, p<0.001. e, Observed AR proteins. * p<0.05, non-parametric Student’s t-tests, Bonferroni correction. f, Percentage of latrine, soil, and water resistomes attributable to human feces, as determined by SourceTracker29. * p<0.05, pairwise Wilcox tests, Bonferroni correction. g-i, PST human fecal and sewage microbiota and resistomes, colored by stage. (n = 44/14/13/7 for human/street-access/influent/effluent). g, PCoA of Bray-Curtis distances between resistomes. Adonis R2=34.8%, p<0.001. h, Observed AR proteins. * p<0.05, non-parametric Student’s t-tests, Bonferroni correction. i, Percentage of sewage resistomes attributable to human feces at each sewage treatment stage, as determined by SourceTracker. * p<0.05, pairwise Wilcox tests, Bonferroni correction. Error bars = s.d., center bars = median.
Supplementary Material
Acknowledgments
We thank the residents of our study communities in El Salvador and Peru for their generosity and trust, without which this study would not have been possible; Epilogos Charities, Inc. for on-site logistical support and community networking; the Fundación Luis Edmundo Vásquez (FUNDALEV), Universidad Dr. José Matías Delgado, Asociación Benéfica Prisma, and Universidad Peruana Cayetano Heredia for logistical support in the collection and shipment of samples; Dr. Sofia del Pilar Basilio at SEDAPAL in Lima for facilitating access and sample collection at the ‘PTAR San Juan’ WWTP; Jessica Hoisington-Lopez at the Center for Genome Sciences and Systems Biology and staff at the Genome Technology Access Center at Washington University School of Medicine (St. Louis, MO) for generating Illumina sequencing data; Sophie Alvarez and staff at the Proteomics & Mass Spectrometry Facility at the Donald Danforth Plant Science Center (DDPSC, St. Louis, MO) for mass-spectrometry analyses of water samples; and members of the Dantas lab for thoughtful discussions of the results and analyses. This work is supported in part by awards to G.D. through the Edward Mallinckrodt, Jr. Foundation (Scholar Award), the Children’s Discovery Institute (MD-II-2011-117), and the National Institute of General Medical Sciences of the National Institutes of Health (R01-GM099538). Work at the DDPSC was supported by the National Science Foundation (DBI-0521250) for acquisition of the QTRAP LC-MS/MS instrument. E.C.P. is funded by the Department of Defense (DoD) through the National Defense Science and Engineering Graduate (NDSEG) Fellowship. The content is solely the responsibility of the authors and does not necessarily represent the official views of the funding agencies.
Footnotes
Supplementary Information is linked to the online version of the paper at www.nature.com/nature.
Assembled functional metagenomic contigs and 16S and shotgun metagenomic reads have been deposited to NCBI GenBank and SRA (PRJNA300541).
The authors declare that they have no competing financial interests.
Author Contributions: D.E.B., G.D., M.T.B., and E.C.P. planned the RES study; D.E.B., G.D., R.H.G., and P.T. planned the PST study; M.T.B. and W.H.A. implemented the RES study approval in El Salvador; E.C.P implemented the RES study approval in the US; R.H.G. and L.C. implemented the PST study approval in Peru; P.T. implemented the PST study approval in the US; M.T.B., W.H.A., K.M.N., M.M.B., G.S.S., and E.C.P. collected surveys and samples in RES; P.T., M.C., and L.C. collected samples in PST; E.C.P., M.M.B., G.S.S., and S.P. extracted DNA and generated 16S, functional metagenomic, and shotgun data for RES samples; P.T. and S.P. extracted DNA and generated 16S, functional metagenomic, and shotgun data for PST samples; E.C.P. and P.T. performed analyses and interpreted results; and E.C.P., P.T., and G.D. wrote the paper with input from other co-authors.
References
- 1.Antimicrobial Resistance: Global Report on Surveillance. 1. World Health Organization; 2014. [Google Scholar]
- 2.Centers for Disease Control and Prevention. Antibiotic Resistance Threats in the United States, 2013. 2013. [Google Scholar]
- 3.The Review on Antimicrobial Resistance, C. b. J. O. N. Review on Antimicrobial Resistance. Antimicrobial Resistance: Tackling a Crisis for the Health and Wealth of Nations. 2014;2014 [Google Scholar]
- 4.Forsberg KJ, et al. The shared antibiotic resistome of soil bacteria and human pathogens. Science. 2012;337:1107–1111. doi: 10.1126/science.1220761. [DOI] [PMC free article] [PubMed] [Google Scholar]
- 5.Allen HK, et al. Call of the wild: antibiotic resistance genes in natural environments. Nat Rev Microbiol. 2010;8:251–259. doi: 10.1038/nrmicro2312. [DOI] [PubMed] [Google Scholar]
- 6.Martinez JL. The role of natural environments in the evolution of resistance traits in pathogenic bacteria. Proceedings Biological sciences/The Royal Society. 2009;276:2521–2530. doi: 10.1098/rspb.2009.0320. [DOI] [PMC free article] [PubMed] [Google Scholar]
- 7.Wright GD. The antibiotic resistome: the nexus of chemical and genetic diversity. Nat Rev Microbiol. 2007;5:175–186. doi: 10.1038/nrmicro1614. [DOI] [PubMed] [Google Scholar]
- 8.D’Costa VM, et al. Antibiotic resistance is ancient. Nature. 2011;477:457–461. doi: 10.1038/nature10388. [DOI] [PubMed] [Google Scholar]
- 9.Allen HK, Moe LA, Rodbumrer J, Gaarder A, Handelsman J. Functional metagenomics reveals diverse beta-lactamases in a remote Alaskan soil. The ISME journal. 2009;3:243–251. doi: 10.1038/ismej.2008.86. [DOI] [PubMed] [Google Scholar]
- 10.Forsberg KJ, et al. Bacterial phylogeny structures soil resistomes across habitats. Nature. 2014;509:612–616. doi: 10.1038/nature13377. [DOI] [PMC free article] [PubMed] [Google Scholar]
- 11.Hu Y, et al. Metagenome-wide analysis of antibiotic resistance genes in a large cohort of human gut microbiota. Nature communications. 2013;4:2151. doi: 10.1038/ncomms3151. [DOI] [PubMed] [Google Scholar]
- 12.Li B, et al. Metagenomic and network analysis reveal wide distribution and co-occurrence of environmental antibiotic resistance genes. The ISME journal. 2015;9:2490–2502. doi: 10.1038/ismej.2015.59. [DOI] [PMC free article] [PubMed] [Google Scholar]
- 13.Smillie CS, et al. Ecology drives a global network of gene exchange connecting the human microbiome. Nature. 2011;480:241–244. doi: 10.1038/nature10571. [DOI] [PubMed] [Google Scholar]
- 14.Clemente JC, et al. The microbiome of uncontacted Amerindians. Science Advances. 2015;1 doi: 10.1126/sciadv.1500183. [DOI] [PMC free article] [PubMed] [Google Scholar]
- 15.The World Bank Group. Data: Countries: High Income. 2015 < http://data.worldbank.org/income-level/HIC>.
- 16.World Health Organization. Global Health Observatory (GHO) data: Urban Health. 2015 < http://www.who.int/gho/urban_health/en/>.
- 17.Okeke IN, et al. Antimicrobial resistance in developing countries. Part I: recent trends and current status. The Lancet Infectious Diseases. 2005;5:481–493. doi: 10.1016/s1473-3099(05)70189-4. [DOI] [PubMed] [Google Scholar]
- 18.Van Boeckel TP, et al. Global antibiotic consumption 2000 to 2010: an analysis of national pharmaceutical sales data. The Lancet Infectious Diseases. 2014;14:742–750. doi: 10.1016/s1473-3099(14)70780-7. [DOI] [PubMed] [Google Scholar]
- 19.Yatsunenko T, et al. Human gut microbiome viewed across age and geography. Nature. 2012;486:222–227. doi: 10.1038/nature11053. [DOI] [PMC free article] [PubMed] [Google Scholar]
- 20.Handelsman J, Rondon MR, Brady SF, Clardy J, Goodman RM. Molecular biological access to the chemistry of unknown soil microbes a new frontier for natural products. Chemistry & Biology. 1998;5:R245–249. doi: 10.1016/s1074-5521(98)90108-9. [DOI] [PubMed] [Google Scholar]
- 21.Sommer MO, Dantas G, Church GM. Functional characterization of the antibiotic resistance reservoir in the human microflora. Science. 2009;325:1128–1131. doi: 10.1126/science.1176950. [DOI] [PMC free article] [PubMed] [Google Scholar]
- 22.Rampelli S, et al. Metagenome Sequencing of the Hadza Hunter-Gatherer Gut Microbiota. Current biology : CB. 2015;25:1682–1693. doi: 10.1016/j.cub.2015.04.055. [DOI] [PubMed] [Google Scholar]
- 23.Gibson MK, Forsberg KJ, Dantas G. Improved annotation of antibiotic resistance determinants reveals microbial resistomes cluster by ecology. The ISME journal. 2014 doi: 10.1038/ismej.2014.106. [DOI] [PMC free article] [PubMed] [Google Scholar]
- 24.Kaminski J, et al. Fast and Accurate Metagenomic Search with ShortBRED. PLoS Computational Biology. 2015 [Google Scholar]
- 25.Obregon-Tito AJ, et al. Subsistence strategies in traditional societies distinguish gut microbiomes. Nature communications. 2015;6:6505. doi: 10.1038/ncomms7505. [DOI] [PMC free article] [PubMed] [Google Scholar]
- 26.Walson JL, Marshall B, Pokhrel BM, Kafle KK, Levy SB. Carriage of antibiotic-resistant fecal bacteria in Nepal reflects proximity to Kathmandu. The Journal of Infectious Diseases. 2001;184:1163–1169. doi: 10.1086/323647. [DOI] [PubMed] [Google Scholar]
- 27.Pallecchi L, et al. Quinolone resistance in absence of selective pressure: the experience of a very remote community in the Amazon forest. PLoS Negl Trop Dis. 2012;6:e1790. doi: 10.1371/journal.pntd.0001790. [DOI] [PMC free article] [PubMed] [Google Scholar]
- 28.Nations, U. The Millennium Development Goals Report 2015. 2015. [Google Scholar]
- 29.Knights D, et al. Bayesian community-wide culture-independent microbial source tracking. Nature methods. 2011;8:761–763. doi: 10.1038/nmeth.1650. [DOI] [PMC free article] [PubMed] [Google Scholar]
- 30.Stalder T, et al. Quantitative and qualitative impact of hospital effluent on dissemination of the integron pool. ISME J. 2013 doi: 10.1038/ismej.2013.189. [DOI] [PMC free article] [PubMed] [Google Scholar]
- 31.Baquero F, Martinez JL, Canton R. Antibiotics and antibiotic resistance in water environments. Curr Opin Biotechnol. 2008;19:260–265. doi: 10.1016/j.copbio.2008.05.006. [DOI] [PubMed] [Google Scholar]
- 32.Munck C, et al. Limited dissemination of the wastewater treatment plant core resistome. Nature communications. 2015;6:8452. doi: 10.1038/ncomms9452. [DOI] [PMC free article] [PubMed] [Google Scholar]
- 33.Li B, Zhang T, Xu Z, Fang HH. Rapid analysis of 21 antibiotics of multiple classes in municipal wastewater using ultra performance liquid chromatography-tandem mass spectrometry. Anal Chim Acta. 2009;645:64–72. doi: 10.1016/j.aca.2009.04.042. [DOI] [PubMed] [Google Scholar]
- 34.Hawkey P, Jones A. The changing epidemiology of resistance. J Antimicrob Chemother. 2009;64:i3–10. doi: 10.1093/jac/dkp256. [DOI] [PubMed] [Google Scholar]
- 35.Huovinen P, Sundstrom L, Swedberg G, Skold O. Trimethoprim and sulfonamide resistance. Antimicrobial Agents and Chemotherapy. 1995;39:279–289. doi: 10.1128/aac.39.2.279. [DOI] [PMC free article] [PubMed] [Google Scholar]
- 36.Martinez JL, Coque TM, Baquero F. What is a resistance gene? Ranking risk in resistomes. Nat Rev Microbiol. 2015;13:116–123. doi: 10.1038/nrmicro3399. [DOI] [PubMed] [Google Scholar]
- 37.Checkley W, et al. Effect of water and sanitation on childhood health in a poor Peruvian peri-urban community. Lancet. 2004;363:112–118. doi: 10.1016/S0140-6736(03)15261-0. [DOI] [PubMed] [Google Scholar]
- 38.Cooper MS, Gilman CRR, Cama V, Ortega Y, Adam R. Molecular analysis of household transmission of Giardia lamblia in a region of high endemicity in Peru. J Infect Dis. 2010;202:1713–1721. doi: 10.1086/657142. [DOI] [PMC free article] [PubMed] [Google Scholar]
- 39.Oswald W, et al. Fecal contamination of drinking water within peri-urban households, Lima, Peru. Am J Trop Med Hyg. 2007;77:699–704. [PubMed] [Google Scholar]
- 40.Water S Health Unit, World Health Organization. 2002 < http://www.who.int/water_sanitation_health/sanitproblems/en/index4.html>.
- 41.WHO/UNICEF Joint Monitoring Programme (JMP) for Water Supply and Sanitation. El Salvador: estimates on the use of water sources and sanitation facilities (1980 – 2015) 2015. [Google Scholar]
- 42.The World Bank Group. Data: Topics: Urban Development. 2015 < http://data.worldbank.org/topic/urban-development>.
- 43.Corrales LF, Izurieta R, Moe CL. Association between intestinal parasitic infections and type of sanitation system in rural El Salvador. Tropical medicine & international health : TM & IH. 2006;11:1821–1831. doi: 10.1111/j.1365-3156.2006.01737.x. [DOI] [PubMed] [Google Scholar]
- 44.Moore AM, et al. Pediatric Fecal Microbiota Harbor Diverse and Novel Antibiotic Resistance Genes. PloS one. 2013;8:e78822. doi: 10.1371/journal.pone.0078822.t001. [DOI] [PMC free article] [PubMed] [Google Scholar]
- 45.Lozupone CA, et al. Meta-analyses of studies of the human microbiota. Genome research. 2013;23:1704–1714. doi: 10.1101/gr.151803.112. [DOI] [PMC free article] [PubMed] [Google Scholar]
- 46.Cullen TW, et al. Antimicrobial peptide resistance mediates resilience of prominent gut commensals during inflammation. Science. 2015;347:170–175. doi: 10.1126/science.1260580. [DOI] [PMC free article] [PubMed] [Google Scholar]
- 47.Caporaso JG, et al. Ultra-high-throughput microbial community analysis on the Illumina HiSeq and MiSeq platforms. The ISME journal. 2012;6:1621–1624. doi: 10.1038/ismej.2012.8. [DOI] [PMC free article] [PubMed] [Google Scholar]
- 48.Caporaso JG, et al. QIIME allows analysis of high- throughput community sequencing data. Nature methods. 2010;7:335–336. doi: 10.1038/nmeth.f.303. [DOI] [PMC free article] [PubMed] [Google Scholar]
- 49.Edgar RC. Search and clustering orders of magnitude faster than BLAST. Bioinformatics. 2010;26:2460–2461. doi: 10.1093/bioinformatics/btq461. [DOI] [PubMed] [Google Scholar]
- 50.Edgar RC. UPARSE: highly accurate OTU sequences from microbial amplicon reads. Nature methods. 2013;10:996–998. doi: 10.1038/nmeth.2604. [DOI] [PubMed] [Google Scholar]
- 51.Schmieder R, Edwards R. Fast Identification and Removal of Sequence Contamination from Genomic and Metagenomic Datasets. PloS one. 2011;6 doi: 10.1371/journal.pone.0017288. [DOI] [PMC free article] [PubMed] [Google Scholar]
- 52.McArthur AG, et al. The comprehensive antibiotic resistance database. Antimicrob Agents Chemother. 2013;57:3348–3357. doi: 10.1128/AAC.00419-13. [DOI] [PMC free article] [PubMed] [Google Scholar]
- 53.Bush K, Palzkill T, Jacoby G. Lahey Clinic. 2015. [Google Scholar]
- 54.Pehrsson EC, Forsberg KJ, Gibson MK, Ahmadi S, Dantas G. Novel resistance functions uncovered using functional metagenomic investigations of resistance reservoirs. Frontiers in microbiology. 2013;4:145. doi: 10.3389/fmicb.2013.00145. [DOI] [PMC free article] [PubMed] [Google Scholar]
- 55.Segata N, et al. Metagenomic biomarker discovery and explanation. Genome Biol. 2011;12:R60. doi: 10.1186/gb-2011-12-6-r60. [DOI] [PMC free article] [PubMed] [Google Scholar]
- 56.McHardy AC, Martin HG, Tsirigos A, Hugenholtz P, Rigoutsos I. Accurate phylogenetic classification of variable-length DNA fragments. Nature methods. 2007;4:63–72. doi: 10.1038/nmeth976. [DOI] [PubMed] [Google Scholar]
- 57.Patil KR, Roune L, McHardy AC. The PhyloPythiaS web server for taxonomic assignment of metagenome sequences. PloS one. 2012;7:e38581. doi: 10.1371/journal.pone.0038581. [DOI] [PMC free article] [PubMed] [Google Scholar]
Associated Data
This section collects any data citations, data availability statements, or supplementary materials included in this article.