

Abstract
Objective
To compare the liver segmental volume ratio (LSVR), a novel volumetric CT measurement, with established linear measurements for differentiating normal from cirrhotic livers.
Methods
Hepatic volumes were measured using semi-automated software (Liver Analysis application, Philips IntelliSpace Portal) on contrast-enhanced abdominal CT scans in 312 adults, including 108 patients with end-stage liver disease (ESLD; mean age, 55 years; 63M/45F) and 204 healthy controls (potential renal donors; mean age, 46 years; 82M/122F). The LSVR was defined as the volume ratio of Couinaud segments I–III to segments IV–VIII. Linear measures included the caudate-to-right lobe (CRL) ratio and maximal splenic dimension.
Results
Differences in LSVR between cirrhotics and controls were highly significant (p<0.0001; mean, 0.55±0.29 versus 0.27±0.07; ROC AUC=0.916). Linear CRL ratio differences were not statistically significant between the two cohorts (p=0.051; ROC AUC=0.567). Total liver volume was ineffective for discrimination (ROC AUC=0.598). An LSVR threshold ≥0.35 had a sensitivity and specificity for cirrhosis of 81.5% and 88.7%, respectively.
Conclusion
Regional hepatic volume changes, as reflected by the LSVR, are more effective than standard linear measures or total liver volume for differentiating cirrhotic from normal livers.
Keywords: Liver, Cirrhosis, Volumetrics, CT, Volume analysis
Introduction
Cirrhosis represents the final common pathway of end-stage hepatic parenchymal injury, characterized by extensive fibrosis and nodular regeneration. Liver biopsy has long served as the “gold standard” for the detection and staging of liver fibrosis but, largely due to sampling error, this invasive and expensive procedure can lead to errors in diagnosis in up to one-third of cases.1 MR and US elastography can non-invasively detect and stage liver fibrosis on the basis of increased parenchymal stiffness,2–4 although considerable overlap may exists between grades and with inflammatory conditions such as steatohepatitis.5, 6
More globally, the morphologic changes associated with cirrhosis have long been recognized at cross-sectional imaging.7, 8 Specifically, liver parenchymal volume loss involving Couinaud segments IV–VIII (ie, the left medial segment and right hepatic lobe), is often associated with compensatory enlargement of segments I–III (ie, the caudate and left lateral segment). Linear measures, most notably the caudate-to-right-lobe (CRL) ratio, have been applied to cross-sectional images in an attempt to quantify these changes, with some success.9–11 However, this linear ratio fails to account for the common relevant changes in the left lateral segment (II and III) and the caudate process (processus caudatus hepatis) that extends medially from the cava. Linear assessment also oversimplifies the complex 3D volumetric changes occurring in the liver, which are subjectively apparent at visual inspection of CT and MR images. Previous studies looking at various components of hepatic volumetric changes have shown some promise.8, 12–15 In addition, splenic enlargement can serve as an indicator of portal hypertension complicating liver cirrhosis, further enhancing assessment.14–16
Recent improvements in advanced visualization software tools that effectively segment the liver have greatly streamlined the process of accurate volumetric assessment. To best accentuate the morphologic volume changes typical of end-stage liver disease (ESLD), we propose a volumetric ratio that compares Couinaud segments I–III in the numerator to segments IV–VIII in the denominator, which we refer to as the “liver segmental volume ratio” or LSVR. The purpose of this study was to compare this and other volumetric CT measurements of the liver and spleen with established linear measurements for differentiating normal from cirrhotic livers. This proof of concept study to assess the feasibility and accuracy of the LSVR focused on the two ends of the spectrum (ie, normal versus cirrhotic patients) to establish the initial validity of this measure.
Material and Methods
This HIPAA-compliant retrospective study was approved by our institutional review board; the need for signed informed consent was waived.
Patient Population
Two distinct consecutive patient cohorts undergoing multiphasic contrast-enhanced abdominal CT were identified: 1) the primary study group (n=108) consisting of patients with end-stage liver disease undergoing pre-transplant work-up (mean age, 55 years; 63 men, 45 women), and 2) healthy controls (n=204) consisting of potential renal donors undergoing pre-operative imaging evaluation (mean age, 46 years; 82 men, 122 women). Multiphasic CT scans for the ESLD cohort were obtained between January 2011 and May 2013; CT scans for the control group were performed between March 2012 and May 2013. For the cirrhotic group, consecutive triphasic pre-transplant CT scans during the described time period were utilized. Patients who underwent CT had known cirrhosis, were being evaluated for liver transplant and had both clinically compensated and decompensated. Mean MELD score was 15.6±6.8 (median 13, range 7–40). Patients with tumors or prior tumor treatment including resection or locoregional therapy, which may have caused treatment-related atrophy or altered morphology were excluded. The primary etiologies for ESLD were alcoholism (n=45), hepatitis C virus (HCV) (n=32), Nonalcoholic fatty liver disease (NAFLD) (n=16), primary sclerosing cholangitis (PSC) (n=4), primary biliary cirrhosis (PBC) (n=3), cryptogenic (n=3), hepatitis B virus (HBV) (n=1), autoimmune hepatitis (n=1), alpha-1 antitrypsin deficiency (n=1), amyloidosis (n=1), and isoniazid hepatotoxicity (n=1). Secondary complicating factors in some patients included alcohol (n=15), NAFLD (n=3), and HCV (n=2).
MDCT technique
All CT exams were acquired on 16 or 64-detector-row scanners (GE Healthcare) with multiphasic post-contrast technique. For pre-transplant evaluation in ESLD patients, a triphasic examination includes early arterial, late arterial, and portal venous phases. For the renal donor protocol, late arterial and portal venous phases are acquired. For the volumetric and linear analysis of the liver and spleen described below, the portal venous phase of contrast enhancement was employed. These series were reconstructed with 5-mm slice thickness at 3-mm intervals. Scan parameters are based on patient size as determined by measurements on AP/lateral scouts (small, medium, large) and kV values as well as FOV are the same across the two protocols for patients that are the same size. Smart mA is utilized for both protocols.
Quantitative Morphologic Liver Analysis at CT
All morphologic liver analysis was performed on a dedicated state-of-the-art CT software tool (Liver Analysis application, Philips IntelliSpace Portal). This package provides automated segmentation of the liver, including individual Couinaud segments if desired, as well as isolation of the hepatic vasculature. For the purpose of this study, we included the intrahepatic vessels in the volume assessment to assure uniformity, as the degree of vascular segmentation can vary widely. All extrahepatic structures were excluded from volumetric assessment.
After the initial automated segmentation of the entire liver by the software, the margins were verified and easily manipulated if needed with adjustable digital brush and eraser tools to add and subtract tissue volume, respectively. At this point, the total liver volume was recorded (Figure 1). Subsequently, Couinaud segments I–III were isolated from segments IV–VIII to determine the separate volumes of each component (Figure 1). The falciform ligament provides a reliable landmark for separating the left lateral liver (Couinaud segments II and III) from the left medial segment (IV) inferiorly, and this plane is then extended superiorly and posteriorly towards the IVC to complete the division, as in surgical resection. Proper segmentation of the caudate requires knowledge of its somewhat more complex anatomy, consisting of the Spiegel lobe, the paracaval portion, and the caudate process.17 Awareness of the caudate process (processus caudatus hepatis) is particularly important in the setting of cirrhosis, as enlargement of this portion may extend well to the right of the cava and into the right hepatic lobe (Figure 1). In some cases of cirrhosis, bulging mass effect of the caudate process and subtle attenuation differences with the adjacent shrunken right lobe may be apparent (Figure 1), but in other cases the true caudate size may be underestimated. Measurements were made by a trained medical student and supervised by one of two abdominal radiologists (10 and 20 years of experience, respectively). After recording the volumes of segments I–III and IV–VIII, the separate volumes of the caudate (I) and left lateral segment (II and III) were determined by their separation via the fissure for the ligamentum venosum. Finally, the spleen was segmented for volume determination in a straightforward automated step that typically required little or no border modification.
Figure 1. CT examples of a normal control and cirrhotic patient.
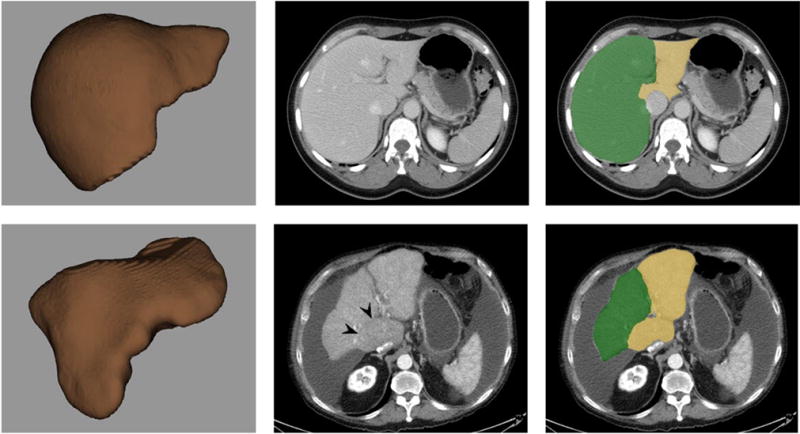
Top row A–C (normal): 3D volume-rendered CT image of segmented total liver (top left, A) shows normal morphology. Post-contrast transverse CT images without (top middle, B) and with (top right, C) segmentation show a typical normal relationship between Couinaud segments IV–VIII (green) and segments I–III (yellow). For this case, LSVR =0.13, CRL ratio =0.80, splenic volume =237 cm3, and maximal splenic diameter =10.8 cm.
Bottom row D–F (cirrhosis): 3D volume-rendered CT image of segmented total liver (bottom left, D), post-contrast transverse CT image without segmentation (bottom middle, E), and CT with segmentation (bottom right, F) show an irregular hepatic morphology. Note volume loss in segments IV–VIII (green) and relative hypertrophy of segments I–III (yellow), including a prominent caudate process bulging to the right. Subtle attenuation difference also distinguishes the enlarged caudate. For this case, LSVR =0.78, CRL ratio =0.49, splenic volume =241 cm3, and maximal splenic diameter =10.3 cm. Note how only the LSVR measurement provides clear distinction between these two cases.
Linear measurements were also made using the Liver Analysis tool. The caudate-to-right lobe (CRL) ratio was obtained as previously described by Harbin et al.10 Specifically, at the level of the main portal vein bifurcation in the axial (transverse) plane, the length of the caudate lobe was measured as the distance between two predefined sagittal lines, corresponding to the medial (left) margin of the caudate lobe and the right lateral border of the main portal vein. The length of the right lobe extends from a third sagittal line along the lateral edge of the liver to the middle line extending to the portal vein. The CRL ratio is then simply the caudate length over the right lobe length. Linear measurements of the spleen included the maximum length in the axial and coronal planes. The longer of these two linear splenic measurements was used for primary analysis. As above, all measurements were made by a trained medical student supervised by one of two experienced abdominal radiologists.
Interobserver Variability
For a subset of 10 patients (5 normal, 5 cirrhotic), measurements were independently made by a trained undergraduate, 2 trained medical students, and a board certified radiologist. Measurements were compared using interclass correlation (ICC: >0.9, >0.8, >0.7, >0.6 and >0.5 considered as excellent, good, acceptable, questionable, and poor agreement, respectively).
Statistical Analysis
In summary, the measured volumes included the total liver and spleen, hepatic segments IV–VIII combined, and segments I–III combined, as well as separate caudate (I) and left lateral (II–III) portions. As described above, to best accentuate the expected morphologic changes within the liver in cirrhosis, we define the “liver segmental volume ratio” or LSVR as the volume ratio of segments I–III to segments IV–VIII. The linear measures include the CRL ratio and the maximum splenic dimension.
All linear and volume measurements were recorded with summary statistics (mean, SD = standard deviation, quartiles, extremes), calculated separately for each patient cohort. A Kruskal-Wallis test was used to assess differences between the normal controls and cirrhotic/ESLD cohort for each measured parameter. Receiver operating characteristic (ROC) curves were obtained for each candidate metric, and areas under the curve (AUC) were calculated, with a DeLong 95% confidence interval. Logistic regression was used to predict cirrhosis as a function of LSVR and spleen volume. A p-value <0.05 (two-sided) was the criterion for statistical significance. Diagnostic plots were obtained to assess possible violations in model assumptions. Interclass correlation was performed for interobserver data. R 3.1.0 (R Core Team 2014) was used for all statistical analyses.
Results
Many of the volumetric and linear hepatosplenic measures between the cirrhotic and normal cohorts reached statistical significance (Table 1), but the single most significant measure was the LSVR (0.55 ± 0.29 versus 0.27 ± 0.07, p<0.0001), followed by splenic volume (769.2 ± 448.4 cm3 versus 216.5 ± 90.9 cm3, p<0.0001). The only two measures that were not significantly different between the two cohorts were the linear caudate size (50.3 ± 13.8 cm versus 50.1 ± 8.7 cm, p=0.649) and the CRL ratio (0.66 ± 0.26 versus 0.57 ± 0.13, p=0.051). Although statistically significant, the mean total liver volume differed by less than 2% between the groups (1649.0 ± 717.9 cm3 versus 1671.0 ± 309.6 cm3, p=0.004), with individual cirrhotic total liver volumes exceeding the mean normal value in 38.0% of cases (41 of 108). However, within the total liver volume, there were marked differences in regional liver volumes between segments I–III and IV–VIII (Figure 2). This underscores the process of volume loss in segments IV–VIII and the compensatory response of segments I–III seen in cirrhosis, which is best described by the LSVR.
Table 1.
CT-based linear and volumetric hepatosplenic measurements
| Volume (cm3) | |||
|---|---|---|---|
| Cirrhotic | Normal | p-value | |
| Segment I | 128.3±97.2 | 46.7±15.1 | <0.0001 |
| Segments II–III | 422.8±108.0 | 300.1±86.1 | <0.0001 |
| Segments I–III | 551.0±267.4 | 346.8±93.3 | <0.0001 |
| Segments IV–VIII | 1097.9±525.4 | 1324.2±93.3 | <0.0001 |
| Total Liver | 1649.0±717.9 | 1671.0±309.6 | 0.004 |
| Spleen | 769.2±448.4 | 216.5±90.9 | <0.0001 |
| Linear Measures (cm) | |||
| Cirrhotic | Normal | p-value | |
| Caudate lobe | 50.3±13.8 | 50.1±8.7 | 0.649 |
| Right lobe | 80.2±12.1 | 90.1±10.4 | <0.0001 |
| Spleen (axial) | 14.1±2.7 | 10.3±1.5 | <0.0001 |
| Spleen (coronal) | 14.2±3.2 | 10.1±1.4 | <0.0001 |
| Ratios | |||
| Cirrhotic | Normal | p-value | |
| CRL | 0.66±0.26 | 0.57±0.13 | 0.051 |
| LSVR | 0.55±0.29 | 0.27±0.07 | <0.0001 |
Figure 2. Mean hepatic volumes in the two patient cohorts.
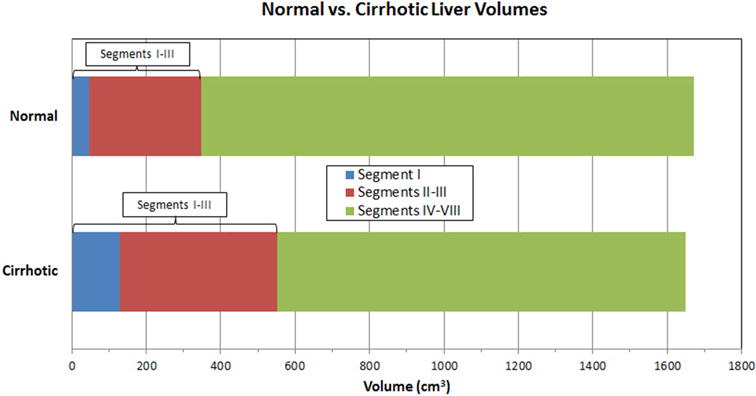
Bar graph depicts mean hepatic volumes in the normal (top) and cirrhotic (bottom) cohorts, derived from CT. Note the overall volume loss in Couinaud segments IV–VIII (green) in the cirrhosis group, which is nearly compensated by the relative increase in segments I (blue) and II–III (red). The average total liver volume is similar between the two cohorts, differing by <2%.
Overall, the mean volume loss of segments IV–VIII in cirrhosis compared with normal controls was 226.3 cm3, a 17% decrease in this region, and the mean compensatory increase of segments I–III was 204.2 cm3, a 59% increase in this region. These regional morphologic changes are visually demonstrated on CT in Figure 1. Although the relative percentage increase in mean caudate/segment I volume was greater than that of the left lateral segments II–III (175% versus 41% increase) among the cirrhotic cohort, the mean increase in actual liver parenchyma was overall greater for segments II–III compared with segment I (122.7 cm3 versus 81.4 cm3).
The diagnostic performance of the LSVR, CRL ratio, and splenic volume for distinguishing cirrhosis from normal is shown in Table 2, both according to various thresholds and overall performance with ROC analysis (AUC). By varying the LSVR threshold, one can achieve either a high sensitivity (eg, 95.4% for LSVR ≥0.26) or a high specificity (eg, 96.1% for LSVR ≥0.40). An intermediate threshold such as LSVR ≥0.35 achieves a more balanced profile (81.5% sensitivity and 88.7% specificity). In comparison, there are no threshold values for the linear CRL ratio that achieve a sensitivity and specificity above 50% together (Table 2). As with the LSVR, splenic volume performed well, achieving a similar sensitivity and specificity profile. For example, using a splenic volume threshold ≥300 cm3, the sensitivity and specificity for detecting cirrhosis was 88.0% and 84.8%, respectively.
Table 2.
Diagnostic performance of hepatosplenic measures for cirrhosis
| Threshold | Sensitivity (%) | Specificity (%) | ROC AUC | |
|---|---|---|---|---|
| LSVR | 0.26 | 95.4 | 51.5 | 0.916 |
| 0.28 | 94.4 | 63.2 | ||
| 0.30 | 88.0 | 71.1 | ||
| 0.35 | 81.5 | 88.7 | ||
| 0.40 | 68.5 | 96.1 | ||
| CRL Ratio | 0.30 | 96.3 | 0.5 | 0.567 |
| 0.41 | 92.6 | 8.8 | ||
| 0.50 | 66.7 | 31.4 | ||
| 0.60 | 45.3 | 63.7 | ||
| 0.70 | 34.3 | 87.3 | ||
| Spleen Volume (cm3) | 200 | 96.3 | 53.0 | 0.938 |
| 250 | 93.0 | 73.0 | ||
| 300 | 88.0 | 84.8 | ||
| 350 | 83.3 | 91.2 | ||
| 400 | 80.6 | 94.6 | ||
| Spleen Linear Max (cm) | 10 | 95.4 | 27.9 | 0.909 |
| 11 | 91.7 | 63.2 | ||
| 12 | 87.0 | 84.8 | ||
| 13 | 79.6 | 93.6 | ||
| 14 | 63.9 | 98.0 |
Univariate ROC analysis (Figure 3) for distinguishing cirrhosis from normal effectively demonstrates the diagnostic differences between poor performers such as the CRL ratio (AUC=0.567; 95% CI, 0.495–0.640) and total liver volume (AUC=0.598; 95% CI, 0.521–0.674) and high performers such as the LSVR (AUC=0.916; 95% CI, 0.881–0.951) and splenic volume (AUC=0.938; 95% CI, 0.905–0.971). Linear splenic measurement also performed well (nearly as well as splenic volumes), with only minimal improvement in the “maximal” splenic length (AUC=0.909) compared with the longest axial length (AUC=0.884) and coronal length (AUC=0.904). This is further supported by the nearly identical mean values for axial and coronal splenic lengths in each cohort, both within 1–2 mm on average (Table 1).
Figure 3. ROC curves for detecting cirrhosis by various hepatosplenic measures.
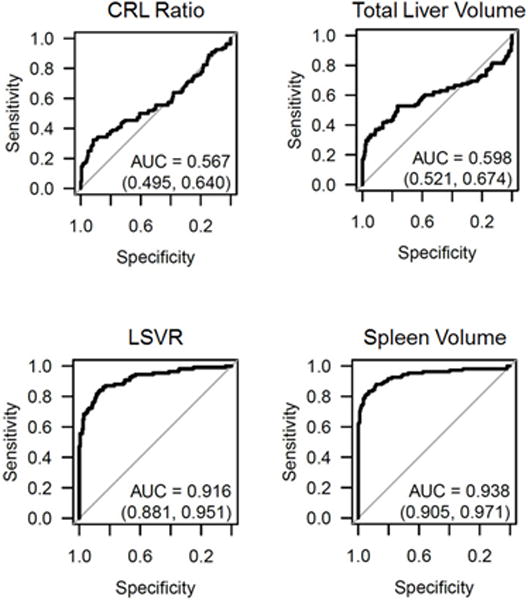
The top row depicts the diagnostic performance for the CRL ratio and total liver volume, which were both relatively poor predictors of cirrhosis. The bottom row depicts the two best predictors of cirrhosis: the LSVR and splenic volume.
Combining LSVR and splenic volume together further improved overall performance, with good separation between the cirrhotic and normal cohorts (Figure 4). The AUC for the ROC curve improved to 0.986 (95% CI, 0.974–0.998) when these complementary factors are combined (Figure 4). By using these two measures in a qualitative decision tree analysis approach based on sensitivity and specificity tables from the ROC analysis, overall accuracy increases to >90%. For example, by using the threshold values for LSVR and splenic volume shown in figure 5, overall accuracy increased to 92.6%, with PPV and NPV both >90%. In a pruned decision tree, using a total splenic volume cutoff <430.8 ml followed by a LSVR<0.4 may decrease misclassifications and improve in-sample accuracy to 94.6% (295/312 correctly classified, 17 misclassified).
Figure 4. Combining LSVR and splenic volume for predicting cirrhosis.
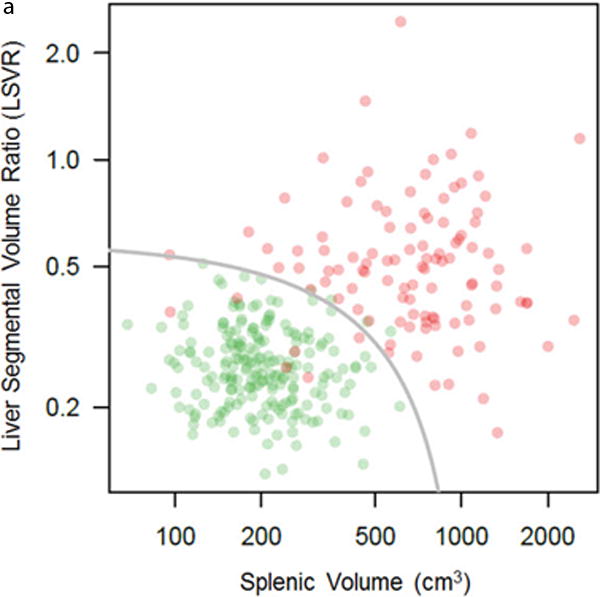
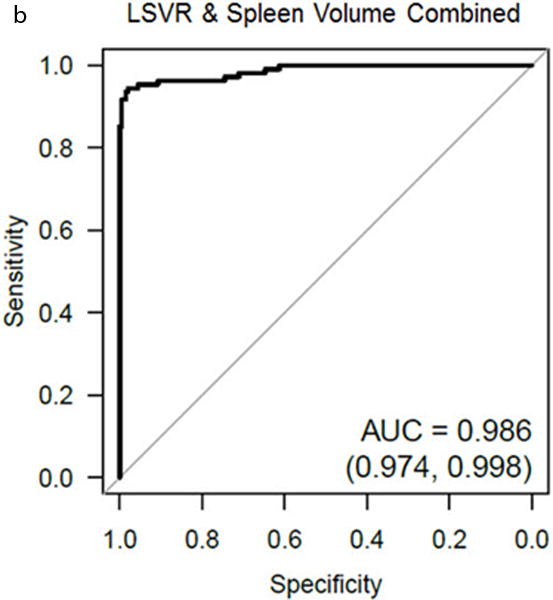
Log-log scatter plot (A) shows the distribution of normal (green) and cirrhotic (red) cases according to both the LSVR and splenic volume. In general, there is good separation between the two cohorts. The gray line is the threshold for predicted cirrhosis ≥0.05 from logistic regression. The log-log scales prevent clumping of the normal cases in the lower left of the plot (low LSVR, low splenic volume), and distorts the linear threshold into the shown curve. ROC analysis (B) shows the high complementary performance associated with combining these two measures, with an AUC = 0.986.
Figure 5. Decision tree analysis incorporating the LSVR and splenic volume.
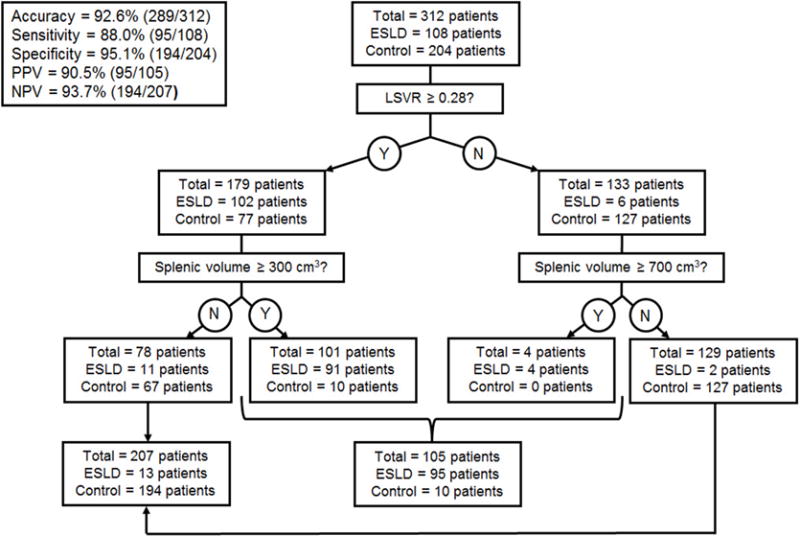
Using the thresholds shown in the diagram, the overall accuracy for cirrhosis was 92.6%. If a splenic volume threshold of 230 cm3 is substituted for 300 cm3 above, the sensitivity and specificity profile shift to 93.5% and 89.7%, respectively.
Measurements were found to be very reproducible across readers of varying experience, with interclass correlation of 0.98 (95% CI 0.94, 0.99) for total liver volume, 0.89 (95% CI 0.75, 0.97) for LSVR, and 0.99 (95% CI 0.98, 1.0) for splenic volume.
Discussion
The regional morphologic changes that occur in the liver as cirrhosis develops are well known.7, 8 Specifically, the volume loss in Couinaud segments IV–VIII is typically compensated in part by relative hypertrophy of segments I–III. Although these changes are subjectively perceptible at CT or MR, we have introduced the LSVR or liver segmental volume ratio as a direct way to quantify and amplify this phenomenon. As such, this volume ratio measure was by far the most statistically significant size difference seen in the liver between our cirrhosis and normal cohorts. Linear measurements of liver, such as the CRL ratio fail to capture many of the complex underlying morphologic changes.9–11 Other studies that have assessed liver volume have come close at times to suggesting this sort of measure, but have either focused on the caudate or left lateral segments separately,12–14 changes relative to the whole liver,8 or just the total liver volume itself.15 For example, Liu et al15 found little or no change in total liver volume according to stage of hepatic fibrosis, likely due to the compensatory increase in segments I–III. Our results also show little value in assessing total liver volume, as it ignores the important intrahepatic regional changes that have occurred.
We were somewhat surprised by the relatively poor performance of the linear hepatic measures in our study, such as the CRL ratio. Although this may have been improved by the use of subsequent modified versions of the CRL ratio,9 such simplified linear measures still fail to account for the complex anatomy of the caudate, which becomes much more pronounced in cases of cirrhosis. As previously noted, the caudate is composed of three parts: the Spiegel lobe, the paracaval portion, and the caudate process.17 In some cases of cirrhosis, a swollen caudate process can be seen encroaching on the shrunken right hepatic lobe, sometimes accentuated by subtle attenuation differences. In other cases of cirrhosis, this border is less apparent, which may underestimate caudate size. Anatomically, a small draining vein can be identified at the border between the right lobe and caudate process.18 Although compensatory changes in the caudate in cirrhosis are greater than the left lateral segments on a percentage basis, our study shows that segments II and III contribute more in terms of actual parenchymal mass.
As with the LSVR, splenic size showed excellent performance for distinguishing ESLD from normal. The mean splenic volume of our normal cohort was nearly identical to a smaller study by Prassopoulos et al.19 Unlike the liver, linear measurement of the spleen rivaled volumetry in terms of diagnostic performance. Interestingly, little difference was seen between the longest axial (transverse) and longest coronal splenic measurement, suggesting either could be obtained in practice. By combining LSVR with splenic volume, the best overall performance was seen for detecting cirrhosis. Although unproven, we hypothesize that the changes in segmental liver volume might precede changes in splenic volume in earlier stages of fibrosis, as the latter would presumably require the ensuing portal hypertension to drive it. For this proof of concept study, we chose to begin with the two ends of the spectrum: normal and ESLD. As such, advanced portal hypertension was present in many of the cirrhotic patients, which likely exaggerated the changes in splenic size. We plan to test these measures on earlier stages of fibrosis to see if the LSVR is in fact an earlier indicator of disease.
Advanced visualization platforms for CT continue to evolve and improve in functionality. As CT volumetric assessment becomes more and more time efficient, its clinical use will likely increase. Other potential or realized applications in body CT imaging include longitudinal surveillance of lung nodules and colorectal polyps for interval growth,20–23 response assessment of hepatic and other tumors to therapy,24–26 and assessment of organ size for various indications.27 In terms of volumetric organ measurement, regional differences can become critical in terms of planned surgery, such as partial hepatic resection,28 or suggest underlying disease as we have shown.
These volumetric measures, including total liver volume, LSVR and splenic volume were very reproducible with excellent agreement between measures performed by readers of varying experience levels.
This study represents a starting point for future investigations. As mentioned, we plan to assess for morphologic liver changes in earlier stages of hepatic fibrosis using the LSVR measurement. Subsequent correlation of our results with US or MR elastography might be worthwhile, especially if specificity for early fibrosis can be improved. Unfortunately, elastography cannot be applied retrospectively like volumetry can. Early work with strategies to detect subtle surface nodularity to the liver has shown promise and could prove to be complementary to our volume work.
We acknowledge limitations to our study. The fact that only the two extremes of “normal” and ESLD were considered is a limitation. This proof of concept study was meant to assess whether LSVR was a useful measurement in the assessment of cirrhosis which was the reasoning behind this strategy, and future work will be targeted at earlier stages of liver disease and fibrosis as previously discussed. In terms of the cirrhotic cohort, the presence of advanced disease with portal hypertension not only accentuated differences in splenic size, but also resulted in ascites and portosystemic collaterals in many cases. Such findings make the distinction between normal and ESLD straightforward but are likely absent in less advanced disease. Of note, there were also several outliers amongst our normal controls that may have actually had subclinical or compensated disease, based on their hepatosplenic findings. However, liver biopsy was not an inclusion criterion for the normal cohort and was generally not available. We also did not consider general biometric measures, such as patient weight, BMI, or BSA. Our measures of classification accuracy (AUC) were not subject to cross validation, and may thus be overoptimistic when applied in other settings.
In conclusion, measurement of CT-based hepatosplenic volumetric changes are more effective than standard linear measures for differentiating cirrhotic from normal livers, especially with respect to regional changes in hepatic segments I–III versus IV–VIII. These regional changes are best reflected by the LSVR, in conjunction with splenic enlargement. Further investigation is warranted to determine if the LSVR can detect earlier stages of hepatic fibrosis that may precede the development of portal hypertension.
Acknowledgments
Funding: This study was supported by a grant from Philips; P.J.P. is co-founder of VirtuoCTC, shareholder in Cellectar Biosciences, and received travel support from Philips
References
- 1.Afdhal NH, Nunes D. Evaluation of liver fibrosis: A concise review. American Journal of Gastroenterology. 2004;99:1160. doi: 10.1111/j.1572-0241.2004.30110.x. [DOI] [PubMed] [Google Scholar]
- 2.Castera L, Vergniol J, Foucher J, et al. Prospective comparison of transient elastography, fibrotest, APRI, and liver biopsy for the assessment of fibrosis in chronic hepatitis C. Gastroenterology. 2005;128:343. doi: 10.1053/j.gastro.2004.11.018. [DOI] [PubMed] [Google Scholar]
- 3.Foucher J, Chanteloup E, Vergniol J, et al. Diagnosis of cirrhosis by transient elastography (FibroScan): a prospective study. Gut. 2006;55:403. doi: 10.1136/gut.2005.069153. [DOI] [PMC free article] [PubMed] [Google Scholar]
- 4.Yin M, Talwalkar JA, Glaser KJ, et al. Assessment of hepatic fibrosis with magnetic resonance elastography. Clinical Gastroenterology and Hepatology. 2007;5:1207. doi: 10.1016/j.cgh.2007.06.012. [DOI] [PMC free article] [PubMed] [Google Scholar]
- 5.Sagir A, Erhardt A, Schmitt M, et al. Transient elastography is unreliable for detection of cirrhosis in patients with acute liver damage. Hepatology. 2008;47:592. doi: 10.1002/hep.22056. [DOI] [PubMed] [Google Scholar]
- 6.Chen J, Talwalkar JA, Yin M, et al. Early Detection of Nonalcoholic Steatohepatitis in Patients with Nonalcoholic Fatty Liver Disease by Using MR Elastography. Radiology. 2011;259:749. doi: 10.1148/radiol.11101942. [DOI] [PMC free article] [PubMed] [Google Scholar]
- 7.Dodd GD, Baron RL, Oliver JH, et al. Spectrum of imaging findings of the liver in end-stage cirrhosis: Part I, gross morphology and diffuse abnormalities. American Journal of Roentgenology. 1999;173:1031. doi: 10.2214/ajr.173.4.10511173. [DOI] [PubMed] [Google Scholar]
- 8.Torres WE, Whitmire LF, Gedgaudasmcclees K, et al. Computed -tomography of the hepatic morphological changes in cirrhosis of the liver. Journal of Computer Assisted Tomography. 1986;10:47. doi: 10.1097/00004728-198601000-00009. [DOI] [PubMed] [Google Scholar]
- 9.Hitomi Awaya M, Mitchell MD Donald G, Kamishima MD Tamotsu, Holland MD George, Ito MD Katsuyoshi, Matsumoto MD Tsuneo. Cirrhosis: Modified Caudate-Right Lobe Ratio. Radiology. 2002;224:769. doi: 10.1148/radiol.2243011495. [DOI] [PubMed] [Google Scholar]
- 10.Harbin MD William P, Robert MD Nicholas J, Ferrucci MD Joseph T., Jr Diagnosis of Cirrhosis Based on Regional Changes in Hepatic Morphology. Radiology. 1980;135:273. doi: 10.1148/radiology.135.2.7367613. [DOI] [PubMed] [Google Scholar]
- 11.Hess CF, Schmiedl U, Koelbel G, et al. Diagnosis of liver cirrhosis with US - ROC analysis of multidimensional caudate lobe indexes. Radiology. 1989;171:349. doi: 10.1148/radiology.171.2.2649915. [DOI] [PubMed] [Google Scholar]
- 12.Xiang-ping Zhou TL, Wei Yong-gang, Chen Xin-zu. Liver Volume Variation in Patients with Virus-Induced Cirrhosis: Findings on MDCT. AJR. 2007;189 doi: 10.2214/AJR.07.2181. [DOI] [PubMed] [Google Scholar]
- 13.Honda H, Onitsuka H, Masuda K, et al. Chronic liver disease: value of volumetry of liver and spleen with computed tomography. Radiation medicine. 1990;8:222. [PubMed] [Google Scholar]
- 14.Kazuo Tarao HH, Motohashi Ikuko, Iimori Kazuto, Tamai Setsuo, Ito Yoshihiko, Takagi Seiichi, Oikawa Yubo, Unayama Shiro, Fujiwara Takuya, Odagiri Kunio, Ikeda Toshio, Hayashi Kazuhiro, Sakurai Akira, Uchikoshi Toshiyuki. Changes in Liver and Spleen Volume in Alcoholic Liver Fibrosis of Man. Hepatology. 1989;9:589. doi: 10.1002/hep.1840090413. [DOI] [PubMed] [Google Scholar]
- 15.Liu P, Li P, He W, et al. Liver and spleen volume variations in patients with hepatic fibrosis. World Journal of Gastroenterology. 2009;15:3298. doi: 10.3748/wjg.15.3298. [DOI] [PMC free article] [PubMed] [Google Scholar]
- 16.Hidaka H, Nakazawa T, Wang G, et al. Reliability and validity of splenic volume measurement by 3-D ultrasound. Hepatology Research. 2010;40:979. doi: 10.1111/j.1872-034X.2010.00705.x. [DOI] [PubMed] [Google Scholar]
- 17.Kimitaka Kogure PhD M, Kuwano MD PhD Hiroyuki, Fujimaki MD PhD Noboru, Makuuchi MD PhD Masatoshi. Relation Among Portal Segmentation, Proper Hepatic Vein, and External Notch of the Caudate Lobe in the Human Liver. ANNALS OF SURGERY. 2000;231:223. doi: 10.1097/00000658-200002000-00011. [DOI] [PMC free article] [PubMed] [Google Scholar]
- 18.Kogure K, Kuwano H, Yorifuji H, et al. The caudate processus hepatic vein - A boundary hepatic vein between the caudate lobe and the right liver. Annals of Surgery. 2008;247:288. doi: 10.1097/SLA.0b013e31815efd8d. [DOI] [PubMed] [Google Scholar]
- 19.Prassopoulos P, Daskalogiannaki M, Raissaki M, et al. Determination of normal splenic volume on computed tomography in relation to age, gender and body habitus. European Radiology. 1997;7:246. doi: 10.1007/s003300050145. [DOI] [PubMed] [Google Scholar]
- 20.Pickhardt PJ, Kim DH, Pooler BD, et al. Assessment of volumetric growth rates of small colorectal polyps with CT colonography: a longitudinal study of natural history. The Lancet Oncology. 2013;14:711. doi: 10.1016/S1470-2045(13)70216-X. [DOI] [PMC free article] [PubMed] [Google Scholar]
- 21.Pickhardt PJ, Lehman VT, Winter TC, et al. Polyp volume versus linear size measurements at CT colonography: Implications for noninvasive surveillance of unresected colorectal lesions. American Journal of Roentgenology. 2006;186:1605. doi: 10.2214/AJR.05.0760. [DOI] [PubMed] [Google Scholar]
- 22.Marchiano A, Calabro E, Civelli E, et al. Pulmonary Nodules: Volume Repeatability at Multidetector CT Lung Cancer Screening. Radiology. 2009;251:919. doi: 10.1148/radiol.2513081313. [DOI] [PubMed] [Google Scholar]
- 23.Wormanns D, Kohl G, Klotz E, et al. Volumetric measurements of pulmonary nodules at multi-row detector CT: in vivo reproducibility. European Radiology. 2004;14:86. doi: 10.1007/s00330-003-2132-0. [DOI] [PubMed] [Google Scholar]
- 24.Lubner MG, Pooler BD, del Rio AM, et al. Volumetric evaluation of hepatic tumors: multi-vendor, multi-reader liver phantom study. Abdominal Imaging. 2014;39:488. doi: 10.1007/s00261-014-0079-z. [DOI] [PubMed] [Google Scholar]
- 25.Costello P, Duszlak EJ, Lokich J, et al. Assessment of tumor response by computed tomography liver volumetry. Journal of Computed Tomography. 1983;7:323. doi: 10.1016/0149-936x(83)90101-7. [DOI] [PubMed] [Google Scholar]
- 26.Prasad SR, Jhaveri KS, Saini S, et al. CT tumor measurement for therapeutic response assessment: Comparison of unidimensional, bidimensional, and volumetric techniques - Initial observations. Radiology. 2002;225:416. doi: 10.1148/radiol.2252011604. [DOI] [PubMed] [Google Scholar]
- 27.Urata K, Kawasaki S, Matsunami H, et al. Calculation of Child and adult standard livervolumefor liver transplantation. Hepatology. 1995;21:1317. [PubMed] [Google Scholar]
- 28.Kubota K, Makuuchi M, Kusaka K, et al. Measurement of liver volume and hepatic functional reserve as a guide to decision-making in resectional surgery for hepatic tumors. Hepatology. 1997;26:1176. doi: 10.1053/jhep.1997.v26.pm0009362359. [DOI] [PubMed] [Google Scholar]