

Abstract
Slug (SNAI2) and Snail (SNAI1) are master regulatory transcription factors for organogenesis and wound healing, and they are involved in the epithelial to mesenchymal transition (EMT) of cancer cells. We found that the activity of phospholipase D isoform 2 (PLD2) is highly increased in cancers with larger size and poor prognosis (MDA‐MB‐231 versus MCF‐7 cells), so we determined if Snail or Slug were responsible for PLD2 gene transcription regulation. Unexpectedly, we found that PLD2 expression was positively regulated by Slug but negatively regulated by Snail. The differential effects are amplified in breast cancer cells over normal cells and with MDA‐MB‐231 more robustly than MCF‐7. Slug putatively binds to the PLD2 promoter and transactivates it, which is negated when Slug and Snail compete with each other. Meanwhile, PLD2 has a negative effect on Snail expression and a positive effect on Slug, thus closing a feedback loop between the lipase and the transcription factors. Further, PA, the product of PLD2 enzymatic reaction, has profound effects on its own and it further regulates the transcription factors. Thus, we show for the first time that the overexpressed PLD2 in human breast tumors is regulated by Slug and Snail transcription factors. The newly uncovered feedback loops in highly invasive cancer cells have important implications in the process of EMT.
Keywords: Mammalian cells, Gene expression, Cell signaling, Breast cancer, RNA role
Abbreviations
- DMEM
Dulbecco's modified eagle media
- EGF
epidermal growth factor
- ECL
enhanced chemiluminescence
- EGFR
epidermal growth factor receptor
- EMT
epithelial to mesenchymal transition
- PLD
phospholipase D
- PLD2
phospholipase D2
- PVDF
polyvinylidene fluoride
- qCPR
quantitative polymerase chain reaction
- siRNA
silencing RNA
- PA
phosphatidic acid
- DOPA
di-oleoyl phosphatidic acid
- GAPDH
glyceraldehyde-3-phosphate dehydrogenase
- HMEC
human mammary epithelial cells
1. Introduction
SNAI1 (Snail) is a zinc‐finger transcription factor that belongs to a larger superfamily known as SNAI and participates in cell differentiation and survival (Nieto, 2002). Snail's main action mode is by inducing epithelial‐to‐mesenchymal transition (EMT) by suppression of E‐cadherin transcription, which is responsible for cell adhesion and migratory capabilities (Bolos et al., 2003). EMT plays a major role in cancer progression and invasion (Choi et al., 2013). Snail repression via silencing RNA (siRNA) results in decreased tumor metastasis and immunosuppression. In addition, there is an increased T‐cell response in the tumor due to suppression of Snail (Kudo‐Saito et al., 2009). Snail deregulation confers resistant to radiation and certain therapeutic drugs specific for ovarian cancer by impeding p53 apoptosis (Kurrey et al., 2009; Mani et al., 2008).
SNAI2 (Slug) is also a zinc‐finger transcription factor that has activities similar to Snail, including E‐cadherin transcriptional repression and anti‐apoptotic activity, and it plays a crucial role in organogenesis and neuralization. Furthermore, Slug deficiencies are present in newborns with neural tube defects. Slug expression is increased in patients with melanoma, lung, colon and ovarian cancers (Elloul et al., 2005). More aggressive forms of breast cancer, such as basal‐like carcinoma, are a phenotype that expresses higher levels of Slug activity (Storci et al., 2008).
Snail and Slug are linked to tumor progression and invasiveness by their ability to alter E‐cadherin and vimentin gene expression (Bolos et al., 2003; Come et al., 2004; Lee et al., 2008). Both Snail and Slug are direct repressors of E‐cadherin and act by binding to the specific E‐boxes of E‐cadherin's proximal promoter (Seki et al., 2003). When Snail was overexpressed in epidermoid cancer cells, E‐cadherin expression was lost with a concomitant change in cell morphology to a fibroblastic phenotype and vimentin gene expression was upregulated, which indicated that Snail induced an EMT (Yokoyama et al., 2003). Overexpression of Slug and Snail in MDCK cells down‐regulates Claudin‐1 at both protein and mRNA levels. In addition, Snail and Slug are able to effectively repress human Claudin‐1‐driven reporter gene constructs (Martinez‐Estrada et al., 2006).
Expression of Slug and Snail are downstream mediators of epidermal growth factor receptor (EGFR)‐stimulated re‐epithelization (Kusewitt et al., 2009). The levels of Slug and Twist (another transcription factor) increased in cancerous tumors, whereas Snail levels are reduced (Yu et al., 2010). The human MCF‐7 breast cancer cell line normally has low levels of Snail or Slug. However, when these cells are ectopically transfected with Snail or Slug, several genes involved in cell migration/invasion through the transforming growth factor β (TGF‐β) signaling pathway are upregulated, while genes responsible for differentiated morphology (i.e. cell junction molecules, E‐cadherin) are downregulated (Dhasarathy et al., 2011).
Phospholipase D (PLD) is a membrane protein that has specific lipid hydrolase activity that breaks phosphatidylcholine (PC) into choline and phosphatidic acid (PA) (Frohman et al., 1999). PA is used by cells for the regulation of chemotaxis and cell proliferation, as a lipid second messenger. PLD also has an important role in cell signaling through protein–protein interactions with GTPases, kinases and phosphatases, as well as through the production of PA (Hammond et al., 1997).
There are at least 4 PLD mammalian isoforms, PLD1, PLD2, PLD4 and PLD6 (Ipsaro et al., 2012, 2012, 1998, 1998, 2010). PLD2 has been shown to be heavily involved in tumorigenesis and cancer metastasis, especially as PLD2 expression and activity are drastically increased in many cancers (Chen et al., 2003; Cho et al., 2008; Kantonen et al., 2011; Knapek et al., 2010; Nishikimi et al., 2009; Noh et al., 2000; Riebeling et al., 2003; Saito et al., 2007; Sanematsu et al., 2013; Yamada et al., 2003; Zhao et al., 2000). Additionally, there also is a correlation between high PLD2 expression, increased tumor size and poor patient prognosis (Saito et al., 2007).
We set out in this study to investigate if the PLD2 promoter activity was regulated by two zinc‐finger transcription factors, Slug or Snail. We show here that PLD2 expression was negatively regulated by the transcription factor Snail and positively regulated by Slug, which is important for low levels of breast cancer cell invasiveness. We also show that Snail suppressed PLD2, unless PA levels in cells was sufficiently abundant in which case the situation was reversed. Therefore, if PLD2 was found in high levels within the tumor cells, then this correlated to the more metastatically invasive cancer cells.
2. Materials and methods
2.1. Plasmid DNAs
The plasmids were as follows: pcDNA3.1‐myc‐PLD2‐WT, which was designed in our lab, pEGFP‐C2‐Snail‐WT was from Addgene.com (Plasmid #16225) (Zhou et al., 2004), pcDNA3.1+‐myc Slug‐WT was from Addgene.com (Plasmid #31698) (Kajita et al., 2004).
2.2. Cell culture and transfection of cells
The highly aggressive human breast cancer cell line MDA‐MB‐231 and the less aggressive MCF‐7 cell line were obtained from ATCC (Manassas, VA, USA). MDA‐MB‐231 cells have the phenotype ER−/PR−/HER−, and are endocrine non‐responsive. MCF‐7 cells are luminal, have the phenotype ER+/PR+/−/HER− and are endocrine responsive. COS‐7 cells are monkey kidney fibroblasts and HMECs are non‐cancerous human mammary epithelial cells. All cell lines were obtained from ATCC (Manassas, VA, USA). COS‐7, MCF‐7 and MDA‐MB‐231 cells were cultured in Dulbecco's modified Eagle's medium (DMEM) supplemented with 10% (v/v) fetal bovine serum (FBS). HMECs were cultured in complete human mammary epithelial cell media. Cells were maintained at 37 °C in an incubator with a humidified atmosphere of 5% CO2. Cells were seeded in 6‐well plates with an equal number of cells per well. Cells were then allowed to grow for 12–24 h prior to transfection. Plasmid transfection reactions included 1–2 μg of DNA plasmid and 1 μg DNA:2 μl volume of Transit‐2020 transfection reagent in 300 μl of Opti‐Mem Serum‐Free media. The above transfection reaction was incubated at room temp for 20 min and was subsequently added to the appropriate well in 2 ml of complete media. Cell transfections were 36–48 h in duration. Control for silencing transfection is negative control (mock) and for overexpression is transfection mix without DNA. Transfection efficiency of MCF‐7 cells is 50–60%, MDA‐MB‐231 is 55–62% and COS‐7s is 74–83%.
2.3. SDS‐PAGE and western blot analyses
Samples of equal volume and equal protein concentration were prepared with SDS buffer and heat‐denatured for 5 min. Samples were run on 4–20% acrylamide pre‐cast gels SDS‐polyacrylamide gels (ThermoScientific) at 100 V for 1 h. Protein was transferred onto PVDF Transfer Membrane (ThermoScientific) at approximately 400 mA for 1 h. Blots were incubated in primary antibody in 5% BSA in TBS‐T buffer overnight at 4 °C. Blots were washed with TBS‐T 3 times for 5 min each wash. Blots were subsequently incubated in the appropriate secondary antibody in 5% BSA in TBS‐T buffer for 1 h. Blots were washed with TBS‐T 3 times for 5 min each wash. Amercham ECL Western Blotting Detection Reagents purchased from GE Healthcare were used for detection. Antibodies were used at 1:100 dilution and include: Abgent PLD2 mouse monoclonal antibody (Cat. # AT3337a), Cell Signaling β‐actin rabbit monoclonal antibody (Cat. # 4970S), Santa Cruz Biotechnology GFP rabbit polyclonal antibody (Cat. # sc‐8334), Cell Signaling Anti‐rabbit IgG HRP‐linked antibody (Cat. # 7074S), Cell Signaling Anti‐mouse IgG HRP‐linked Antibody (Cat. # 7076S).
2.4. Luciferase assay
Luciferase reporter assays were performed using LightSwitch Luciferase Assay Kit from Active Motif (Cat. # 32031). The reporter vector contained the PLD2 promoter region and a downstream 3′‐RenSP luciferase region. Cells were co‐transfected as previously described with plasmid DNA for either of the 2 transcription factors (Slug or Snail) and the LightSwitch PLD2 promoter vector in a 96 well plate for 36 h. LightSwitch Luciferase Assay Reagent was added to the wells and the signal was read on a luminometer. The signal for each sample was calculated and normalized to a negative control sample.
2.5. Quantitative polymerase chain reaction (QPCR) assay
Cells that were transfected with the PLD miExpress Precursor miRNA Expression Clones were used for RNA lysates 48 h post‐transfection using the RNeasy kit according to the manufacturer's protocol (Qiagen, Valencia, CA). RNA concentrations were determined using a NanoDrop, and samples were normalized to 2 μg RNA. Reverse transcription was performed with 2 μg of RNA, 210 ng of random hexamers, 500 μM dNTPs, 84 units of RNaseOUT and 210 units of Superscript II reverse transcriptase and incubated at 42 °C for 55 min. Quantitative PCR reactions were run with 100 ng of total input RNA, 2 μl of the PLD2 gene expression assay (6‐carboxyfluorescein (FAM)‐labeled) multiplexed with the housekeeping gene (GAPDH or actin). Quantitative PCR conditions for the Stratagene Mx3000P Cycler were: 95 °C for 3 min and then 50 cycles of the next 3 steps: 30 s 95 °C, 1 min 60 °C, and then 1 min 72 °C. The cycle threshold Ct values were chosen from the linear part of the PCR amplification curve where an increase in fluorescence can be detected at >10 S.E. above the background signal. ΔCt was calculated as: ΔCt = Avg. PLD Ct − Avg. Housekeeping Ct, and gene‐fold expression was calculated as 2− (ΔΔCt) = 2− (experimental condition ΔCt − control ΔCt).
2.6. Cell invasion assays
Cells in 10% FBS (MDA‐MB‐231 or MCF‐7) were serum‐starved for 2 h in chemotaxis buffer that contained DMEM + 0.5% bovine serum albumin for MDA‐MB‐231 and MCF‐7 cells and resuspended at a concentration 1.5 × 10⁶ cells/ml in the appropriate chemotaxis buffer. 200 μl cells were applied to the upper chambers of 8 μm PET matrigels (24‐well format) with a 6.5 mm diameter membrane. Final concentration of chemoattractant used was 0 or 10 nM EGF in 500 μl of chemotaxis buffer placed in the lower wells of 24‐well plates. Cell invasion assays were incubated for 6 h (MDA‐MB‐231 or MCF‐7) at 37 °C in a humidified 5% CO2 cell culture incubator. Cells were scraped from the Matrigel insert and were then stained for 1 h in hematoxylin at room temp to visualize cells that invaded the Matrigel. The number of cells that migrated through the Matrigel to the bottom surface of the insert was calculated by counting 3 fields of cells using a 20× objective and a 10× ocular.
2.7. Statistics
Data are presented as mean ± SEM. Data presented in the Figure as bar graphs were performed in triplicate (for qPCR assays) or duplicate (for cell invasion or luciferase activity assays) for at least 3 independent experiments (total n = 9 or n = 6, respectively). The difference between means was assessed by the Single Factor Analysis of Variance (ANOVA) test. Probability of P < 0.05 indicated a significant difference. In the figures, the (*) symbols above the bars denote statistically significant (P < 0.05) ANOVA increases between samples and controls. The (#) symbols above the bars denote statistically significant (P < 0.05) ANOVA decreases between samples and controls.
3. Results
3.1. Slug is a positive regulator, and Snail a negative regulator, of PLD2 expression
Since there is an inter‐regulation between PLD2 and EGFR, we wanted to investigate the relative expression levels of these two proteins in normal and breast cancer cells and if they were under the regulatory control of the same transcription factor (TF). In attempting to establish a suitable TF that would regulate both PLD2 and EGFR, we measured gene expression of both PLD2 and EGFR by QPCR in the presence of a battery of the following transcription factors: Slug, Snail, Twist, LXRα, PPARα and RXRα. Our laboratory has reported on findings for the last three nuclear receptors (Mahankali et al., 2015a) and this study has concentrated on the first three. We found that Slug and Snail showed a significant effect on PLD2 and EGFR gene expression. Moreover, both transcription factors are highly implicated in the progression of invasiveness of cancer cells by promoting EMT (Nieto, 2002).
We utilized two epithelial cell lines as models of normal cells (COS‐7 and HMEC) and two diseased cell lines (MCF‐7 and MDA‐MB‐231) as models of human breast cancer. Endogenous gene expression levels of Slug, Snail, PLD2 and EGFR were determined using QPCR analyses in each cell line tested and shown relative to the housekeeping gene GAPDH (Figure 1A). Endogenous gene expression levels of Slug were lower than Snail in the MCF‐7 cells. Conversely, Slug levels were higher than Snail in the MDA‐MB‐231 cells. In fact, the ratio of Slug/Snail was ∼3.2‐fold higher in MDA‐MB‐231 cells when compared to MCF‐7 cells. Additionally, the level of endogenous expression of PLD2 was higher in MDA‐MB‐231 cells than in MCF‐7 cells. We hypothesized that the levels of Slug/Snail found in the cancer cell lines could regulate endogenous PLD2 expression. Figure 1A also shows relative EGFR gene expression, which supports previous reports that EGFR is elevated in post‐EMT MDA‐MB‐231 cells.
Figure 1.

Relative endogenous expression of Slug, Snail and PLD2 in different cell lines. (A) Quantitative reverse transcription polymerase chain reaction (qRT‐PCR) was performed to determine the relative endogenous gene expression levels of the indicated genes in normal epithelial cells (COS‐7 and HMEC) and breast cancer cells MCF‐7 and MDA‐MB‐231. For each gene, results have been normalized (to 1‐fold) to COS‐7 levels. (B) Western blots of endogenous protein expression of Slug, Snail, PLD2 or EGF in COS‐7, HMEC, MCF‐7 or MDA‐MB‐231 cells. Actin staining is included as equal protein loading controls. (C) Density scan of Western blots in (B) to show differences in the protein expression levels of Slug, Snail, PLD2 and EGFR. (D) MDA‐MB‐231 cells were transfected with silencing, double stranded, RNA for Slug or Snail and the effect on PLD2 protein expression levels are shown. (E) MDA‐MB‐231 cells were transfected with silencing RNA for PLD2 and overexpressed with Slug or Snail and 48 h post‐transfection were used for cell invasion assays through Matrigel matrix using 10 nM EGF as stimulant. The insert shows a Western blot control of silencing for PLD2. (F–G) Cell invasion. MCF‐7 cells (F) or MDA‐MB‐231 (G) cells were transfected with plasmid DNAs that would overexpress Slug, Snail, PLD2 or EGFR and 48 h post‐transfection were used for cell invasion assays. Experiments presented in this Figure as bar graphs were performed in triplicate (for qPCR) or duplicate (for cell invasion) for at least 3 independent sets in total (n = 9 or n = 6, respectively). Results are mean ± SEM and are expressed in terms of gene expression or number of invading cells. The (*) symbols denote statistically significant (P < 0.05) ANOVA increases between samples and controls. The (#) symbols denote statistically significant (P < 0.05) ANOVA decreases between samples and controls.
Basal protein levels for these cell lines suggest Slug is more abundant in MDA‐MB‐231s than MCF‐7s (Figure 1B), and is in accordance with Slug being a positive regulator of PLD2 in the former cells. If Slug were a positive regulator of PLD2, it makes sense that its protein levels were high in MDA‐MB‐231 cells. Likewise, these data are also supported by cell invasion experiments whereby overexpression of Slug, Snail, PLD2 or EGFR resulted in significant increases in MDA‐MB‐231 cancer cell invasion through Matrigel matrix (Figure 1C). The densitometry scans indicate a close association between Slug and PLD2: Where PLD2 is elevated (in MDA‐MB‐231 with respect to MCF‐7 cells) so is Slug and EGFR; (this densitometry also shows that MDA‐MB‐231 cells have more EGF receptors than MCF‐7; as this is a known fact, the results in the blot can be taken as a positive control). These data were the first indication of a differential level of expression of transcription factors that might be involved in PLD/EGFR biology.
3.2. Slug and Snail are needed for cell invasion through PLD2
In order to verify an effect of slug or snail on PLD levels, Slug and snail were silenced by RNA interference, the protein and gene expression levels were determined showing that PLD2 protein expression levels were slightly (43–31%, by band densitometry) reduced by silencing Slug or Snail (Figure 1D). Interestingly, after silencing, upwards shifts in the PLD2 bands were observed, indicating a post‐translational modification of PLD2. Also, to continue studying the relation between Slug or Snail and PLD2, PLD2 was silenced in MDA‐MB‐231 cells and overexpressed with Slug or Snail to observe any changes in cell invasion. The cell invasion was knocked down in PLD2 silenced cells and that Slug or Snail overexpression did not affect PLD2 mediated cell invasion (Figure 1E). Also we tested cell invasion property of cancer cells to see if Slug and Snail overexpression correlates with PLD overexpression and cell invasion in both MCF‐7 and MDA‐MB‐231 cells (Figure 1F and G).
Snail and Slug are involved in crucial cellular processes such as organogenesis, cell differentiation and survival, and they also play a role in the enhancement of breast cancer cell invasiveness and EMT. As differential expression levels of Snail and Slug exist in the highly invasive MDA‐MB‐231 breast cancer cells, we suspected a correlation between the transcription factors and PLD expression.
3.3. Slug and Snail affect PLD2 promoter transactivation
To link Slug and Snail transcription factors to PLD expression, we used a commercially available pEZX‐luciferase reporter vector (pLightSwitch) with the PLD2 promoter cloned into it to study the transactivation of PLD2 in the presence of Slug or Snail overexpression (Figure 2A). Per the manufacturer's protocol, the PLD2 promoter was cloned into the empty vector using MluI‐BglII restriction sites that was upstream of the RenSP reporter gene. This PLD2 promoter‐containing reporter vector and either Slug or Snail plasmids were co‐transfected into control COS‐7 cells or the breast cancer cell lines (MCF‐7 and MDA‐MB‐231) for use in the luciferase assay (Figure 2B–D).
Figure 2.
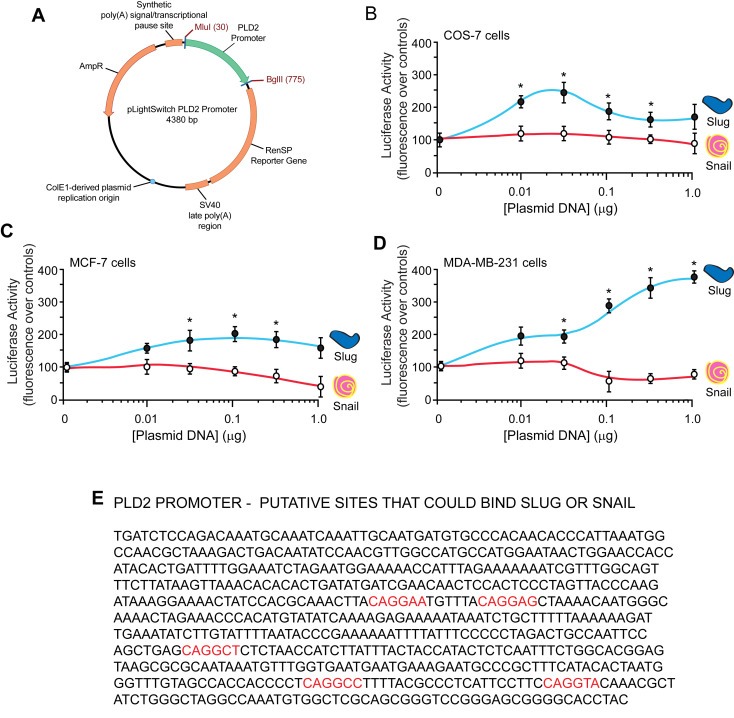
Overexpression of Slug or Snail modulates the PLD2 promoter. (A) Vector map of the pLightSwitch PLD2 promoter vector with the downstream RenSP luciferase reporter gene. (B–D) Luciferase activity. COS‐7 (B), MCF‐7 (C) and MDA‐MB‐231 (D) cells were transfected with increasing concentrations of Slug or Snail plasmid and with 0.5 µg of the PLD2 promoter vector. Forty‐eight hours post‐transfection, cells were used for luciferase assays per the manufacturer's protocol. An increase in luminescence indicates an activation of expression and reporter translation, whereas a decrease in luminescence represents a repression. Results represent the average of 3 experiments performed in triplicate (n = 9) and are represented in terms of percent mean fluorescence ± SEM. (E) The promoter region of PLD2 by BLAST, mapped with putative Slug or Snail binding sites shown in red.
Control COS‐7 cells indicate that Slug overexpression had a biphasic effect on the PLD2 promoter luciferase transactivation in MDA‐MB‐231 cells and Snail overexpression had little effect in these cells (Figure 2B). Slug increased luciferase transactivation of the PLD2 promoter in MCF‐7 cells, while Snail overexpression decreased luciferase transactivation of the PLD2 promoter (Figure 2C). These results were even more significant in the MDA‐MB‐231 cells (Figure 2D). These experiments indicate that Slug transactivated the luciferase reporter gene and that Slug is a transcription factor that activated PLD2 gene expression. These experiments also indicate that Snail negatively affected luciferase expression and that Snail is a transcription factor that repressed PLD2 gene expression. Slug and Snail DNA binding sequence was mapped on PLD2 promoter showing possible sites of Slug or Snail binding to PLD2 DNA (Figure 2E).
3.4. Cancer cells show a heavier regulation by Slug and Snail than normal HMECs
As data in Figure 1 indicated that the Slug and Snail transcription factors might be involved in PLD/EGFR biology, we analyzed the effects of Slug or Snail overexpression on gene and protein expression of EGFR and PLD2 (Figure 3). Slug overexpression (white bars) positively regulated EGFR gene expression (Figure 3A–C), as well as that of PLD2 gene expression (Figure 3D–F) in both normal COS‐7 (Figure 3A and D) and cancerous MCF‐7 (Figure 3B and E) and MDA‐MB‐231 cells (Figure 3C and F). Snail overexpression (gray bars) functioned as a repressor of both EGFR and PLD2 when it was overexpressed in cells, most particularly in the highly aggressive cells MDA‐MB‐231 (Figure 3C and F). One of the points we are making in this study is that the cancer cells show a heavier regulation by Slug and Snail. The more robust differences are present in Figure C and F, corresponding to the more aggressive cell line of the two breast cancer cells: MDA‐MB‐231.
Figure 3.
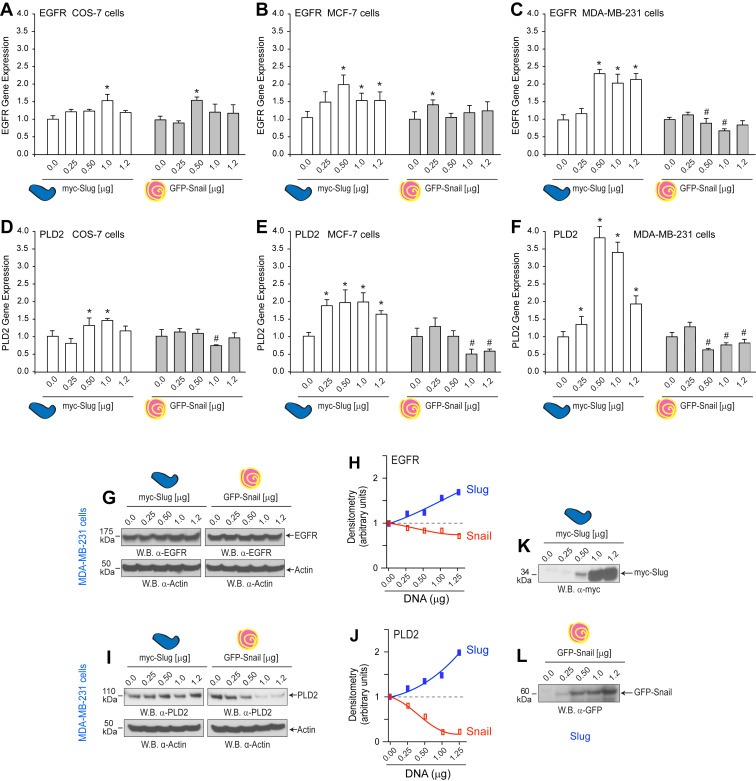
Overexpression of Slug or Snail modulates PLD2 expression. Cells were transfected with increasing concentrations of either myc‐tagged Slug or GFP‐tagged Snail plasmid DNA and 48 h post‐transfection were used for qPCR (A–F) or Western‐blot analyses (G–L). Shown are gene expression levels of EGFR gene expression (A–C) or PLD2 (D–F) in COS‐7, MCF‐7 or MDA‐MB‐231 cells, as indicated. For each group, gene expression in mock‐transfected cells was used as a control. Protein expression from MDA‐MB‐231 cells was detected by Western blot for EGFR (G) or for PLD2 (I) with density scans shown in (H) and (J), respectively. Actin was used as the equal protein loading control. Shown are representative blots of n = 3 for each with similar results. Positive controls for Slug or Snail expression are shown in (K–L) after myc‐Slug plasmid or GFP‐Snail plasmid ectopic overexpression.
The effect of Slug and Snail overexpression was differential in the cell lines tested herein and more markedly so in MDA‐MB‐231 (Figure 3G and H). Historically, Snail is known for its repressor action on the expression of E‐Cadherin, which promotes EMT (Kaufhold and Bonavida, 2014; Nieto, 2002). Figure 3G–J represents protein expression of similarly treated samples in cell lysates suggesting Slug increases PLD2 and EGFR while Snail decreases only PLD2. Figure 3K and L represents the appropriate transfection controls for plasmid overexpression. In summary, ectopic expression of Slug and Snail have opposing effects on PLD2 expression in particular.
3.5. Slug and Snail are needed for cell invasion through PLD2
As results from the luciferase assays (Figure 2) and gene and protein expression (Figure 3) were relatively consistent with activation/repression due to Slug/Snail, respectively, we next wanted to explore the concept of competition assays by keeping expression of one transcription factor constant while expression of the second transcription factor was steadily increased in cells. In the context of the luciferase assay that used overexpression of the PLD2 promoter in concert with either Slug or Snail overexpression or overexpression of both transcription factors simultaneously, we found that increasing Slug overexpression could not overcome constant Snail overexpression in MCF‐7 and MDA‐MB‐231 cells (Figure 4A and B, respectively).
Figure 4.
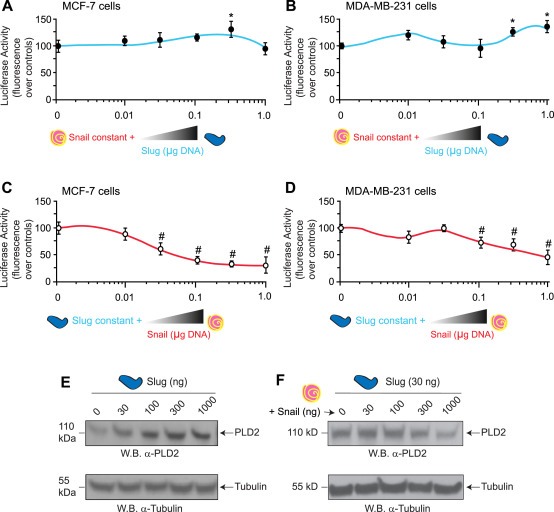
Slug and Snail differentially regulate PLD2 in low‐ versus high‐invasive breast cancer cells. (A–D) Luciferase activity. MCF‐7 (A, C) or MDA‐MB‐231 (B, D) cells were co‐transfected with the indicated concentrations of Slug or Snail DNA plasmids and the PLD2 promoter (as in legend of Figure 2) and used for the luciferase reporter assay. Experiments were performed in triplicate for each condition (n = 9) and shown is mean percent fluorescence ± SEM. (E–F) Western blots showing PLD2 protein expression. Cells were overexpressing variable concentrations of Slug plasmid (E) or they were overexpressing a fixed amount of Slug (30 ng) and increasing concentrations of Snail plasmid.
Conversely, increasing Snail overexpression decreased Slug overexpression‐mediated transactivation of the PLD2 promoter, which reversed the positive effect on the transactivation of the PLD2 promoter (Figure 4C and D), especially in MCF7 cells (Figure 4C) compared to the MDA‐MB‐231 cells (Figure 4D). The effect of increasing Slug overexpression in the absence or presence of constant Snail overexpression on PLD2 protein expression levels in MDA‐MB‐231 cells is shown in Figure 4E, which was consistent with luciferase data presented in Figure 4D. It is noteworthy to mention that PLD2 protein mass decreased with increasing amounts of Snail, in the presence of Slug overexpression (Figure 4F).
3.6. PA has a dual effect on Slug‐activated PLD2 expression activation
By observing the transmodulation between EGFR and PLD2, one cannot ignore the potential presence of PLD's lipase product, phosphatidic acid (PA). We sought to investigate if exogenously added PA could affect the transactivation of the PLD2 promoter in the luciferase assay shown previously herein. Using MCF‐7 and MDA‐MB‐231 cells that had been transfected with both the PLD2 promoter and Slug or Snail plasmid DNA, cells were treated 48 h post‐transfection with PA for either 30 min or 4 h followed by luciferase assays.
Luciferase activity was affected by either the transcription factors (particularly Slug) or by treatment of cells in culture with PA, the product of the enzymatic reaction of PLD. Results from these series of experiments are presented in two parts: Panels 5A,B and panels 5C,D. As shown in Figure 5A and B, luciferase activity was increased in the two breast cancer cell lines, after Slug transfection, but not in the case of Snail. The same data in Figure A, B were re‐plotted in Figure C, D, along with results of experiments of PA treatment. In this case, PA enhanced the Slug‐mediated transactivation (but only marginally Snail‐mediated transactivation) of the PLD2 promoter in both MCF‐7 and MDA‐MB‐231 cells. This shows that luciferase activity is readily elevated in Slug but not in Snail transfection.
Figure 5.

PA affects the PLD2 promoter and PLD2 mass after Slug and Snail overexpression. (A–D) Luciferase activity. COS7, MCF‐7 and MDA‐MB‐231 cells were transfected with Slug or Snail plasmids and the PLD2 reporter vector. Panels (A,B) show the results of luciferase activity, after overexpression of each of the transcription factors alone, which were re‐plotted (as white bars) in (C, D) along with the results of incubation with cell permeable PA (dioleoyl‐PA) in cell cultures for MCF‐7 and MDA‐MB‐231 cells. Results are representative of n = 3 experiments for each condition with relatively similar results and are expressed in terms of mean (–fold) luminescent units normalized to GLH/SEAP control ± SEM. (E–J) Protein expression. MCF‐7 cells (E, H) or MDA‐MB‐231 cells (F, I) transfected with Slug or Slug, in the absence or the presence of PA in culture, were taken for lysates and subsequent Western blotting. Densitometry scans of Westerns on (F) are presented in panel (G) and densitometry scans of Westerns on (I) are presented in panel (J). Depicted are representative blots of n = 3 experiments for each condition with similar results.
PA had a double effect in cells; at short times of incubation (½ h) with cells, PA activated luciferase activity, whereas at longer times of incubation (4 h), PA shows indications of being inhibitory to luciferase activity. We have seen result of this duality in the presence of increasing time of incubation with PA before in earlier studies from our own lab (Mahankali et al., 2015, 2015; Speranza et al., 2014). Additionally, PA had little effect on the Snail‐mediated transactivation of the PLD2 promoter in MDA‐MB‐231 or MCF‐7 cells (Figure 5D). This data indicates that Snail's negative and inhibitory effect on PLD2 transactivation was reversed in the highly aggressive MDA‐MB‐231 cancer cells in the presence of PA. The overall pattern with Snail is 4–5 fold lesser than what is observed with Slug.
3.7. Cancer cells maintain consistent PLD2 levels that are further regulated by PA
The luciferase data presented in Figure 5A and B were also supported by Western‐blot analyses of cell lysates that were similarly treated as in the luciferase assays but that measured the effect of PA on the PLD2 protein mass after Slug or Snail overexpression. A positive effect of Slug overexpression on PLD2 protein levels in the presence of PA was observed in the MCF‐7 cells (Figure 5E) and in MDA‐MB‐231 cells (Figure 5F). A negative effect of Snail overexpression on PLD2 protein mass in both MCF‐7 (Figure 5H) and MDA‐MB‐231 cells (Figure 5I). Density scans for Figure 5F and I are shown in Figure 5G and J showing that PA enhances positive effect of Slug on PLD2 in MCF‐7s and not so much in MDA‐MB‐231s. PA also recovers Snail mediated repression of PLD2 in MDA‐MB‐231s but not so much in MCF‐7s. These results suggest that cancer cells activate cell signaling in a way that enables them to maintain consistent protein levels (EGFR or PLD2) or a consistently active state of transcription.
3.8. PLD has a feedback action on Slug and Snail
We have documented so far herein that Slug and Snail both affected PLD2 and with differing outcomes. We determined now if PLD had an effect, if any, on Slug or Snail expression. We measured the effect of PLD2 overexpression on Snail using two different methods: (i) QPCR analysis and (ii) Western‐blotting of similarly treated MCF‐7 cell lysates. As shown in Figure 6A, when increasing PLD2 protein was overexpressed in MCF‐7 cells that were used for QPCR analyses, endogenous Slug gene expression was increased (left set of bars) with a concomitantly significant decrease in endogenous Snail gene expression (middle set of bars). This piece of data suggests that there was a negative interplay between Slug and Snail when PLD2 was overexpressed, reminiscent of a negative feedback loop. This significant decrease in Snail gene expression was also manifested as a decrease in Snail protein expression when western blots from MCF‐7 cells were probed with anti‐Snail antibodies (Figure 6B).
Figure 6.
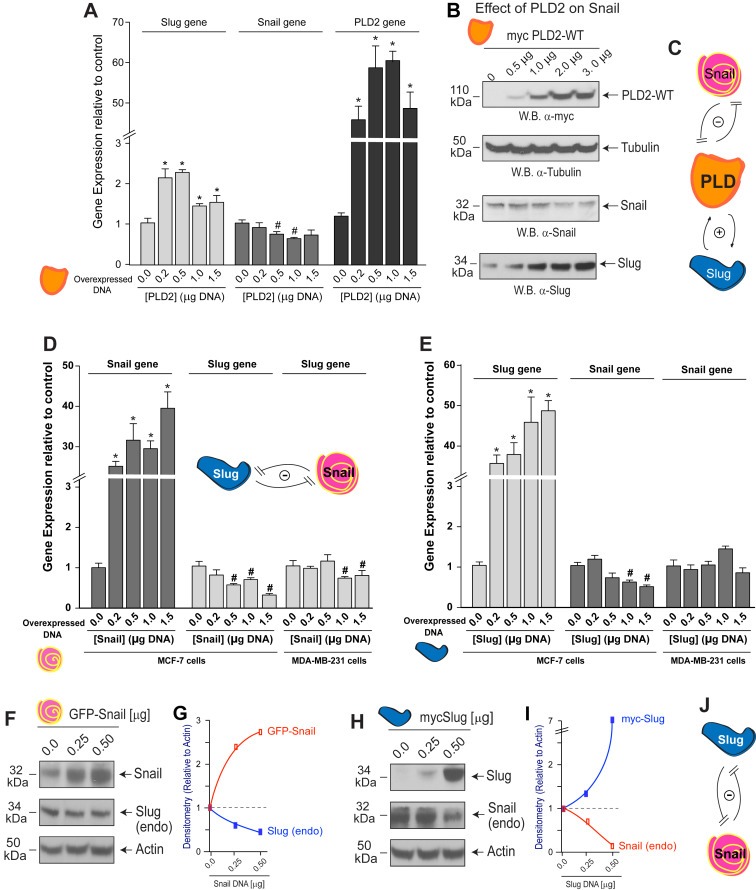
PLD2 overexpression affects Snail and Slug. Increasing concentrations of PLD2, Snail or Slug plasmids were transfected into either MCF‐7 or MDA‐MB‐231 cells and then used for subsequent analysis of gene expression by qPCR (A, D–E) or for Western‐blot analyses (B, F–I). (C) Cartoon depicting reciprocal signaling between PLD2 and Snail and PLD2 and Slug. PLD2 has a negative effect on Snail expression and a positive effect on Slug expression and vice versa. (D–E) Cells overexpressing Snail or Slug were used for qPCR (D, E) or Western‐blot analyses (F–I). Densitometry scans for (F) are shown in (G), and densitometry scans for (H) are shown in (I). (J) Cartoon summarizing the results in this figure, indicating the double negative feedback between Slug and Snail. The abbreviation “endo” refers to endogenous expression in cells.
Similarly, a significant increase in Slug gene expression was also manifested as an increase in Slug protein expression when western blots from MCF‐7 were probed with anti‐Slug antibodies (Figure 6B). The positive control for PLD2 overexpression and equal protein loading control for this western blot are also shown in Figure 6B. As shown in the cartoon depicted in Figure 6C, a close interaction exists between the three molecules, which differentially regulated the expression of the other proteins. While Snail and PLD2 both negatively affected expression of each other, Slug and PLD2 both positively regulated expression of each other.
3.9. There is a signaling interplay between Slug and Snail involving a double negative feedback
To further expand our investigation of the effect of the Snail/Slug duo of transcription factors on expression of potential targets they might signal to in cancer cells, we examined the effect of Snail protein overexpression on Slug gene expression and vice versa. As shown in Figure 6D and E, overexpression of Snail protein maintained a negative effect on Slug gene expression (Figure 6D, middle bars) and Slug protein overexpression maintained a similar negative effect on Snail gene expression (Figure 6E, middle bars) in MCF‐7 cells to a much larger extent than in that of MDA‐MB‐231 cells (Figure 6D and E, right set of bars).
These gene expression data are consistent with protein expression data shown in Figure 6F–J. Thus, ectopic overexpression of Snail has a negative effect on Slug gene and protein expression. Conversely, ectopic overexpression of Slug has a negative effect on Snail gene and protein expression. This complements the previously shown Slug and Snail effect in the PLD‐dependent and metastatically invasive breast cancer cells.
4. Discussion
The reactivation of the embryonic program plays a role in complex diseases, such as fibrosis or cancer. In fibrosis, the embryonic program initiates cell dedifferentiation with the acquisition of some of the embryonic phenotype, but in the case of cancer, this same embryonic program triggers cell movement instead of the embryonic phenotype (Friedmann‐Morvinski and Verma, 2014). Primary tumor formation occurs independent of the activation of these types of cell migration‐dependent genes, while metastasis formation is definitely dependent on the upregulation of both cell migration‐ and cell invasion‐dependent genes (Palmer et al., 2011). Post‐EMT cells are opportunistic and take advantage of physiological mechanisms that were once activated in the formation of the embryo (Gavert and Ben‐Ze'ev, 2008). Slug and Snail maintain the mesenchymal characteristics by repressing the expression of epithelial genes (Tomaskovic‐Crook et al., 2009).
We report here for the first time the existence of a dynamic Slug/Snail interaction that modulates phospholipase D expression in breast cancer cells. As reciprocal expression levels of Snail and Slug exist in high‐PLD2 (MDA‐MB‐231) and low‐PLD2 (MCF‐7) invasive breast cancer cells, there is a correlation between the transcription factors and PLD expression. In this study, we have presented data indicating that Slug and Snail are crucial to regulating cellular PLD2 levels with Slug acting as an activator of gene and protein expression and Snail acting as a suppressor (2, 3, 4, 5). This was confirmed in transactivation assays using the PLD2 promoter cloned into a luciferase reporter plasmid (2, 4).
Furthermore, addition of exogenous phosphatidic acid (PA), the product of the PLD lipase reaction, negated the transactivation repression of Snail in highly aggressive MDA‐MB‐231 cancer cells (Figure 5). PLD2 expression also counteracted the negative effect of Snail on PLD2 by inhibiting Snail expression (Figure 6). Lastly, a mechanistic interplay in the form of a negative feedback loop exists between Slug and Snail in MCF‐7 cells (Figure 6).
A model that explains the results from this study is presented in Figure 7. As shown in the photomicrographs of MCF‐7 and MDA‐MB‐231 cells, there is an obvious difference in the overall cell morphology of the low‐invasive, luminal MCF‐7 cells versus the more aggressive, claudin‐low MDA‐MB‐231 cells following 10 nM EGF stimulation (Figure 7B). According to our model, the transcription factor Slug is an activator of EGFR and PLD2 in highly invasive MDA‐MB‐231 cancer cells, whereas the transcription factor Snail is a suppressor of PLD2 expression in the low‐invasive MCF‐7 breast cancer cells (Figure 7B). Furthermore, PLD2 simultaneously exerted negative signals on Snail's expression, and as such, Snail and PLD2 were maintained in a negative feedback loop. The presence of PA in these 2 different breast cancer cells reversed the transcription activity of Slug efficiently (Figure 7A and B). However, PA had a positive effect on Slug‐mediated EGFR and PLD2 expression, especially at short (30 min) times of incubation with cells. Snail was a repressor of PLD2 and EGFR but in the presence of PA this negative on PLD2 was abrogated. All this suggests that cell signaling pathways including PA's production was active in these breast cancer cells and promoted the expression of oncogenic signals, which induced certain cell invasion‐dependent proteins, such as EGFR and PLD2.
Figure 7.
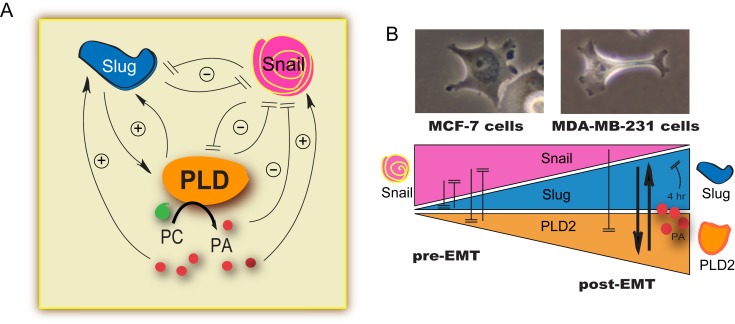
Model of PLD regulation by Slug and Snail. (A) Interplay between the 3 proteins considered in this study, Slug, Snail and PLD, along with the effect of the product of PLD reaction, PA. (B) Photomicrographs of MCF‐7 and MDA‐MB‐231 cells. Note the difference in the overall cell morphology of the low‐invasive MCF‐7 cells versus the more aggressive MDA‐MB‐231 cells following EGF stimulation. The model indicates that the transcription factor Slug activated PLD2 in highly invasive MDA‐MB‐231 cancer cells, but the transcription factor Snail suppressed PLD2 expression in the low‐invasive MCF‐7 breast cancer cells. PLD2 exerted a negative effect on Snail expression, which formed a negative feedback loop between Snail and PLD2. Phosphatidic acid (PA) affected the transcription activity of Slug efficiently in these two breast cancer cell lines.
Slug joined forces with PLD to increase cancer cell invasion, whereas Snail antagonized Slug by blocking its interaction with the PLD2 promoter, which was reversed in the presence of abundant cellular PA. A mechanistic interplay in the form of a negative feedback loop exists between Slug and Snail in MCF‐7 cells. The repression of PLD2 expression by Snail was unexpected, and the explanation for this is that Snail's negative effect on PLD2 was reversed in conditions with PA, like those in MDA‐MB‐231 post‐EMT cells. This added a level of regulation that was not predicted and which implied the promoter of PLD2 was involved in differential regulation of the low‐invasive MCF‐7 versus high‐invasive MDA‐MB‐231 breast cancer cells. In summary, we identified opposing functions of transcription factors Slug and Snail in the PLD‐dependent stages of cell invasion in breast cancer cells.
Funding
The following grants to Dr. Cambronero (J.G‐C.) have supported this work: HL056653‐14 from the National Institutes of Health (NIH) and 13GRNT17230097 from the American Heart Association.
Disclosure
Both authors declare no conflicts of interest.
Acknowledgments
SlugMyc_pcDNA3 was a gift from Dr. Paul Wade (Addgene plasmid # 31698). GFP Snail WT was a gift from Dr. Mien‐Chie Hung (Addgene plasmid # 16225). We thank Dr. Madhu Mahankali for technical assistance and Karen M. Henkels for her excellent editorial assistance on this manuscript.
Ganesan Ramya, Mallets Elizabeth, Gomez-Cambronero Julian, (2016), The transcription factors Slug (SNAI2) and Snail (SNAI1) regulate phospholipase D (PLD) promoter in opposite ways towards cancer cell invasion, Molecular Oncology, 10, doi: 10.1016/j.molonc.2015.12.006.
References
- Bolos, V. , Peinado, H. , Perez-Moreno, M.A. , Fraga, M.F. , Esteller, M. , Cano, A. , 2003. The transcription factor Slug represses E-cadherin expression and induces epithelial to mesenchymal transitions: a comparison with Snail and E47 repressors. J. Cell Sci. 116, 499–511. [DOI] [PubMed] [Google Scholar]
- Chen, Y. , Zheng, Y. , Foster, D.A. , 2003. Phospholipase D confers rapamycin resistance in human breast cancer cells. Oncogene. 22, 3937–3942. [DOI] [PubMed] [Google Scholar]
- Cho, J.H. , Hong, S.K. , Kim, E.Y. , Park, S.Y. , Park, C.H. , Kim, J.M. , Kwon, O.J. , Kwon, S.J. , Lee, K.S. , Han, J.S. , 2008. Overexpression of phospholipase D suppresses taxotere-induced cell death in stomach cancer cells. Biochim. Biophys. Acta. 1783, 912–923. [DOI] [PubMed] [Google Scholar]
- Choi, Y. , Lee, H.J. , Jang, M.H. , Gwak, J.M. , Lee, K.S. , Kim, E.J. , Kim, H.J. , Lee, H.E. , Park, S.Y. , 2013. Epithelial-mesenchymal transition increases during the progression of in situ to invasive basal-like breast cancer. Hum. Pathol. 44, 2581–2589. [DOI] [PubMed] [Google Scholar]
- Come, C. , Arnoux, V. , Bibeau, F. , Savagner, P. , 2004. Roles of the transcription factors snail and slug during mammary morphogenesis and breast carcinoma progression. J. Mammary Gland Biol. Neoplasia. 9, 183–193. [DOI] [PMC free article] [PubMed] [Google Scholar]
- Dhasarathy, A. , Phadke, D. , Mav, D. , Shah, R.R. , Wade, P.A. , 2011. The transcription factors Snail and Slug activate the transforming growth factor-beta signaling pathway in breast cancer. PLoS One. 6, e26514 [DOI] [PMC free article] [PubMed] [Google Scholar]
- Elloul, S. , Elstrand, M.B. , Nesland, J.M. , Trope, C.G. , Kvalheim, G. , Goldberg, I. , Reich, R. , Davidson, B. , 2005. Snail, Slug, and Smad-interacting protein 1 as novel parameters of disease aggressiveness in metastatic ovarian and breast carcinoma. Cancer. 103, 1631–1643. [DOI] [PubMed] [Google Scholar]
- Friedmann-Morvinski, D. , Verma, I.M. , 2014. Dedifferentiation and reprogramming: origins of cancer stem cells. EMBO Rep. 15, 244–253. [DOI] [PMC free article] [PubMed] [Google Scholar]
- Frohman, M.A. , Sung, T.C. , Morris, A.J. , 1999. Mammalian phospholipase D structure and regulation. Biochim. Biophys. Acta. 1439, 175–186. [DOI] [PubMed] [Google Scholar]
- Gavert, N. , Ben-Ze'ev, A. , 2008. Epithelial-mesenchymal transition and the invasive potential of tumors. Trends Mol. Med. 14, 199–209. [DOI] [PubMed] [Google Scholar]
- Hammond, S.M. , Jenco, J.M. , Nakashima, S. , Cadwallader, K. , Gu, Q. , Cook, S. , Nozawa, Y. , Prestwich, G.D. , Frohman, M.A. , Morris, A.J. , 1997. Characterization of two alternately spliced forms of phospholipase D1. Activation of the purified enzymes by phosphatidylinositol 4,5-bisphosphate, ADP-ribosylation factor, and Rho family monomeric GTP-binding proteins and protein kinase C-alpha. J. Biol. Chem. 272, 3860–3868. [DOI] [PubMed] [Google Scholar]
- Ipsaro, J.J. , Haase, A.D. , Knott, S.R. , Joshua-Tor, L. , Hannon, G.J. , 2012. The structural biochemistry of Zucchini implicates it as a nuclease in piRNA biogenesis. Nature. 491, 279–283. [DOI] [PMC free article] [PubMed] [Google Scholar]
- Kajita, M. , McClinic, K.N. , Wade, P.A. , 2004. Aberrant expression of the transcription factors snail and slug alters the response to genotoxic stress. Mol. Cell Biol. 24, 7559–7566. [DOI] [PMC free article] [PubMed] [Google Scholar]
- Kantonen, S. , Hatton, N. , Mahankali, M. , Henkels, K.M. , Park, H. , Cox, D. , Gomez-Cambronero, J. , 2011. A novel phospholipase D2-Grb2-WASp heterotrimer regulates leukocyte phagocytosis in a two-step mechanism. Mol. Cell Biol. 31, 4524–4537. [DOI] [PMC free article] [PubMed] [Google Scholar]
- Kaufhold, S. , Bonavida, B. , 2014. Central role of Snail1 in the regulation of EMT and resistance in cancer: a target for therapeutic intervention. J. Exp. Clin. Cancer Res. 33, 62 [DOI] [PMC free article] [PubMed] [Google Scholar]
- Knapek, K. , Frondorf, K. , Post, J. , Short, S. , Cox, D. , Gomez-Cambronero, J. , 2010. The molecular basis of phospholipase D2-induced chemotaxis: elucidation of differential pathways in macrophages and fibroblasts. Mol. Cell Biol. 30, 4492–4506. [DOI] [PMC free article] [PubMed] [Google Scholar]
- Kudo-Saito, C. , Shirako, H. , Takeuchi, T. , Kawakami, Y. , 2009. Cancer metastasis is accelerated through immunosuppression during Snail-induced EMT of cancer cells. Cancer Cell. 15, 195–206. [DOI] [PubMed] [Google Scholar]
- Kurrey, N.K. , Jalgaonkar, S.P. , Joglekar, A.V. , Ghanate, A.D. , Chaskar, P.D. , Doiphode, R.Y. , Bapat, S.A. , 2009. Snail and slug mediate radioresistance and chemoresistance by antagonizing p53-mediated apoptosis and acquiring a stem-like phenotype in ovarian cancer cells. Stem Cells. 27, 2059–2068. [DOI] [PubMed] [Google Scholar]
- Kusewitt, D.F. , Choi, C. , Newkirk, K.M. , Leroy, P. , Li, Y. , Chavez, M.G. , Hudson, L.G. , 2009. Slug/Snai2 is a downstream mediator of epidermal growth factor receptor-stimulated reepithelialization. J. Invest. Dermatol. 129, 491–495. [DOI] [PMC free article] [PubMed] [Google Scholar]
- Lee, M.Y. , Chou, C.Y. , Tang, M.J. , Shen, M.R. , 2008. Epithelial-mesenchymal transition in cervical cancer: correlation with tumor progression, epidermal growth factor receptor overexpression, and snail up-regulation. Clin. Cancer Res.: Off. J. Am. Assoc. Cancer Res. 14, 4743–4750. [DOI] [PubMed] [Google Scholar]
- Mahankali, M. , Farkaly, T. , Bedi, S. , Hostetler, H.A. , Gomez-Cambronero, J. , 2015. Phosphatidic acid (PA) can displace PPARα/LXRα binding to the EGFR promoter causing its transrepression in luminal cancer cells. Sci. Rep. 5, 15379 [DOI] [PMC free article] [PubMed] [Google Scholar]
- Mahankali, M. , Henkels, K.M. , Speranza, F. , Gomez-Cambronero, J. , 2015. A non-mitotic role for Aurora kinase A as a direct activator of cell migration upon interaction with PLD, FAK and Src. J. Cell Sci. 128, 516–526. [DOI] [PMC free article] [PubMed] [Google Scholar]
- Mani, S.A. , Guo, W. , Liao, M.J. , Eaton, E.N. , Ayyanan, A. , Zhou, A.Y. , Brooks, M. , Reinhard, F. , Zhang, C.C. , Shipitsin, M. , Campbell, L.L. , Polyak, K. , Brisken, C. , Yang, J. , Weinberg, R.A. , 2008. The epithelial-mesenchymal transition generates cells with properties of stem cells. Cell. 133, 704–715. [DOI] [PMC free article] [PubMed] [Google Scholar]
- Martinez-Estrada, O.M. , Culleres, A. , Soriano, F.X. , Peinado, H. , Bolos, V. , Martinez, F.O. , Reina, M. , Cano, A. , Fabre, M. , Vilaro, S. , 2006. The transcription factors Slug and Snail act as repressors of Claudin-1 expression in epithelial cells. Biochem. J. 394, 449–457. [DOI] [PMC free article] [PubMed] [Google Scholar]
- Nieto, M.A. , 2002. The snail superfamily of zinc-finger transcription factors. Nat. Rev. Mol. Cel. Biol. 3, 155–166. [DOI] [PubMed] [Google Scholar]
- Nishikimi, A. , Fukuhara, H. , Su, W. , Hongu, T. , Takasuga, S. , Mihara, H. , Cao, Q. , Sanematsu, F. , Kanai, M. , Hasegawa, H. , Tanaka, Y. , Shibasaki, M. , Kanaho, Y. , Sasaki, T. , Frohman, M.A. , Fukui, Y. , 2009. Sequential regulation of DOCK2 dynamics by two phospholipids during neutrophil chemotaxis. Science. 324, 384–387. [DOI] [PMC free article] [PubMed] [Google Scholar]
- Nishimasu, H. , Ishizu, H. , Saito, K. , Fukuhara, S. , Kamatani, M.K. , Bonnefond, L. , Matsumoto, N. , Nishizawa, T. , Nakanaga, K. , Aoki, J. , Ishitani, R. , Siomi, H. , Siomi, M.C. , Nureki, O. , 2012. Structure and function of Zucchini endoribonuclease in piRNA biogenesis. Nature. 491, 284–287. [DOI] [PubMed] [Google Scholar]
- Noh, D.Y. , Ahn, S.J. , Lee, R.A. , Park, I.A. , Kim, J.H. , Suh, P.G. , Ryu, S.H. , Lee, K.H. , Han, J.S. , 2000. Overexpression of phospholipase D1 in human breast cancer tissues. Cancer Lett. 161, 207–214. [DOI] [PubMed] [Google Scholar]
- Palmer, T.D. , Ashby, W.J. , Lewis, J.D. , Zijlstra, A. , 2011. Targeting tumor cell motility to prevent metastasis. Adv. Drug Deliv. Rev. 63, 568–581. [DOI] [PMC free article] [PubMed] [Google Scholar]
- Park, S.H. , Chun, Y.H. , Ryu, S.H. , Suh, P.G. , Kim, H. , 1998. Assignment of human PLD1 to human chromosome band 3q26 by fluorescence in situ hybridization. Cytogenet. Cell Genet. 82, 224 [DOI] [PubMed] [Google Scholar]
- Park, S.H. , Ryu, S.H. , Suh, P.G. , Kim, H. , 1998. Assignment of human PLD2 to chromosome band 17p13.1 by fluorescence in situ hybridization. Cytogenet. Cell Genet. 82, 225 [DOI] [PubMed] [Google Scholar]
- Riebeling, C. , Muller, C. , Geilen, C.C. , 2003. Expression and regulation of phospholipase D isoenzymes in human melanoma cells and primary melanocytes. Melanoma Res. 13, 555–562. [DOI] [PubMed] [Google Scholar]
- Saito, M. , Iwadate, M. , Higashimoto, M. , Ono, K. , Takebayashi, Y. , Takenoshita, S. , 2007. Expression of phospholipase D2 in human colorectal carcinoma. Oncol. Rep. 18, 1329–1334. [PubMed] [Google Scholar]
- Sanematsu, F. , Nishikimi, A. , Watanabe, M. , Hongu, T. , Tanaka, Y. , Kanaho, Y. , Cote, J.F. , Fukui, Y. , 2013. Phosphatidic acid-dependent recruitment and function of the Rac activator DOCK1 during dorsal ruffle formation. J. Biol. Chem. 288, 8092–8100. [DOI] [PMC free article] [PubMed] [Google Scholar]
- Seki, K. , Fujimori, T. , Savagner, P. , Hata, A. , Aikawa, T. , Ogata, N. , Nabeshima, Y. , Kaechoong, L. , 2003. Mouse Snail family transcription repressors regulate chondrocyte, extracellular matrix, type II collagen, and aggrecan. J. Biol. Chem. 278, 41862–41870. [DOI] [PMC free article] [PubMed] [Google Scholar]
- Speranza, F. , Mahankali, M. , Henkels, K.M. , Gomez-Cambronero, J. , 2014. The molecular basis of leukocyte adhesion involving phosphatidic acid and phospholipase D. J. Biol. Chem. 289, 28885–28897. [DOI] [PMC free article] [PubMed] [Google Scholar]
- Storci, G. , Sansone, P. , Trere, D. , Tavolari, S. , Taffurelli, M. , Ceccarelli, C. , Guarnieri, T. , Paterini, P. , Pariali, M. , Montanaro, L. , Santini, D. , Chieco, P. , Bonafe, M. , 2008. The basal-like breast carcinoma phenotype is regulated by SLUG gene expression. J. Pathol. 214, 25–37. [DOI] [PubMed] [Google Scholar]
- Tomaskovic-Crook, E. , Thompson, E.W. , Thiery, J.P. , 2009. Epithelial to mesenchymal transition and breast cancer. Breast Cancer Res. 11, 213 [DOI] [PMC free article] [PubMed] [Google Scholar]
- Yamada, Y. , Hamajima, N. , Kato, T. , Iwata, H. , Yamamura, Y. , Shinoda, M. , Suyama, M. , Mitsudomi, T. , Tajima, K. , Kusakabe, S. , Yoshida, H. , Banno, Y. , Akao, Y. , Tanaka, M. , Nozawa, Y. , 2003. Association of a polymorphism of the phospholipase D2 gene with the prevalence of colorectal cancer. J. Mol. Med. 81, 126–131. [DOI] [PubMed] [Google Scholar]
- Yokoyama, K. , Kamata, N. , Fujimoto, R. , Tsutsumi, S. , Tomonari, M. , Taki, M. , Hosokawa, H. , Nagayama, M. , 2003. Increased invasion and matrix metalloproteinase-2 expression by Snail-induced mesenchymal transition in squamous cell carcinomas. Int. J. Oncol. 22, 891–898. [PubMed] [Google Scholar]
- Yoshikawa, F. , Banno, Y. , Otani, Y. , Yamaguchi, Y. , Nagakura-Takagi, Y. , Morita, N. , Sato, Y. , Saruta, C. , Nishibe, H. , Sadakata, T. , Shinoda, Y. , Hayashi, K. , Mishima, Y. , Baba, H. , Furuichi, T. , 2010. Phospholipase D family member 4, a transmembrane glycoprotein with no phospholipase D activity, expression in spleen and early postnatal microglia. PLoS One. 5, e13932 [DOI] [PMC free article] [PubMed] [Google Scholar]
- Yu, Q. , Zhang, K. , Wang, X. , Liu, X. , Zhang, Z. , 2010. Expression of transcription factors snail, slug, and twist in human bladder carcinoma. J. Exp. Clin. Cancer Res. 29, 119 [DOI] [PMC free article] [PubMed] [Google Scholar]
- Zhou, B.P. , Deng, J. , Xia, W. , Xu, J. , Li, Y.M. , Gunduz, M. , Hung, M.C. , 2004. Dual regulation of Snail by GSK-3beta-mediated phosphorylation in control of epithelial-mesenchymal transition. Nat Cell Biol. 6, 931–940. [DOI] [PubMed] [Google Scholar]
- Zhao, Y. , Ehara, H. , Akao, Y. , Shamoto, M. , Nakagawa, Y. , Banno, Y. , Deguchi, T. , Ohishi, N. , Yagi, K. , Nozawa, Y. , 2000. Increased activity and intranuclear expression of phospholipase D2 in human renal cancer. Biochem. Biophys. Res. Commun. 278, 140–143. [DOI] [PubMed] [Google Scholar]