

To the editor
Alopecia areata (AA) is a prevalent autoimmune disease characterized by an aberrant immune response targeted to the hair follicle. A lack of understanding of the molecular basis of disease has been an impediment to the development of therapeutic interventions and perpetuates an unmet medical need for patients (Delamere et al., 2008). Our first GWAS identified eight regions in the genome with statistically significant evidence for association, the majority of which had not been previously associated with AA. Unexpectedly, this study also revealed associations shared with other autoimmune diseases such as type 1 diabetes and rheumatoid arthritis (Petukhova et al., 2010), providing an initial rationale for drug repositioning of JAK inhibitors, which we subsequently validated biologically with immunological and pharmacological studies in the C3H/HeJ AA mouse model and in human AA patients (Xing et al., 2014).
We recently published our first meta-analysis GWAS in AA in which we tested up to 1.2 million SNPs for disease association in a cohort of unrelated individuals, including 3,253 cases and 7,543 controls (Betz et al., 2015). This study identified additional associations and increased the total number of associated regions to 14. The associated linkage disequilibrium (LD) blocks span across protein coding genes and regulatory features that can influence the expression of genes in adjacent regions.
A major challenge in the translation of GWAS evidence into disease mechanism is determining which gene or set of genes at or near an associated LD block are making etiological contributions to disease. Recent systems biology approaches to the study of gene expression regulation demonstrate that chromatin state is an important determinant of gene expression, by rendering specific genomic regions accessible to the transcriptional machinery. Transcription factors in turn provide specificity to gene expression signatures emanating from an accessible locus in particular tissues, resulting in cell-specific repertoires of gene expression. Thus, functionally related genes may be found in physical proximity within the genome, but a given disease-associated locus may contain genes without etiological importance. This aspect of genome biology provides a rationale for assessing functional themes across GWAS loci, providing insight into disease mechanisms and guiding future research efforts by identifying particular genes that could be acting as conduits between association evidence and disease pathogenesis.
Pathway and network analyses are analytic methods that can generate specific mechanistic hypotheses by identifying sets of genes participating in common physiological processes. In order to better understand the biological implications of the AA GWAS statistical evidence, in this study we characterized functional patterns in genes across the GWAS loci by employing pathway analysis, gene ontology (GO) term enrichment analysis, and protein-protein interaction (PPI) network construction.
We first compiled a list of protein coding genes located within a 1Mb window centered on the most significant SNP within each of the 14 GWAS loci (Table 1) using BIOMART in ENSEMBL (Smedley et al., 2015), and identified 225 genes (Supplementary Table 1). We chose to use a 1 Mb window because chromatin capture experiments have identified autoimmune GWAS SNPs located within regions that engage in long-range interactions, interacting with genes, on average, located 118 Kb away. While these loops can range up to 1.5Mb, a window of 1Mb would capture 98% of interactions reported for autoimmune GWAS SNPs (Mifsud et al., 2015). We included the HLA in this analysis, since this locus demonstrates among the most robust and strongest GWAS evidence. Furthermore, while this region of the genome is both gene dense and exhibits long-range LD confounding interpretation of association evidence, these features augment power to detect disease relevant relationships in pathway analyses.
Table 1. AA GWAS loci.
GWAS in AA have implicated 14 genomic loci. For each region, we compiled a list of protein-coding genes within a 1 Mb window centered on the most significant SNP (proxy SNP), identifying a total of 226 genes (Gene Count). Genes that are identified in each of the three analyses presented here are listed in the last three columns.
| Locus | SNP proxy for LD block | SNP position (Hg38) | Arisk | Aalt | P | ORrisk | Gene Count | Pathway Analysis (DAVID) | GO Analysis (DAVID) | Direct Interaction with another AA GWAS gene (DAPPLE) | |
|---|---|---|---|---|---|---|---|---|---|---|---|
| 1p13.2 | rs2476601 | 113,834,946 | A | G | 9.E-08 | 1.34 | 10 | HIPK1, PTPN22, SYT6 | AP4B1, RSBN1 | ||
| 2q13 | rs3789129 | 110,940,463 | A | C | 2.E-08 | 1.31 | 6 | BCL2L11, BUB1 | BUB1 | ||
| 2q33.2 | rs231775 | 203,867,991 | G | A | 2.E-20 | 1.39 | 5 | CD28, CTLA4, ICOS | CD28, CTLA4, ICOS | ABI2 | |
| 4q27 | rs7682481 | 122,602,871 | C | G | 5.E-09 | 1.23 | 8 | IL2, IL21 | ADAD1, FGF2, IL2, IL21, SPATA5 | IL2, IL21 | |
| 5q31.1 | rs848 | 132,660,808 | A | C | 5.E-09 | 1.27 | 21 | HSPA4, IL13, IL4, IL5 | AFF4, GDF9, IL13, IL4, IL5, IRF1, RAD50 | HSPA4, IL13, IL4, IL5, SHROOM1 | |
| 6p21.32 | rs9275524 | 32,707,332 | C | T | 2.E-60 | 1.91 | 26 | HLA-DMA, HLA-DMB, HLA-DOA, HLA-DOB, HLA-DPA1, HLA-DPB1, HLA-DQA1, HLA-DQA2, HLA-DQB1, HLA-DRA, HLA-DRB1, HLA-DRB5, TAP1, TAP2 | BRD2, HLA-DMA, HLA-DMB, HLA-DOA, HLA-DOB, HLA-DPA1, HLA-DPB1, HLA-DQA1, HLA-DQA2, HLA-DQB1, HLA-DRA, HLA-DRB1, HLA-DRB5, NOTCH4, PSMB8, PSMB9, RXRB, TAP1, TAP2 | HLA-DMA, HLA-DMB, HLA-DOA, HLA-DOB, HLA-DQA1, HLA-DQA2, HLA-DQB1, HLA-DRA, HLA-DRB1, HLA-DRB5, PSMB8, TAP1, TAP2 | |
| 6q25.1 | rs12183587 | 150,033,472 | T | G | 6.E-24 | 1.48 | 16 | KATNA1, LATS1, NUP43, PPIL4, RAET1E, RAET1G, RAET1L, ULBP1, ULBP2, ULBP3 | RAET1G, ULBP1 | ||
| 9q31.1 | rs10124366 | 99,925,421 | G | A | 1.E-05 | 1.20 | 5 | ERP44, NR4A3 | ERP44 | ||
| 10p15.1 | rs3118470 | 6,059,750 | C | T | 8.E-21 | 1.40 | 10 | IL15RA, IL2RA, PRKCQ | IL2RA, PRKCQ | IL15RA, IL2RA, RBM17 | |
| 11q13 | rs574087 | 64,335,476 | A | G | 9.E-14 | 1.32 | 35 | NRXN2 | BAD, DNAJC4, ESRRA, FKBP2, MAP4K2, MEN1, OTUB1, RASGRP2, SF1, VEGFB | CDC42BPG, SF1, STIP1 | |
| 11q13.5 | rs2155219 | 76,588,150 | T | G | 4.E-08 | 1.21 | 10 | PRKRIR | |||
| 12q13 | rs2292239 | 56,088,396 | T | G | 4.E-09 | 1.25 | 47 | IL23A, STAT2 | CDK2, DNAJC14, ERBB3, GDF11, IL23A, PA2G4, SARNP, SMARCC2, TIMELESS, WIBG | CD63, CDK2, ERBB3, IL23A, PA2G4, PAN2, RNF41, SMARCC2, STAT2 | |
| 12q24.12 | rs653178 | 111,569,952 | C | T | 2.E-07 | 1.19 | 12 | ATXN2, ERP29, SH2B3 | ATXN2, FAM109A, SH2B3 | ||
| 16p13.13 | rs3862469 | 11,100,223 | C | T | 2.E-07 | 1.21 | 14 | CIITA, SOCS1 | CIITA, PRM1, PRM2, PRM3, SOCS1, TNP2 | SOCS1 | |
For pathway and GO term analyses, the list of protein coding genes at AA GWAS loci was uploaded to the Database for Annotation, Visualization and Integrated Discovery (DAVID) (Huang da et al., 2009). DAVID annotated 207 of the 225 genes, and included them in analyses (Supplementary Table 1). Twenty-seven pathways were then identified that are significantly enriched by genes at AA GWAS loci (Supplementary Table 2). Thirty-one genes from eight loci contributed to this evidence (Table 1 and Supplementary Table 1). All of these pathways involve immune system processes or immune-related diseases. Among these are: Antigen processing and presentation (p=2.6×10⁻¹²), the Co-stimulatory pathway (p=1.3×10⁻⁵), and JAK-STAT signaling (p=9.4×10⁻⁴). It is interesting that one of the highest comorbidities among AA patients is included among enriched disease-related pathways: Autoimmune thyroid disease (p=3.1×10⁻¹⁷). Some pathways with significant evidence for enrichment are not obviously related to disease, if we consider only their title, such as intestinal IgA production (p=3.9×10⁻¹⁹), asthma (p=2.3×10⁻¹⁸), and viral myocarditis (p=1.1×10−09). However, underlying shared biological processes could be driving these results. For example antibody production, Th2 signatures, and innate immune responses are shared respectively between these diseases and AA.
An analysis of GO terms with DAVID revealed 81 biological processes enriched by protein coding genes at AA GWAS loci (Supplementary Table 3). This evidence was driven by 83 genes across all 14 loci (Table 1). Similar to pathway analysis, many immune-related processes were implicated by this analysis, including antigen processing and presentation (GO:0019882; p=9.7×10⁻²¹), regulation of T-cell activation (GO:0050863; p=1.5×10⁻⁵) and differentiation (GO:0045580; p=4.1×10⁻⁴), and regulation of the JAK-STAT signaling cascade (GO:0046425; p=0.01).
Gene mapping in Mendelian disorders has demonstrated that genes underlying the same disease often encode proteins that physically interact. DAPPLE is a computational tool that constructs PPI networks from genes that are associated with complex disease by drawing from curated protein interaction databases (Rossin et al., 2011). DAPPLE identified 46 proteins from 13 AA GWAS loci that physically interact (Table 1). Allowing the program to add in a single connecting protein creates a single highly connected network (p=0.002) of 148 GWAS genes from across all 14 loci (Figure 1; Supplementary Table 1).
Figure 1. PPI network of AA GWAS genes.
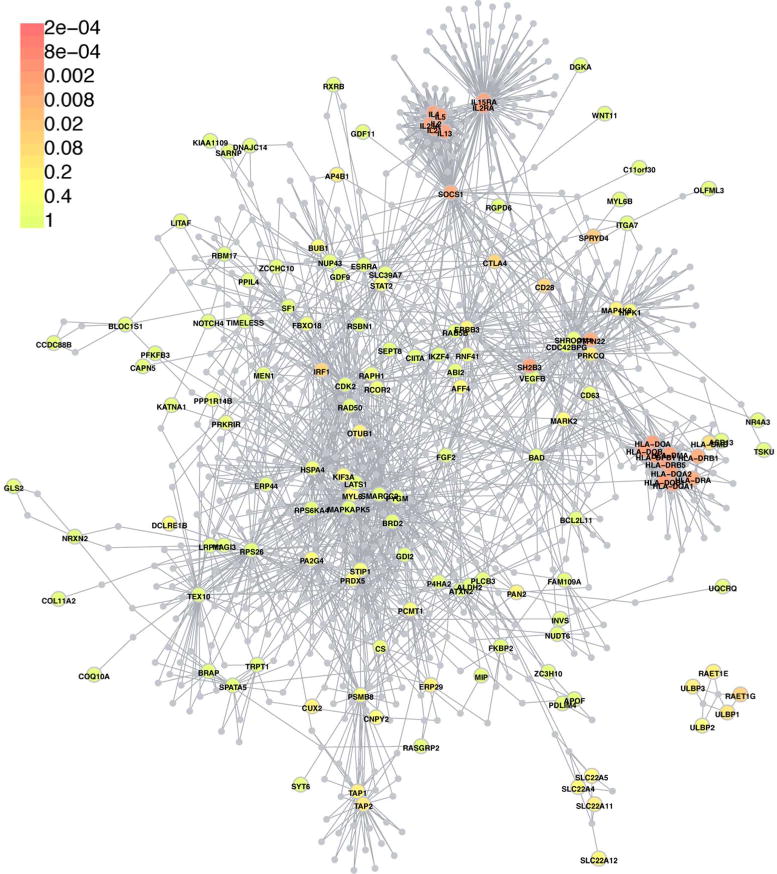
We uploaded 226 AA GWAS genes into DAPPLE, a web-based computer program that identifies protein-protein interactions among sets of genes. Allowing the program to add in a single connecting protein (grey nodes) creates a single highly connected network (p=0.002) of 148 GWAS genes from across all 14 loci, including 46 GWAS genes whose proteins interact directly. Nodes for GWAS genes are color coded to indicate the statistical significance of their connectivity within the network (scale is located in the upper left hand corner). The number of nodes with connectivity that is weakly supported statistically may reflect the relatively small number of loci identified in AA (14), relative to other autoimmune diseases such as Inflammatory Bowel Disease, which has 163 GWAS loci (Jostins et al., 2012).
Since the goal of this study is to identify disease-relevant processes revealed by GWAS evidence, we chose to include the HLA in this analysis. In order to empirically determine the effects of including this gene-dense region in our analysis, we repeated GO term enrichment and pathway analyses in DAVID excluding the HLA and found that p-values were not substantially different for the vast majority of results and our most clinically relevant findings, which support involvement of JAK-STAT signaling and co-stimulatory response, remain significant.
In this study, we used three different analytic techniques to discern etiological processes encoded by GWAS statistical evidence. In identifying enriched pathways, biological processes, and PPIs, 159 of the 225 genes were implicated. Consistent with evidence emerging from systems biology studies in gene expression, our analyses identified multiple genes at each loci (Table 1). The functions of these genes converge on a limited number of immunological pathways and processes, for example, by identifying antigen presentation and T-cell activation/differentiation. Our results additionally underscore contributions from the JAK-STAT signaling and the co-stimulatory pathway. These particular processes are capable of being modulated with available therapeutics, which we are currently studying within the context of clinical trials in AA, using JAK inhibitors and abatacept, respectively. Furthermore, these genes could be useful in our development of a biomarker panel, allowing us to prioritize transcriptional changes that occur over particular disease trajectories and/or during a therapeutic response. Finally, evidence obtained in this study can be integrated with results from next generation sequencing, providing a framework for the interpretation of variants harbored by patients and laying a foundation for precision medicine in AA.
Supplementary Material
Abbreviations used
- AA
alopecia areata
- GWAS
genome-wide association study
- LD
linkage disequilibrium
- GO
gene ontology
- PPI
protein-protein interaction
- DAVID
Database for Annotation, Visualization and Integrated Discovery
Footnotes
This work was performed in New York, NY, US.
Pathway analysis of GWAS loci in alopecia areata
References
- Betz RC, Petukhova L, Ripke S, et al. Genome-wide meta-analysis in alopecia areata resolves HLA associations and reveals two new susceptibility loci. Nat Commun. 2015;6:5966. doi: 10.1038/ncomms6966. [DOI] [PMC free article] [PubMed] [Google Scholar]
- Delamere FM, Sladden MM, Dobbins HM, et al. Interventions for alopecia areata. The Cochrane database of systematic reviews. 2008:CD004413. doi: 10.1002/14651858.CD004413.pub2. [DOI] [PubMed] [Google Scholar]
- Huang da W, Sherman BT, Lempicki RA. Systematic and integrative analysis of large gene lists using DAVID bioinformatics resources. Nature protocols. 2009;4:44–57. doi: 10.1038/nprot.2008.211. [DOI] [PubMed] [Google Scholar]
- Jostins L, Ripke S, Weersma RK, et al. Host-microbe interactions have shaped the genetic architecture of inflammatory bowel disease. Nature. 2012;491:119–24. doi: 10.1038/nature11582. [DOI] [PMC free article] [PubMed] [Google Scholar]
- Mifsud B, Tavares-Cadete F, Young AN, et al. Mapping long-range promoter contacts in human cells with high-resolution capture Hi-C. Nature genetics. 2015;47:598–606. doi: 10.1038/ng.3286. [DOI] [PubMed] [Google Scholar]
- Petukhova L, Duvic M, Hordinsky M, et al. Genome-wide association study in alopecia areata implicates both innate and adaptive immunity. Nature. 2010;466:113–7. doi: 10.1038/nature09114. [DOI] [PMC free article] [PubMed] [Google Scholar]
- Rossin EJ, Lage K, Raychaudhuri S, et al. Proteins encoded in genomic regions associated with immune-mediated disease physically interact and suggest underlying biology. Plos Genet. 2011;7:e1001273. doi: 10.1371/journal.pgen.1001273. [DOI] [PMC free article] [PubMed] [Google Scholar]
- Smedley D, Haider S, Durinck S, et al. The BioMart community portal: an innovative alternative to large, centralized data repositories. Nucleic acids research. 2015 doi: 10.1093/nar/gkv350. [DOI] [PMC free article] [PubMed] [Google Scholar]
- Xing L, Dai Z, Jabbari A, et al. Alopecia areata is driven by cytotoxic T lymphocytes and is reversed by JAK inhibition. Nature medicine. 2014;20:1043–9. doi: 10.1038/nm.3645. [DOI] [PMC free article] [PubMed] [Google Scholar]
Associated Data
This section collects any data citations, data availability statements, or supplementary materials included in this article.