Abstract.
Invasive ductal breast carcinomas (IDBCs) are the most frequent and aggressive subtypes of breast cancer, affecting a large number of Canadian women every year. Part of the diagnostic process includes grading the cancerous tissue at the microscopic level according to the Nottingham modification of the Scarff-Bloom-Richardson system. Although reliable, there exists a growing interest in automating the grading process, which will provide consistent care for all patients. This paper presents a solution for automatically detecting regions expressing IDBC in images of microscopic tissue, or whole digital slides. This represents the first stage in a larger solution designed to automatically grade IDBC. The detector first tessellated whole digital slides, and image features were extracted, such as color information, local binary patterns, and histograms of oriented gradients. These were presented to a random forest classifier, which was trained and tested using a database of 66 cases diagnosed with IDBC. When properly tuned, the detector balanced accuracy, F1 score, and Dice’s similarity coefficient were 88.7%, 79.5%, and 0.69, respectively. Overall, the results seemed strong enough to integrate our detector into a larger solution equipped with components that analyze the cancerous tissue at higher magnification, automatically producing the histopathological grade.
Keywords: computer vision, whole digital slides, histopathology, machine learning, invasive ductal breast carcinoma, cancer
1. Introduction
1.1. Motivation
An estimated 25,000 Canadian women were diagnosed with breast carcinoma in 2015,1 representing the highest incidence of cancer in the female population. Breast carcinomas are most commonly in the invasive ductal form (IDBC),2 which yields an 85% survival rate after five years.3 An important facet of the diagnostic process is evaluating the tumor aggressivity based on the microscopic properties of the tissue, as performed by a pathologist. To this end, cases expressing IDBC are assessed using the Nottingham modification of the Scarff-Bloom-Richardson (SBR) grading system, which has become the standard for pathologists since 2002 after being recommended by the International Union against Cancer4 and the World Health Organization.5 It has had success due to its objective nature and strong correlation with patient prognoses.6 Despite its strict guidelines, inter-rater variability has been thoroughly investigated using the SBR grading system.7–10 However, a recent study that included 732 pathologists reported that 8.3% of raters had an agreement rate of ;10 therefore, the system can be improved upon.
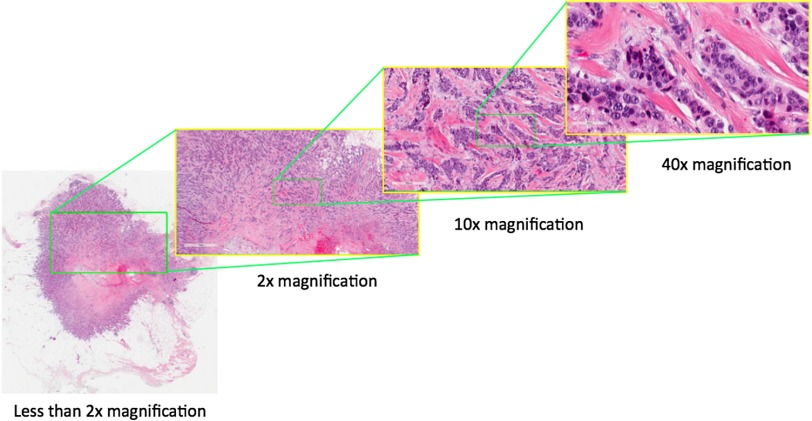
Automating the process through software would reduce inter-rater variability and ensure more consistent results to the benefit of the patients. Recent technological advances have made this possible, notably with the advent of digital pathology. Slide scanners have been the basis of this because they produce very large images of microscopic tissue, commonly referred to as whole digital slides (Fig. 1). This paper proposes a solution for the first step in the automation process: detecting IDBC in whole digital slides.
Fig. 1.
An example of a whole digital slide. At magnification, this file contains and three color channels, for a total size of 8.95 gigabytes uncompressed.
1.2. Background
Fully automated histopathological grading systems are not yet clinically available; however, researchers have been working toward this end. Some have departed from the prognostic factors traditionally analyzed by pathologists and are leveraging machine learning techniques to find new factors for tumor classification. For example, Beck et al.11 have found that certain features relevant for their automated classifier were previously assumed to be irrelevant by pathologists. Therefore, such techniques may provide a deeper understanding of malignancy.
Conversely, methods that more faithfully replicate the workflow of a pathologist will undoubtedly encounter fewer barriers to clinical use. The strategy would be to first automatically segment IDBC from whole digital slides and subsequently analyze the cancerous tissue according to the SBR grading system (Fig. 2). One research group, in particular, has produced a peer-reviewed paper for every step required for accomplishing this goal, from finding areas of interest12 to the tissue analysis.13,14
Fig. 2.
Automating the SBR grading system would first require a segmentation of the cancerous areas followed by an analysis of the cellular properties of the tissue.
Finding areas of interest can be challenging due to the overwhelming size of whole digital slides. To overcome this, researchers often tessellate the whole digital slide into a rectangular grid of independent areas. Although simple, the tessellation arbitrarily splits the slide image, which may have the effect of distorting important pathological features. To further lower computational time, methods either sample a subset of the rectangular areas12 or reduce the magnification level during analysis.15,16 The former may be undesirable for clinical applications since the omitted areas may contain information that would ultimately affect tumor classification. Similarly, the latter technique may lead to a misinterpretation of the data due to the reduced magnification. Despite the potential flaws, researchers have developed IDBC detectors with very favorable results.
1.3. Our Solution
Our paper presents a method for achieving the first step of the process as seen in Fig. 2, that is, automatically finding areas expressing IDBC within whole digital slides. Our approach most resembles a design recently proposed by Cruz-Roa et al.16 while additionally addressing two of the common weaknesses described in Sec. 1.2. First, a grid with malleable borders replaces the rectangular tessellation. This generates areas that attempt to encapsulate consistent pathological features. Second, our method is shown to be robust against a wide range of magnification levels.
Our broad strategy was to find areas where cells proliferated chaotically within the whole digital slide. Although disorganized cell growth is a strong indicator of IDBC, we acknowledge that other types of cancer also fit this criterion. For example, ductal carcinomas in situ (DCIS), which are often co-expressed with IDBC, share similar cellular traits with IDBC. Although detecting DCIS would not be strictly wrong, its grading process does not follow the SBR system and should therefore be omitted in the final segmentation.
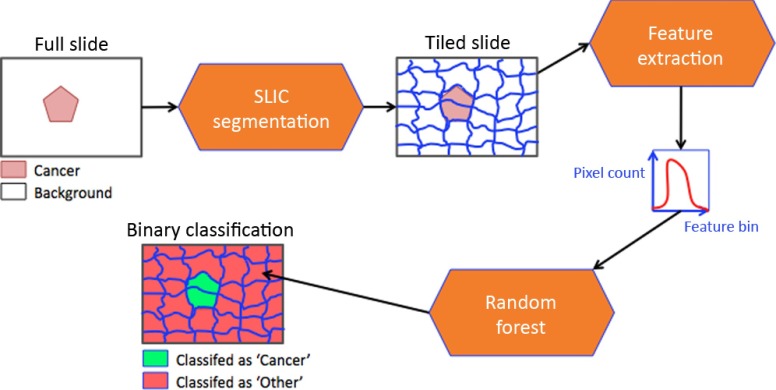
Despite this limitation, our solution successfully detects IDBC in whole digital slides. Briefly, the images are first tessellated using the simple linear iterative clustering (SLIC) segmentation technique,17 grouping homogeneous regions into a single tile. As opposed to other segmentation methods in digital pathology,12,15,16,18,19 the tessellation was not constrained to a rectangular grid, but followed the borders of objects in the image. Next, the resulting tiles were represented by image features describing their color and textural information. Finally, the image features were used to train and test a random forest (RF) classifier, which determined if a given image tile expressed IDBC (Fig. 3). The astounding size of digital slides imposed a heavy computational load on our design, which was overcome by exploiting cloud computing, more specifically using Amazon Web Services’ m1.xlarge ec2 instances. (The term “instances” is used by Amazon to describe the type of cloud computer.) This heightened capability permitted cases to be resolved in less than an hour.
Fig. 3.
System overview.
Generally speaking, the detector performed reasonably well compared to competing methods when trained on 50 cases and tested on 16. Despite some errors, our design faithfully indicated regions expressing IDBC as labeled by a pathologist. Therefore, our approach could realistically be integrated into a larger solution designed to actually automatically grade IDBC according to the SBR system.
2. Methods
2.1. Datasets
To the best of our knowledge, no freely available database of IDBC slides exists; therefore, it was necessary to create our own. First, glass slides from 66 cases of breast mastectomies were retrieved from the McGill University Hospital Centre pathology registry (study 3229). There was a variable number of slides per case, most often exceeding 20. Retaining all of the slides would have been superfluous for the purpose of our project; therefore, a pathologist selected one slide per case, chosen to maximize the tumor expression in each slide. In the third step, digital reproductions of the slides were created using the Aperio Scanscope AT Turbo slide scanner at magnification with a resolution of 0.2485 microns per pixel. Finally, a pathologist annotated tissues of interest on every slide using the Imagescope software (Aperio Imagescope v11.1.2.760).
Our dataset can be considered small since the number of instances (66 cases of IDBC) is overshadowed by the amount of data per case (an average of 1.5 gigabytes per whole digital slide when compressed). Additionally, the dataset is unbalanced since different pathological entities covered irregularly large areas of the image. Both of these attributes were considered during the design process (Sec. 2.4).
2.2. Tiling Whole Digital Slides Using Simple Linear Iterative Clustering Segmentation
The first step of our solution was to tessellate the whole digital slides into more manageable subsets, allowing us to analyze each one independently. To accomplish this, the image was tiled nonuniformly. This computational process required that the tiles have malleable borders, permitting them to follow the tissue boundaries or other histopathological structures in the images. This step essentially required a region segmentation method applied to the entire digital slide. One such method is the SLIC superpixel (SP) method.17 The SLIC algorithm groups similar pixels in the image, forming larger region segments with shapes that reflect the objects within the image.20–22
For our project, we employed the Images and Visual Representation Group version of the SLIC software. From our experience with this software, we have found that a superpixel size of 10,000 pixels and compactness factor of 30 was ideal for our dataset. This was determined by optimizing the boundary recall rates and the reconstruction error on our data. (For the sake of brevity, we do not demonstrate this validation step in the current paper. Interested readers are referred to the original thesis.23)
2.3. Representing Image Tiles Using Chrominance and Textural Features
Superpixels provided a coherent tiling of the whole digital slide. Reaching the ultimate objective also required determining which superpixels were positive for cancer. To accomplish this, we transformed the image representation of each superpixel into a feature space based on chrominance and texture. Since both the shape and size of the superpixels vary, we focused on features that could be represented by histograms. When properly normalized, two areas of different size (i.e., superpixels) that express similar patterns should yield similar histograms.
More specifically, we sought a combination of image features that could describe a variety of histopathological tissue patterns. The data were represented by the two color spaces, the RGB and CIELab,24 and one gray-scale color channel. Within every color space, chrominance features are obtained using color histograms.25,26 Next, textural features are computed using rotation-invariant local binary patterns (LBPs)27–29 over a wide range of radii. Finally, edge information is characterized by histograms of oriented gradients (HOG).30–33 This combination of descriptors provides 16,128 features per superpixel, as described in Table 1.
Table 1.
A given tile, or superpixel, was represented by (b) seven color channels. Every channel contained (a) 2304 features, giving (c) 16,128 features for all seven channels.
| (a) | ||
| Feature | Radius | # of bins |
| LBP | 1 | 256 |
| LBP | 2 | 256 |
| LBP | 3 | 256 |
| LBP | 4 | 256 |
| LBP | 5 | 256 |
| LBP | 10 | 256 |
| LBP | 20 | 256 |
| HOG magnitude | — | 256 |
| HOG orientation | — | 256 |
| Color | — | 256 |
|
Total |
— |
2304 |
| (b) | ||
| Color space | # of channels | |
| RGB | 3 | |
| Lab | 3 | |
| Gray scale | 1 | |
|
Total |
7 | |
| (c) | ||
| # of channels | 7 | |
| # of bins per channel | 2304 | |
| # of features per superpixel | 16,128 | |
2.4. Decision Making with Random Forests
So far we have presented methods for splitting digital slides into meaningful tiles using SLIC segmentation and defining them mathematically using features. The final step requires a classifier to decide whether or not a given image tile indicates cancer. We used an RF classifier34,35 for this purpose (Table 2).
Table 2.
Description of the input parameters for RF classifiers.
| Parameter | Description |
|---|---|
| The number of decision trees in the RF. | |
| The maximum depth of every decision tree. | |
| The number of features tested at every node during the training process. The feature that best splits the data will be retained for classification purposes. | |
| Output probabilities above this threshold will be considered positive for IDBC. |
There are several advantages to RFs, and many of them are of great interest to the application discussed in this paper. First, the overall performance of an RF is competitive with other state-of-the-art methods. They can also process a large number of features elegantly without explicitly reducing the dimension of the space, which is vital when dealing with the uncommonly large number of features required in our design. Another significant advantage is that RFs report the most important features for classifying the data, thereby permitting a clear understanding of how the classifier has reached its decision. Finally, the RF classifier has proven to be effective when dealing with unbalanced datasets,35 which is also very important since our dataset does not contain equal amounts of healthy and cancerous tissue, as discussed in Sec. 2.1.
2.5. Assessing the Classifier Performance Using Cross-Validation
In Sec. 2.4, we have introduced a technique for automatically classifying data based on a training set. It is also necessary to measure the classifier performance for the purposes of validation and optimization. Our approach produces a binary classification, thereby distinguishing IDBC from all other histopathological tissue types. Comparing the classification results to the ground truth as provided by expert pathologists introduces four possible outcomes (Table 3). In certain cases, the superpixel boundaries did not always coincide with the ground truth annotations and could therefore contain a mix of negative and positive labels. To resolve this conflict, the final label for a given superpixel was determined by majority vote.
Table 3.
The four possible outcomes of binary classification.
| Ground truth label: IDBC | Ground truth label: Other | |
|---|---|---|
| Detector result: IDBC | True positive (TP) | False positive (FP) |
| Detector result: Other | False negative (FN) | True negative (TN) |
To characterize the system behavior, we used several measures of accuracy. First, the sensitivity [Eq. (1)], specificity [Eq. (2)], balanced accuracy (BAC)36 [Eq. (3)], and F1 score37 [Eq. (4)] were useful for evaluating how the system performed as a binary detector. Dice’s similarity coefficient (DSC)38,39 [Eq. (5)] was employed to measure how the system segmented regions of interest. As described in Eq. (5), a perfect overlap of two regions A and B will yield a coefficient of 1.
| (1) |
| (2) |
| (3) |
| (4) |
| (5) |
We note that measuring a detector’s performance may be biased by the selection of test cases as well as the actual training and testing cases available. To compensate for this, we employed -fold cross-validation40 and ensured that no case was tested more than once.
2.6. Selection of Parameters
The proposed detector was substantiated through rigorous testing on our dataset, which consisted of 66 cases diagnosed with IDBC. However, before proceeding to this step, it was necessary to select the seven input parameters associated with our method. To recapitulate, the whole digital slide was first sampled at a given magnification () and subsequently tessellated using the SLIC algorithm, which required setting the superpixel size () and compactness factor (). Although feature extraction did not require parameter selection, the RF classifier depended on the parameters , , , and . In this paper, we will demonstrate the process only for validating the image magnification (), although this same procedure was repeated for the other six parameters.23
Selecting the image magnification was important since it directly affected the computation time. For this reason, it was necessary to examine the effect of image magnification on the classification result. To this end, classifiers were trained and tested by sampling the whole digital slides at , , and magnifications. Comparing the classifier performance at different magnifications may be flawed due to the inherent randomness associated with the SLIC tessellation process. To overcome this issue, we designed an experiment where the superpixels at all three magnifications covered identical tissue areas and the data that were passed to the classifier differed only in their image resolution. To achieve this, the tessellation at was projected onto the slide at and magnifications. Four RFs per magnification, described in Table 4, were trained on six randomly selected cases and subsequently tested on another six.
Table 4.
The parameters used for testing the effect of image magnification on the classifier performance.
| Test name | |||||
|---|---|---|---|---|---|
| Test 1 | 10,000 | 30 | 500 | 50 | 200 |
| Test 2 | 10,000 | 30 | 500 | 50 | 500 |
| Test 3 | 10,000 | 30 | 500 | 75 | 200 |
| Test 4 | 10,000 | 30 | 500 | 75 | 500 |
2.7. Validation
Once the input parameters were selected (Table 5), the algorithm was then tested using our entire dataset. We performed -fold cross-validation40 using 7, 28, and 50 training cases. Cross-validation with 7 and 28 training cases required two folds each and could be sensitive to the separation of the cases. Therefore, we repeated the validation process five times to measure whether the results varied with respect to the random assignment of cases into both folds.
Table 5.
The parameters used for the cross-validation of 66 cases of IDBC.
| 10,000 | 30 | 200 | 50 | 400 |
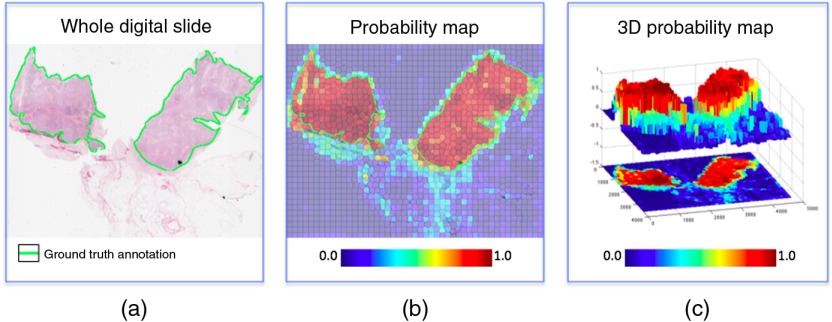
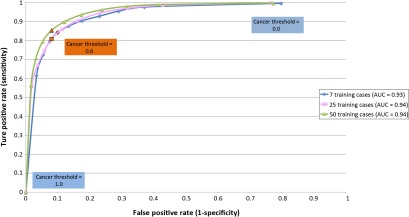
Additionally, we produced a receiver operating characteristics (ROC) curve41 for the parameter . More specifically, the RFs computed the probability that a region was positive for cancer, and any result above the confidence threshold was considered positive (Fig. 4). Changing directly affects the decisions made by the detector. Therefore, the ROC curve permitted us to determine the optimal value of , while the area under the ROC curve (AUC) quantified the overall classifier performance.
Fig. 4.
RFs output a probability map of IDBC. The cancer confidence threshold dictates at what probability level a given region is considered to be positive. (a) An example of a whole digital slide at low magnification. (b) The output of the classifier is a probability map of IDBC expression. (c) The probability map can be viewed as a series of peaks and valleys. The confidence threshold dictates the minimal peak elevation considered for classifying an area as IDBC.
Finally, we compared the effects of tessellating whole digital slides into a square grid versus superpixels. Therefore, we repeated the -fold cross-validation with 50 training cases where all whole digital slides were broken into subimages.
3. Results
3.1. Effect of Image Magnification on the Classifier
As reported in Table 6, increasing the magnification from to produced no significant improvement in terms of BAC, a 3% improvement for the F1 score, and a 0.06 improvement in terms of DSC. Considering the amount of supplementary data analyzed, increasing the magnification produced minor improvements. We assume that this was a testament to the large variety of features used to describe the tissue. For example, the radii of the LBP codes ranged from 1 to 20 pixels; therefore, it was capable of capturing the same phenomena at different scales.
Table 6.
The effect of magnification on the detector’s performance.
| Sensitivity | |||
| Specificity | |||
| BAC | |||
| F1 score | |||
| DSC |
3.2. Testing the Design on a Large Database of Cases
The cross-validation results are summarized in Table 7. The classifier performed reasonably well and demonstrated similar metrics as in Ref. 16, although both methods could not be directly compared since they were tested on different data and no publicly available dataset currently exists. Moreover, tessellating the digital slides using superpixels as opposed to a square grid improved all metrics. Interestingly, the gains achieved through superpixel tessellation were slightly greater than when increasing the magnification to (Table 6).
Table 7.
Cross-validation results using 66 cases of IDBC. “Square” indicates experiments in which the superpixels were replaced by a square grid.
| — | — | — | Square | Ref. 16 | |
| # of training cases | 7 | 28 | 50 | 50 | 84 |
| # of folds | 2 | 2 | 5 | 5 | — |
| 0.6 | 0.6 | 0.6 | 0.7 | — | |
| Sensitivity | — | ||||
| Specificity | — | ||||
| AUC | 0.93 | 0.94 | 0.95 | 0.95 | — |
| BAC | 84.23% | ||||
| F1 score | 71.80% | ||||
| DSC | — |
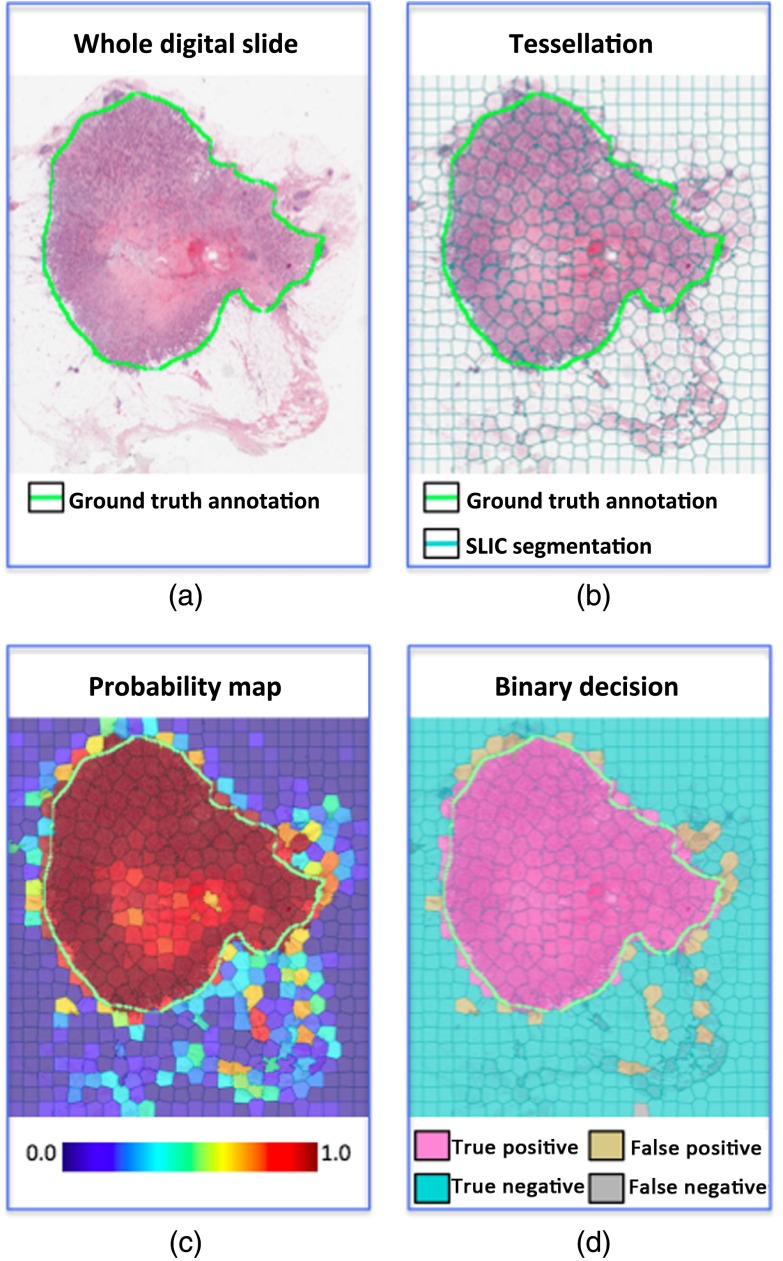
Finally, as would be expected, increasing the number of training cases seemed to improve all performance metrics (Table 7), including the AUC values (Fig. 5). However, this does not address the issue of whether failure modes exist that could not be overcome by using additional training cases. This required a careful visual inspection of the actual results. To recapitulate, analysis of the image colors and textures was essentially designed to find epithelial cells that proliferated in a disorganized pattern. For the most part, this strategy effectively recreated the ground truth annotations, as dictated by expert pathologists (Fig. 6).
Fig. 5.
The ROC curve with respect to . The classifier performed slightly better as the number of training cases increased, as demonstrated by the AUC values.
Fig. 6.
An example of the IDBC detector output, using 50 training cases: (a) the original whole digital slide, (b) tessellation using SLIC segmentation, (c) the probability map of cancer, and (d) the final decision with an of 0.6%.
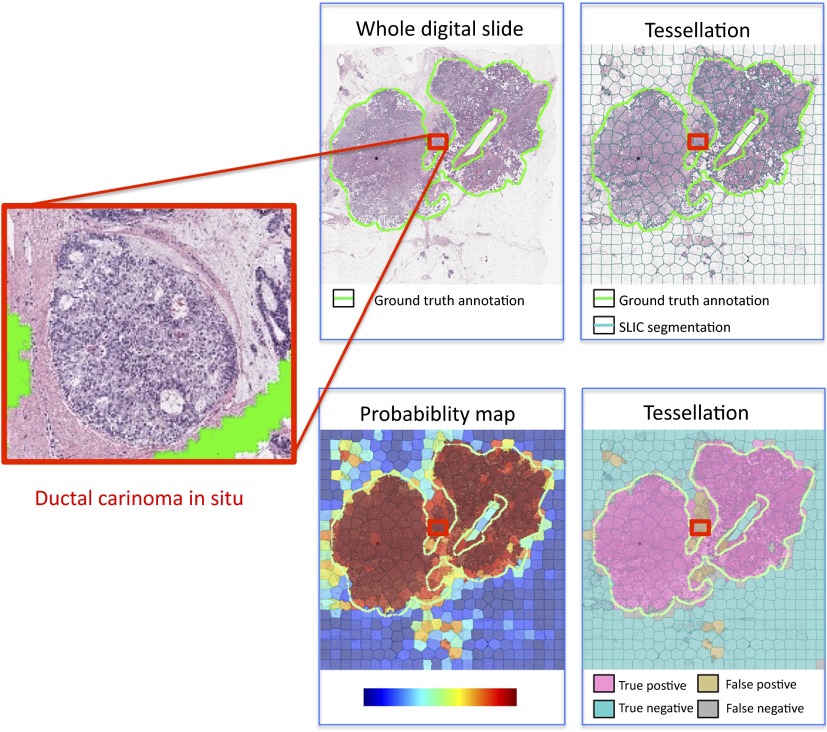
However, the cellular architecture in IDBC also bears a resemblance to other histopathological entities, such as DCIS. Differentiating these two would require more information than what is currently analyzed by the detector. This produced areas in the image that were actually seen to express DCIS but were misclassified as IDBC (Fig. 7). This illustrates that an analysis system of the type discussed in this paper would be suitable for selecting specific areas in the digital slide for a more detailed examination. This second step would then permit analysis for DCIS on a cellular basis. Indeed, this was the actual goal of our research.
Fig. 7.
An example of a false positive result occurring in a region expressing DCIS: (a) the original whole digital slide, (b) tessellation using SLIC segmentation, (c) the probability map of cancer, and (d) the final decision with an of 0.6%.
4. Conclusion
4.1. Summary
The solution proposed in this paper performed consistently over different magnifications and tessellation resolutions. Therefore, any future application using our framework could potentially adjust these parameters to fit their own specific needs without depreciating the performance. Furthermore, the overall solution can be easily applied to other cancer types simply by changing the training data. This is a testament to the image features used for the analysis, which is able to successfully characterize and detect the differences among different tissue types.
On the other hand, several design choices introduced limitations. First, and perhaps foremost, the tessellation process, which imparted many advantages, unfortunately required heavy computational power, which was accessible only using cloud computing. Therefore, our approach could not easily be reproduced with conventional computers. Researchers who do not have the necessary hardware can either modify the SLIC SP algorithm or employ a rectangular tessellation. Unfortunately, the latter would incur a performance hit to the system. Second, analyzing the RGB color space is recommended only in conjunction with highly controlled histopathological and imaging procedures, due to a lack of color normalization in the space. Finally, the solution was verified only on slides where IDBC was very prominent. The detector was not tested to determine whether it was capable of finding small foci of IDBC.
4.1.1. Summary of the results
The method proposed in this paper depends on an initial parameter selection, which we obtained by experimentation. Given this initial procedure, we were able to successfully discover the areas expressing IDBC with a BAC of 88.7%, an F1 score of 79.5%, and a DSC of 0.69. Performance was improved by employing superpixel tessellation compared to a rectangular grid. The superpixels had a tendency to group similar histopathological patterns and followed the edges of the tumors. Moreover, increasing the magnification produced a meager performance gain considering the additional computation burden it imposed. Therefore, researchers can leverage this robustness to significantly reduce computation time.
A close inspection of the results indicates certain common modes of failure, notably in terms of the false positive rate. Generally, the classifier responded strongly to areas where epithelial cells proliferated in a disorganized fashion. Although this is a significant characteristic of IDBC, other histopathological entities sometimes expressed similar traits. For example, DCIS differs from IDBC only in the specific locations in which the cells proliferate with respect to the breast ducts. Otherwise, both manifest similar nuclear morphology and cellular properties. Therefore, distinguishing the two would be difficult given only color and texture image features. Future improvements should include a subsequent step that distinguishes IDBC from other unhealthy tissues in order to further reduce the false positive rates.
4.2. Toward a Clinical Application
The results produced for this paper were more than satisfactory for our ultimate objective. Automatically grading IDBC would require additional components that measure nuclear pleomorphism, tubule formation, and mitosis (Fig. 2).
We believe that automated histopathological grading will eventually benefit patients in several ways. It can alleviate the workload in large pathological centers, or alternatively provide a solution for areas lacking trained pathologists, such as in the developing world. All the while, it will produce results that are consistent and unbiased, providing uniform care for all patients.
Acknowledgments
We would like to thank Susan for her tremendous help, McGill University, the Centre for Intelligent Machines, and the Henry C Witelson Laboratory for making this research possible.
Biographies
Matthew Balazsi received his BEng and MEng degrees in electrical and computer engineering from McGill University, Montreal, in 2008 and 2014 respectively. He is currently the founder of Medical Parachute, a company that offers cloud-based data management and analytical tools for medical researchers.
Paula Blanco is a staff pathologist at The Ottawa Hospital, Ottawa, Ontario, Canada and an assistant professor of Pathology and Laboratory Medicine at the University of Ottawa. She is also the current Undergraduate Program Director for pathology at the University of Ottawa in Ottawa, Ontario, Canada.
Pablo Zoroquiain is an assistant professor in the Department of Pathology at Pontificia Universidad Catolica de Chile, Santiago, Chile, where he completed his residency in anatomical pathology. He is currently pursuing a clinical and research fellowship in ocular pathology at McGill University, Montreal. During his fellowship, he has received 3 awards from McGill University and Cedars Cancer Institute. He is the author of 30 publications and has been the guest speaker in several international meetings.
Martin D. Levine received his BEng and MEng degrees in electrical and computer engineering from McGill University, Montreal, in 1960 and 1963, respectively, and his PhD in electrical engineering from the Imperial College of Science and Technology, University of London, London, England, in 1965. He is currently a professor in the Department of Electrical and Computer Engineering, McGill University, and served as the founding director of the Center for Intelligent Machines from 1986 to 1998.
Miguel N. Burnier Jr. was the chairman of the Department of Ophthalmology, McGill University from 1993 to 2008. He is currently a full professor of ophthalmology, pathology, medicine, and oncology at McGill, and he was the Thomas O. Hecht Family Chair in Ophthalmology (1996 to 2012). He is currently the general director of Clinical Research of the McGill University Health Centre Research Institute. He is author and coauthor of over 500 publications, including 300 peer-reviewed papers.
References
- 1.Canadian Cancer Society’s Avisory Committee on Cancer Statistics, Canadian Cancer Statistics 2015, Statistics Canada, Toronto, Ontario: (2015). [Google Scholar]
- 2.Eheman C. R., et al. , “The changing incidence of in situ and invasive ductal and lobular breast carcinomas: United States, 1999-2004,” Cancer Epidemiol. Biomarkers Prev. 18, 1763–1769 (2009). 10.1158/1055-9965.EPI-08-1082 [DOI] [PubMed] [Google Scholar]
- 3.Arpino G., et al. , “Infiltrating lobular carcinoma of the breast: tumor characteristics and clinical outcome,” Breast Cancer Res. 6(3), R149–156 (2004). 10.1186/bcr767 [DOI] [PMC free article] [PubMed] [Google Scholar]
- 4.Union for International Cancer Control, Classification of Malignant Tumors, Wiley, New York: (2002). [Google Scholar]
- 5.World Health Organization, International Histological Classification of Tumours. Histologic Types of Breast Tumours, World Health Organization, Geneva: (2002). [Google Scholar]
- 6.Rakha E. A., et al. , “Prognostic significance of Nottingham histologic grade in invasive breast carcinoma,” J. Clin. Oncol. 26, 3153–3158 (2008). 10.1200/JCO.2007.15.5986 [DOI] [PubMed] [Google Scholar]
- 7.Dalton L. W., Page D. L., Dupont W. D., “Histologic grading of breast carcinoma. a reproducibility study,” Cancer 73, 2765–2770 (1994). 10.1002/(ISSN)1097-0142 [DOI] [PubMed] [Google Scholar]
- 8.Frierson H. F., et al. , “Interobserver reproducibility of the Nottingham modification of the Bloom and Richardson histologic grading scheme for infiltrating ductal carcinoma,” Am. J. Clin. Pathol. 103, 195–198 (1995). 10.1093/ajcp/103.2.195 [DOI] [PubMed] [Google Scholar]
- 9.Robbins P., et al. , “Histological grading of breast carcinomas: a study of interobserver agreement,” Hum. Pathol. 26, 873–879 (1995). 10.1016/0046-8177(95)90010-1 [DOI] [PubMed] [Google Scholar]
- 10.Fanshawe T. R., et al. , “Assessing agreement between multiple raters with missing rating information, applied to breast cancer tumour grading,” PLoS One 3(8), e2925 (2008). 10.1371/journal.pone.0002925 [DOI] [PMC free article] [PubMed] [Google Scholar]
- 11.Beck A. H., et al. , “Systematic analysis of breast cancer morphology uncovers stromal features associated with survival,” Sci. Transl. Med. 3(108), 108ra113 (2011). 10.1126/scitranslmed.3002564 [DOI] [PubMed] [Google Scholar]
- 12.Veillard A., Lomnie N., Racoceanu D., “An exploration scheme for large images: application to breast cancer grading,” in 20th Int. Conf. on Pattern Recognition, pp. 3472–3475 (2010). 10.1109/ICPR.2010.848 [DOI] [Google Scholar]
- 13.Veillard A., Bressan S., Racoceanu D., “SVM-based framework for the robust extraction of objects from histopathological images using color, texture, scale and geometry,” in 11th Int. Conf. on Machine Learning and Applications, Vol. 1, pp. 70–75 (2012). 10.1109/ICMLA.2012.21 [DOI] [Google Scholar]
- 14.Roux L., et al. , “Mitosis detection in breast cancer histological images. An ICPR 2012 contest,” J. Pathol. Inform. 4, 8 (2013). 10.4103/2153-3539.112693 [DOI] [PMC free article] [PubMed] [Google Scholar]
- 15.Doyle S., et al. , “A boosting cascade for automated detection of prostate cancer from digitized histology,” Lect. Notes Comput. Sci. 4191, 504–511 (2006). 10.1007/11866763 [DOI] [PubMed] [Google Scholar]
- 16.Cruz-Roa A., et al. , “Automatic detection of invasive ductal carcinoma in whole slide images with convolutional neural networks,” Proc. SPIE 9041, 904103 (2014). 10.1117/12.2043872 [DOI] [Google Scholar]
- 17.Achanta R., et al. , “SLIC superpixels compared to state-of-the-art superpixel methods,” IEEE Trans. Pattern Anal. Mach. Intell. 34(11), 2274–2282 (2012). 10.1109/TPAMI.2012.120 [DOI] [PubMed] [Google Scholar]
- 18.Kothari S., et al. , “Biological interpretation of morphological patterns in histopathological whole-slide images,” in Proc. of the ACM Conf. on Bioinformatics, Computational Biology and Biomedicine, pp. 218–225, ACM, New York: (2012). [DOI] [PMC free article] [PubMed] [Google Scholar]
- 19.Kalkan H., et al. , “Automated colorectal cancer diagnosis for whole-slice histopathology,” Lect. Notes Comput. Sci. 7512, 550–557 (2012). 10.1007/978-3-642-33454-2 [DOI] [PubMed] [Google Scholar]
- 20.Rodriguez-Telles F., Abril Torres-Mendez L., Martinez-Garcia E., “A fast floor segmentation algorithm for visual-based robot navigation,” in Int. Conf. on Computer and Robot Vision, pp. 167–173 (2013). 10.1109/CRV.2013.40 [DOI] [Google Scholar]
- 21.Sahli S., Lavigne D. A., Sheng Y., “Saliency region selection in large aerial imagery using multiscale SLIC segmentation,” Proc. SPIE 8360, 83600D (2012). 10.1117/12.919535 [DOI] [Google Scholar]
- 22.Namburete A., Noble J., “Fetal cranial segmentation in 2D ultrasound images using shape properties of pixel clusters,” in IEEE 10th Int. Symp. on Biomedical Imaging, pp. 720–723 (2013). 10.1109/ISBI.2013.6556576 [DOI] [Google Scholar]
- 23.Balazsi M., “An automated approach for segmenting regions containing invasive ductal breast carcinomas in whole digital slides,” Master’s Thesis, McGill University, Montreal, Quebec, Canada (2014). [Google Scholar]
- 24.Connolly C., Fleiss T., “A study of efficiency and accuracy in the transformation from RGB to CIELAB color space,” IEEE Trans. Image Process. 6, 1046–1048 (1997). 10.1109/83.597279 [DOI] [PubMed] [Google Scholar]
- 25.Han J., Ma K.-K., “Fuzzy color histogram and its use in color image retrieval,” IEEE Trans. Image Process. 11, 944–952 (2002). 10.1109/TIP.2002.801585 [DOI] [PubMed] [Google Scholar]
- 26.Ferman A., Tekalp A., Mehrotra R., “Robust color histogram descriptors for video segment retrieval and identification,” IEEE Trans. Image Process. 11, 497–508 (2002). 10.1109/TIP.2002.1006397 [DOI] [PubMed] [Google Scholar]
- 27.Pietikinen M., “Image analysis with local binary patterns,” Lect. Notes Comput. Sci. 3540, 115–118 (2005). 10.1007/b137285 [DOI] [Google Scholar]
- 28.Lindahl T., “Study of local binary patterns,” Master’s Thesis, Linkping University, Department of Science and Technology (2007). [Google Scholar]
- 29.Guo Z., Zhang L., Zhang D., “Rotation invariant texture classification using LBP variance (LBPV) with global matching,” Pattern Recognit. 43(3), 706–719 (2010). 10.1016/j.patcog.2009.08.017 [DOI] [Google Scholar]
- 30.Dalal N., Triggs B., “Histograms of oriented gradients for human detection,” in IEEE Computer Society Conf. on Computer Vision and Pattern Recognition, Vol. 1, pp. 886–893 (2005). 10.1109/CVPR.2005.177 [DOI] [Google Scholar]
- 31.Zhu Q., et al. , “Fast human detection using a cascade of histograms of oriented gradients,” in IEEE Computer Society Conf. on Computer Vision and Pattern Recognition, Vol. 2, pp. 1491–1498 (2006). 10.1109/CVPR.2006.119 [DOI] [Google Scholar]
- 32.Dniz O., et al. , “Face recognition using histograms of oriented gradients,” Pattern Recognit. Lett. 32(12), 1598–1603 (2011). 10.1016/j.patrec.2011.01.004 [DOI] [Google Scholar]
- 33.Newell A., Griffin L., “Multiscale histogram of oriented gradient descriptors for robust character recognition,” in Int. Conf. on Document Analysis and Recognition, pp. 1085–1089 (2011). 10.1109/ICDAR.2011.219 [DOI] [Google Scholar]
- 34.Breiman L., “Random forests,” Mach. Learn. 45, 5–32 (2001). 10.1023/A:1010933404324 [DOI] [Google Scholar]
- 35.Verikas A., Gelzinis A., Bacauskiene M., “Mining data with random forests: a survey and results of new tests,” Pattern Recognit. 44(2), 330–349 (2011). 10.1016/j.patcog.2010.08.011 [DOI] [Google Scholar]
- 36.Brodersen K., et al. , “The balanced accuracy and its posterior distribution,” in 20th Int. Conf. on Pattern Recognition, pp. 3121–3124 (2010). 10.1109/ICPR.2010.764 [DOI] [Google Scholar]
- 37.Powers D. M. W., “Evaluation: from precision, recall and F-measure to ROC, informedness, markedness & correlation,” J. Mach. Learn. Technol. 2(1), 37–63 (2011). [Google Scholar]
- 38.Han X., Fischl B., “Atlas renormalization for improved brain MR image segmentation across scanner platforms,” IEEE Trans. Med. Imaging 26, 479–486 (2007). 10.1109/TMI.2007.893282 [DOI] [PubMed] [Google Scholar]
- 39.Zou K. H., et al. , “Statistical validation of image segmentation quality based on a spatial overlap index: scientific reports,” Acad. Radiol. 11(2), 178–189 (2004). 10.1016/S1076-6332(03)00671-8 [DOI] [PMC free article] [PubMed] [Google Scholar]
- 40.Kohavi R., “A study of cross-validation and bootstrap for accuracy estimation and model selection,” in Proc. of the 14th Int. Joint Conf. on Artificial Intelligence, Vol. 2, pp. 1137–1143, Morgan Kaufmann Publishers Inc., San Francisco, California: (1995). [Google Scholar]
- 41.Fawcett T., “An introduction to ROC analysis,” Pattern Recognit. Lett. 27(8), 861–874 (2006). 10.1016/j.patrec.2005.10.010 [DOI] [Google Scholar]


