

Summary
Antiangiogenic drugs are used clinically for treatment of renal cell carcinoma (RCC) as a standard first-line treatment. Nevertheless, these agents primarily serve to stabilize disease, and resistance eventually develops concomitant with progression. Here, we implicate metabolic symbiosis between tumor cells distal and proximal to remaining vessels as a mechanism of resistance to antiangiogenic therapies in patient-derived RCC orthoxenograft (PDX) models and in clinical samples. This metabolic patterning is regulated by the mTOR pathway, and its inhibition effectively blocks metabolic symbiosis in PDX models. Clinically, patients treated with antiangiogenics consistently present with histologic signatures of metabolic symbiosis that are exacerbated in resistant tumors. Furthermore, the mTOR pathway is also associated in clinical samples, and its inhibition eliminates symbiotic patterning in patient samples. Overall, these data support a mechanism of resistance to antiangiogenics involving metabolic compartmentalization of tumor cells that can be inhibited by mTOR-targeted drugs.
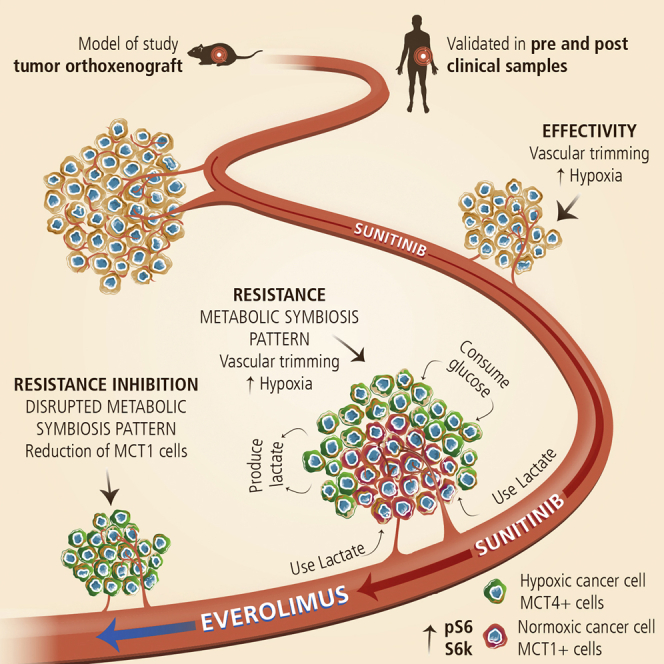
Graphical Abstract
Highlights
-
•
Resistance to antiangiogenic therapy involves metabolic symbiosis patterning in RCC
-
•
mTOR pathway mediates this resistance and mTOR inhibition blocks metabolic symbiosis
-
•
In patients, antiangiogenics induce symbiotic patterning mostly in resistant tumors
-
•
mTOR pathway implication is also suggested in patients treated with antiangiogenics
Jimenez-Valerio et al. describe a mechanism of resistance to antiangiogenics in RCC that involves metabolic symbiosis patterning between tumor cells that can be blocked with mTOR inhibitors. Validation in patients demonstrates that antiangiogenics produce the same metabolic symbiosis pattern, mostly in resistant tumors, with mTOR pathway involvement.
Introduction
Angiogenesis is a crucial step in neoplastic progression that provides vascular support to the growing cancer mass while allowing for tumor cell dissemination and metastasis. A number of anti-angiogenic drugs are approved for clinical use in several types of cancers (Folkman, 2007). Nevertheless, antiangiogenics are typically not able to eliminate all tumor cells, giving raise to tumor relapse. Therefore, clinical responses achieved with these types of agents are moderate increases in survival, and are limited by therapeutic resistance that produces long-term failure of these treatments (Kerbel and Folkman, 2002). In the case of renal cell carcinoma (RCC), antiangiogenic drugs that block the vascular endothelial growth factor (VEGF)/VEGF receptor (VEGFR) pathway are now standard first-line treatment in metastatic RCC and are used sequentially to prolong clinical benefit in patients with recurrent disease (Rini, 2009). Nevertheless, resistance to therapy ultimately emerges in most patients, and further understanding of the underlying biology and potential therapeutic targets are urgently needed in the clinic (Rini and Atkins, 2009).
Several different mechanisms of resistance to antiangiogenic therapies have been described (Bergers and Hanahan, 2008). Tumors may activate alternative pro-angiogenic signals that produce revascularization and facilitate tumor regrowth (Casanovas et al., 2005). Less is known about alternative modes of resistance to antiangiogenic therapies that do not involve revascularization, where tumors adapt to hypoxic conditions for survival and tumor growth. Indeed, intratumor hypoxia induced by antiangiogenic factors produces an accumulation of tumor intrinsic and tumor microenvironmental modifications that enhance survival, including metabolic adaptations to survive in low oxygen and low nutrient conditions (De Bock et al., 2011).
Tumor cells have demanding metabolic requirements for their high proliferative rate in an acidic and nutrient-depleted environment. This lack of proper oxygen and nutrient supply affects tumor cell metabolism, and nutrient sensing pathways and transporters are altered to support tumor cell survival (Schulze and Harris, 2012). A particular form of adaptation to hypoxia is metabolic symbiosis, where there is a coordinated compartmentalization of tumor cells and their use of glucose and lactate (Sonveaux et al., 2008). In severely hypoxic regions tumor cells import and metabolize glucose by anaerobic glycolysis with upregulation of glucose transporter GLUT1 and lactate transporter MCT4 (Ullah et al., 2006). On the other hand, in normoxic regions, oxidative metabolism is permitted and these tumor cells are typically lactate- and glutamine-avid, and express lactate transporters such as MCT1 (Sonveaux et al., 2008). This allows for the mutual survival of these two tumor regions by compartmentalizing glycolysis and oxidative lactate metabolism at different areas that exchange glucose and lactate for their metabolic symbiosis.
Metabolic symbiosis has recently been described in several mouse models of cancer in response to potent angiogenesis inhibitors (Pisarsky et al., 2016, and Allen et al., 2016, in this issue of Cell Reports) but there has not been confirmatory assessment in the clinical setting with human patient samples. Such validation will be necessary to establish this biological phenomenon as a bona fide mode of adaptive resistance to anti-angiogenic therapy, the mechanism of which might suggest new therapeutic targets aimed to circumvent it.
Here, we describe a mechanism of resistance to antiangiogenics in patient-derived orthoxenograft models of RCC that implicates metabolic symbiosis between tumor cells that can be blocked by mTOR inhibitors. Importantly, these results are supported by analysis of clinical biopsies from patients with treated RCC, where antiangiogenics produce a metabolic symbiosis pattern that is similarly suggested to be mediated by mTOR pathway.
Results
Resistance to Antiangiogenics in Patient-Derived Renal Cell Carcinoma Orthoxenograft Models
To investigate tumor adaptation to anti-angiogenic treatments, we developed a clinically relevant mouse model based on the orthotopic implantation of primary biopsies of human clear-cell RCC tumors, in which we evaluated response and acquired resistance after VEGFR signaling inhibition with sunitinib. All orthoxenograft tumors derived from primary biopsies initially responded to sunitinib antiangiogenic therapy, but eventually the tumors rebounded, having adapted to treatment with sunitinib (Figure 1A). Notably, each of these PDX models demonstrated a distinctive efficacy of sunitinib at inhibiting tumor growth, but this therapeutic phase was always followed by tumor regrowth and resistance. Furthermore, these impairments of tumor growth translated into extensions both of time-to-progression and lifespan (overall survival) in treated animals (Figure 1B).
Figure 1.

Sunitinib Treatment Effects in Patient-Derived RCC Orthoxenografts
(A) Tumor progression with sunitinib treatment in Ren28 and Ren96 RCC PDX tumors starting at 1,000 mm3, and (B) corresponding Kaplan-Meier survival curves.
(C) Immunohistological staining of control and sunitinib-treated mice for CD31 (40×), pimonidazole adducts in green (PIMO) counterstained with DAPI (20×), GLUT1 (20×), and Ki67 (20×).
(D and E) Quantification of microvessel density (D) and H&E and necrosis (E) (percentage of area) quantification graphed as box plots from four animals per treatment group, four images each.
To explore the mechanism underlying this resistance, we first evaluated the histological features typically altered by antiangiogenic treatment. In resistant tumors, microvessel density was diminished, and both tumor hypoxia (Pimonidazole adducts and GLUT1 membrane accumulation) and tumor necrosis were consistently increased (Figures 1C–1E). Nevertheless, tumor proliferation was maintained in the viable areas of these resistant tumors, indicating that tumor cells circumvented the therapeutic pressure to continue proliferating (Figure 1C). These results coordinately describe a mechanism of resistance with reduced vascular density, without evident revascularization (Figure S1), wherein tumor cells adapted to treatment-induced hypoxia and were able to maintain proliferation and continuation of growth.
Antiangiogenic Resistance Is Associated with a Metabolic Symbiosis Phenotype
RCC typically presents with von Hippel Lindau (VHL) mutations that produce chronic hypoxic signaling cascades due to HIF1α accumulation (Cancer Genome Atlas Research Network, 2013). Nevertheless, these tumors further respond to antiangiogenic therapies with an enhanced hypoxia response transcriptional program. Indeed, VHL-mutated RCC tumor cells further elevate the transcriptional hypoxia response program when cultured under hypoxia and partial nutrient depletion conditions that mimic antiangiogenic therapy in full tumors (Figures S2A–S2C). Furthermore, these cells increase glucose consumption and lactate production under hypoxic conditions (Figure S2D). Consistently, in our orthoxenograft models Ren28 and Ren96, the expression of two hypoxia response transporters, glucose transporter GLUT1 and the lactate exporter MCT4, were increased by antiangiogenic treatment and accumulated distinctively in peri-necrotic areas where the maximal hypoxia is present (Figure 2A; Figure S3). Provocatively, the lactate importer MCT1 was expressed in other non-overlapping regions of sunitinib-treated tumors, separate from the hypoxic and necrotic regions (Figure 2A; Figure S3). This mutually exclusive localization of MCT1 and MCT4 is reminiscent of metabolic symbiosis, a form of coordinated compartmentalization of tumor cells and their use of glucose and lactate (Sonveaux et al., 2008). Indeed, sunitinib-resistant tumors showed a statistically significant increase in expression area of both MCT1 and MCT4, but more importantly, their pattern of expression changed from a low co-expression in controls to a mutually exclusive compartmentalized symbiosis pattern (Figure 2B). Specifically, MCT4-positive regions were far from blood vessels (>40 μm in both Ren28 and Ren96 models), but MCT1-positive regions were close to vessels (mostly <30 μm in both models) (Figure S4). Quantification of the incidence of this symbiosis pattern further demonstrated the significant adaptive change of the compartmentalization in resistant tumors. While in control tumors the metabolic symbiosis pattern was completely absent, the majority of sunitinib-resistant tumors showed a clearly defined compartmentalized pattering (87%) (Figure 2C).
Figure 2.

Metabolic Symbiosis of Sunitinib-Treated Tumors
(A) Immunohistofluorescence staining of Ren28 and Ren96 RCC PDX tumors showing representative images of MCT1, GLUT1, MCT4, and CD31, counterstained with DAPI (20× magnifications).
(B) Quantification of expression of MCT1 and MCT4 in Ren28 and Ren96 as a percentage of positive area per field, from four animals per treatment group, four images each.
(C) Quantification of metabolic symbiosis pattern in Ren28- and Ren96-treated tumors as presence of MCT1/MCT4 mutually exclusive pattern (symbiosis pattern) versus homogeneous, co-staining (no symbiosis pattern).
(D) Representative images of pS6, MCT1, and MCT4 immunohistofluorescence staining in RCC PDX tumors.
In a related paper in this issue of Cell Reports, Allen et al. (2016) describe the association of mTOR signaling pathway activity in analogous symbiotic clusters in a mouse model of pancreatic neuroendocrine cancer (PanNET). Thus, we evaluated mTOR pathway activity by means of phospho-S6 and phospho-S6K in the resistant RCC tumors. Immunofluorescence staining showed these mTOR activity markers accumulated specifically in tumor regions close to vessels, co-localized with MCT1 and were mutually exclusive with MCT4 areas (Figure 2D; data not shown). These data clearly demonstrate that mTOR activity was restricted to the MCT1-expressing normoxic compartment in sunitinib-resistant tumors.
Blockade of Metabolic Symbiosis by Inhibition of mTOR pathway
To determine the functional implication of mTOR signaling in the metabolic symbiosis pattern, sunitinib-resistant tumors were treated with a clinically approved mTOR inhibitor, everolimus. The mTOR inhibitor demonstrated antitumor efficacy in this second-line treatment, effectively blocking the adaptive resistance to antiangiogenic therapy in Ren28, but not in the Ren96 PDX model (Figure 3A). Similarly to the clinical setting, second-line everolimus in patients has a variable efficacy, with a proportion of patients not responding to this therapy (upfront refractory or intrinsic resistant) (Motzer et al., 2014). To confirm mTOR pathway inhibition in everolimus-treated PDX tumors, immunofluorescent staining for the p-S6 and p-S6K markers demonstrated that everolimus was indeed effectively inhibiting mTOR activity in Ren28, but it was not active in Ren96 (Figure 3B). This suggests that Ren96 PDX model could have a signaling misregulation or mutation that renders it insensitive to everolimus treatment. When the metabolic symbiosis phenotype was evaluated in both tumor models, everolimus treatment produced a substantial alteration in the expression area of the lactate transporters MCT1 and MCT4 only in Ren28, with widespread accumulation of MCT4, concomitant with reductions in MCT1-positive regions (Figure 3B). Quantification of these regions confirmed that everolimus treatment in Ren28 served to unbalance the MCT1/MCT4 symbiotic equilibrium in favor of MCT4-expressing areas, reducing MCT1-positive tumor areas (Figure 3C). On the contrary, everolimus treatment did not disrupt the sunitinib-resistance symbiotic pattern in the insensitive Ren96 tumors (Figure 3D). This correlation suggests that everolimus-induced disruption of the metabolic symbiosis phenotype is fully dependent on everolimus efficacy in inhibiting mTOR pathway. To pinpoint the mechanism of everolimus decrease in MCT1-positive areas, an in vitro study was performed with RCC cells. Everolimus treatment decreased tumor cell viability by 53% (Figure S5), indicating that cell survival rather than a transcriptional downregulation of MCT1 was occurring in these cells. Thus, metabolic symbiosis abolishment by everolimus is associated to decreased viability of this particular tumor cell subpopulation.
Figure 3.

Everolimus Effects as a Second-Line Treatment in Patient-Derived RCC Orthoxenografts
(A) Tumor progression of treatment with sunitinib or sunitinib followed by everolimus in Ren28 and Ren96 RCC PDX tumors starting at 1,000 mm3, and Corresponding Kaplan-Meier survival curves.
(B) Representative images of pS6 and S6kinase immunohistochemistry staining, and pS6, MCT4, MCT1, and MCT4 immunohistofluorescence staining, counterstained with DAPI (20× magnifications).
(C) Quantification of expression MCT1 and MCT4 in Ren28 and Ren96 in the different treatments as percentage of positive area per field, from four animals per treatment group, four images each.
(D) Quantification of metabolic symbiosis pattern in Ren28- and Ren96-treated tumors as presence of MCT1/MCT4 mutually exclusive pattern (symbiosis pattern) versus homogeneous, co-staining (no symbiosis pattern).
Overall, the data implicate the mTOR pathway in this sunitinib resistance mechanism by aiding the induction of the perivascular p-S6/MCT1-positive subcompartment. Furthermore, when mTOR is effectively inhibited, sunitinib resistance is blocked, evidently disrupting the metabolic symbiosis phenotype via elimination of the pS6/MCT1-positive subpopulation in favor of the GLUT1/MCT4-positive subpopulation.
Metabolic Symbiosis in RCC Patients after Antiangiogenics
To further assess the metabolic symbiosis phenotype observed in orthoxenograft models, we evaluated a series of 15 patients with clear-cell RCC tumors who had been treated with antiangiogenic therapy blocking the VEGF/VEGFR pathway (Figure S6A). This series is unique because we obtained paired FFPE tumor specimens before and after antiangiogenic treatment (either in response or resistance), therefore allowing determination of histopathological changes in each patient’s tumor pre- and post-antiangiogenic treatment. Immunofluorescence staining of lactate transporters in samples before and after antiangiogenic treatment demonstrated that area with expression of both MCT1 and MCT4 were significantly increased upon treatment (Figure 4A, left; Figure S6B), suggestive of a metabolic adaptation to treatment involving upregulation of lactate transporters, similar to that observed in the tumor models. Importantly, localization of these transporters also occurred in a compartmental, mutually exclusive pattern, with MCT1 expressed in well-oxygenated areas close to vessels, and MCT4 expressed in more hypoxic (GLUT1 in the membrane) areas distal to tumor vessels (Figure S6C). Upon quantification, this patterning was observed in 71% of the post-treatment samples but completely absent in the pre-treatment samples, indicating the strong adaptive nature of this event (Figure 4A, right). This patterning strongly suggests a metabolic symbiosis phenotype in patients, and is fully consistent with findings in orthoxenograft tumor models.
Figure 4.

Metabolic Symbiosis after Antiangiogenic Treatment in RCC
(A) Left, Quantification of expression MCT1 and MCT4 in RCC in basal levels (pre-treatment samples) versus application of the antiangiogenic therapy (post-treatment samples), represented as percentage of positive area per field. Right, quantification of metabolic symbiosis pattern in the same samples as described above.
(B) Representative images of MCT1, MCT4, and CD31 immunohistofluorescence staining in RCC according clinical response, 20× DAPI counterstained.
(C) Quantification of metabolic symbiosis pattern in RCC according to clinical response, basal levels (pre-treatment samples) versus post-antiangiogenic-treated samples.
(D) Representative images of GLUT1, MCT1, pS6, and MCT4 immunohistofluorescence staining in RCC according to clinical response.
(E) Schematic diagram of treatment schedule for a patient treatment sequence and immunofluorescence show a representative staining of MCT1, MCT4, and CD31 before and after antiangiogenic-positive mTOR inhibition treatments.
Due to the differential clinical responses to treatment in each of the 15 patients in study, they were grouped according to their response or resistance to treatment (clinically stable disease, SD versus progressive disease, PD) at the end of antiangiogenic therapy, when the post- sample was obtained. Tumors from responsive (n = 6) and resistant (n = 8) patients to antiangiogenic treatment both expressed MCT1 and MCT4 after treatment (Figure 4B). Notably, however, only tumors from patients who progressed (having acquired a resistant phenotype) had a clearly defined compartmentalization of MCT1 and MCT4, consistent with metabolic symbiosis patterning (Figure 4B). Quantification revealed that metabolic symbiosis patterning was observed in 100% of the post-samples from resistant tumors, whereas in patients still in the response phase (SD) the incidence was 33% (Figure 4C). Thus, this singular series of treated and biopsied patients supports the proposition that antiangiogenic resistance involves the formation of two mutually exclusive tumor cell compartments, a perivascular region and MCT1 expression, and another peri-necrotic region expressing MCT4 and a GLUT1/hypoxia response.
Motivated by the orthoxenograft results, mTOR pathway involvement was also evaluated. The phospho-S6 mTOR activity marker was also compartmentalized in post-treatment samples and, similar to orthoxenograft results, it was expressed in a mutually exclusive pattern with MCT4 lactate exporter (Figure 4D). Whereas our series of pre- and post-samples were from antiangiogenic-treated patients, we obtained samples from one patient with RCC that was effectively treated with mTOR inhibitor (second line) just after antiangiogenics (first line). In this patient (patient no. 12), only MCT4 expression was detected after progression to mTOR inhibitor treatment, and there was no compartmentalization patterning (Figure 4E). Although these data are from one individual, the results are fully consistent with animal models where mTOR inhibition selectively eliminated the MCT1 compartment, leaving the MCT4-positive tumor compartment comparatively intact.
Collectively, this singular set of sunitinib-treated and successively biopsied patients supports the hypothesis that antiangiogenic treatment induces a metabolic symbiosis patterning in RCC that is further exacerbated in progressive (resistant) tumors. Furthermore, the mTOR pathway is also implicated as involved in inducing and maintaining the MCT1-positive compartment in the metabolic symbiosis.
Discussion
Our study, together with Pisarsky et al. (2016) and Allen et al. (2016), establish in mouse models of three different tumor types a new mode of resistance to antiangiogenic therapies, involving metabolic symbiosis among differential subcompartments of tumor cells. Indeed, metabolic symbiosis has been described as a mode of adaptation to tumor hypoxia (Sonveaux et al., 2008), but here we coordinately describe this phenomenon as an active mechanism of resistance to potent antiangiogenic therapies in three different tumor types (pancreatic neuroendocrine tumor, breast cancer, and RCC).
Several different modes of resistance to antiangiogenic therapies have been described, including the induction of revascularization and reoxygenation of tumors by different mechanisms (Bergers and Hanahan, 2008, Casanovas et al., 2005). Nevertheless, here we describe a mechanism of resistance in the context of continuing suppression of tumor neo-vascularization, whereby tumor cells adapt to treatment-induced hypoxia to enable continuing proliferation and growth. This adaptation involves a functional compartmentalization of energy metabolism previously described as metabolic symbiosis by Dewhirst and colleagues (Sonveaux et al., 2008). This is a form of coordinated compartmentalization of tumor cells and their differential use of glucose and lactate that produces a mutually exclusive patterning of MCT1-expressing cells and MCT4. This is functionally relevant as the hypoxic and peri-necrotic region upregulate hypoxia-response genes (GLUT1, PDK1, GAPDH, etc.) to activate anaerobic glycolysis and export accumulated lactate to the extracellular space via MCT4 lactate/H+ symporter. On the other hand, the perivascular compartment is better oxygenated and permits oxidative phosphorylation, for which it imports accumulated lactate to be further metabolized aerobically to obtain energy (Sonveaux et al., 2008).
With these data, a more clinically relevant question emerges: Is there a way to block this metabolic symbiosis phenotype to therapeutically attack these antiangiogenic-resistant tumors? Consistent with Allen et al. (2016), we have produced evidence that the mTOR signaling pathway has an important role in this symbiotic compartmentalization, and it can be therapeutically targeted. mTOR activity markers reveal that this pathway is restricted to better oxygenated MCT1-positive areas, close to vessels, consistent with the report by Allen et al. (2016) Thus, therapeutic inhibition of this pathway with mTOR (mTORC1) inhibitors such as everolimus and rapamycin disrupts the symbiotic pattern and unbalances this equilibrium by eliminating the MCT1-positive areas, accumulating glycolytic MCT4-positive tumor cells, and increasing necrosis by oxygen and nutrient depletion. The result is anti-tumor therapeutic benefit, and suggests everolimus as a useful second-line treatment after antiangiogenic therapy. Indeed, this is a typical sequence of treatment in metastatic RCC, where the standard first-line treatment is with antiangiogenic drugs and, upon resistance (disease progression), follow-up treatment with everolimus (RECORD trials) (Motzer et al., 2014).
An important shortcoming in the concurrent metabolic symbiosis studies is that they are restricted to animal model studies, such that it remained to be determined whether this adaptive resistance mechanism was operative in human cancer treated with anti-angiogenic drugs. Here, we present the first validation of metabolic symbiosis in a series of 15 patients with clear cell RCC tumors treated with antiangiogenic therapies. By obtaining a set of uniquely paired FFPE tumor specimens before and after antiangiogenic treatment, we detected compartmentalization upon treatment, with mutually exclusive patterns of perivascular MCT1 and peri-necrotic/hypoxic MCT4 areas, strongly suggestive of a metabolic symbiosis phenotype in patients. Furthermore, this patterning was most prominent in tumors that had adapted and progressed on therapy, consistent with metabolic symbiosis patterning occurring in and contributing to the resumed progression in resistant tumors.
Moreover, we have implicated involvement of the mTOR pathway in the adaptive resistance via metabolic compartmentalization in patient tumors, where the perivascular subcompartment shows mTOR signaling activity and MCT1 expression. Furthermore, mTOR inhibition in a patient further substantiates the promising value of targeting mTOR to block metabolic symbiosis and overall resistance to antiangiogenics in patients.
In summary, our study describes a mode of resistance to antiangiogenic therapies in orthotopic RCC PDX mouse models and in human patients, involving metabolic symbiosis compartmentalization of tumors. This resistance mechanism can be blocked therapeutically with mTOR inhibitors that disrupt the symbiosis by eliminating one of the symbiotic compartments, which may be important for the benefits of this drug when used second line after resistance to angiogenesis inhibitors.
Experimental Procedures
Patient-Derived Orthoxenograft Models from RCC Human Biopsies
Fresh surgical specimens of RCC were obtained from the Bellvitge and Vall d’Hebron Hospitals under local ethics committee’s approved protocols (CEIC approvals ref. PR322/11 and PR[AG]240/2013). Their surgical implantation was done orthotopically in the kidney (original neoplastic organ) in male athymic nude mice (Harlan Laboratories). All animal experiments were developed according to our Institute’s Animal Research Committee acceptance, and following Spanish laws and European directives on ethical usage of rodents for animal research (approval DARP-#4899).
Treatment Schedule
Once the tumor was palpable (1,000 mm3 of volume), five to six animals were randomized to receive treatments. Sunitinib (LC Labs) was prepared and dosed at 40 mg/kg/day orally as described (Pàez-Ribes et al., 2009). Everolimus (LC Labs) was prepared and dosed at 10 mg/kg/day orally. At the end of treatment, mice were killed, and the tumor tissue was weighed and processed for histology.
Immunohistology and Quantifications
Frozen or FFPE tumor sections were stained with H&E and immunohistology techniques as described (Pàez-Ribes et al., 2009). Primary antibodies were rabbit anti-GLUT1 (Abcam, ab652), mouse anti-CD31 (Abcam, ab28364), rabbit anti-Ki67 (Thermo Sci., RM9106 S-1), anti-PS6 (Cell Signaling, 4857), anti-pS6K (Abcam, ab32359), rabbit anti-GLUT1 (Abcam ab652), rabbit anti-PS6 (Cell Signaling, 4857), rabbit anti-MCT1 (H-70) (SCB, SC-50324), rabbit anti-MCT4 (H-90) (SCB, SC-50329), and anti-pimonidazole (NPI, 4.3.11.3). Double or triple stainings with same-species antibodies were done with tyramide followed by fixation as described.
To quantify CD31, Ki67, and GLUT1 staining, four hotspot fields in viable tissue zones at 400× magnification were captured for each tumor. MCT1/MCT4 area density quantification was done with positive-pixel-area/total-image-pixel-area, using ImageJ software. Hypoxia was detected with pimonidazole (intraperitoneal 60 mg/kg) 1 hr before heart perfusion, and immunodetected with histological techniques as described above.
Patient Series and Clinical Data
The series of pre- and post-samples from patients with RCC was gathered prospectively and retrospectively between 2007 and 2014 under clinical ethics committee approval (IDIBELL CEIC approval ref. PR322/11, and VHIO CEIC approval ref. PR[AG]240/2013), and acceptance by the Spanish Government (AEMPS). A total of 15 clear-cell RCC samples from previously untreated patients were selected, and pre-treatment and post-treatment biopsies and/or surgical specimens were collected (including four post-treatment autopsy samples). These patients were treated with antiangiogenic therapy (mostly sunitinib and a few bevacizumab at standard dose) and the response was evaluated by RECIST guidelines (tumor progression PD, resistance; or tumor response SD, in efficacy) at the end of antiangiogenic treatment.
Statistical Analysis
Statistical comparisons between treatment groups were done using the Mann-Whitney U test (2-tailed), performed in GraphPad Prism. Differences were considered statistically significant at p < 0.05. Statistics coding: ∗∗∗∗p < 0.0001; ∗∗∗p < 0.001; ∗∗p < 0.01, and ∗p < 0.05.
Author Contributions
G.J.V., M.M.L., and N.B. conducted experiments and processed data. A.V., M.O., C.S., X.G.M., J.C., and S.I. contributed clinical material and processed data. F.V., M.G., and S.I. processed data. O.C. conceived the study, and O.C. and G.J.V. wrote the paper.
Acknowledgments
We are immensely grateful to Douglas Hanahan (ISREC) and Lidia Moserle (IOV) for their insightful comments on the manuscript. We also thank Roser Pons and Elizabeth Allen for valuable technical assistance and comments. The research leading to these results has received funding from the European Research Council under the FP7/2007-2013 ERC grant agreement no. 281830 (STROMALIGN), Ministerio de Economía y Competitividad-Spain (SAF2012-36575) co-funded by FEDER / ERDF funds — a way to build Europe, ISCIII-Spain (PIE13/00022-5), and AGAUR-Generalitat de Catalunya (SGR2014-725). S.I. was supported by AIRC (project IG14295).
Published: April 28, 2016
Footnotes
Supplemental Information includes Supplemental Experimental Procedures and six figures and can be found with this article online at http://dx.doi.org/10.1016/j.celrep.2016.04.015.
Supplemental Information
References
- Allen E., Miéville P., Warren C.M., Saghafinia S., Li L., Peng M.W., Hanahan D. Metabolic symbiosis enables adaptive resistance to anti-angiogenic therapy that is dependent on mTOR signaling. Cell Rep. 2016;15:1144–1160. doi: 10.1016/j.celrep.2016.04.029. this issue. [DOI] [PMC free article] [PubMed] [Google Scholar]
- Bergers G., Hanahan D. Modes of resistance to anti-angiogenic therapy. Nat. Rev. Cancer. 2008;8:592–603. doi: 10.1038/nrc2442. [DOI] [PMC free article] [PubMed] [Google Scholar]
- Cancer Genome Atlas Research Network Comprehensive molecular characterization of clear cell renal cell carcinoma. Nature. 2013;499:43–49. doi: 10.1038/nature12222. [DOI] [PMC free article] [PubMed] [Google Scholar]
- Casanovas O., Hicklin D.J., Bergers G., Hanahan D. Drug resistance by evasion of antiangiogenic targeting of VEGF signaling in late-stage pancreatic islet tumors. Cancer Cell. 2005;8:299–309. doi: 10.1016/j.ccr.2005.09.005. [DOI] [PubMed] [Google Scholar]
- De Bock K., Mazzone M., Carmeliet P. Antiangiogenic therapy, hypoxia, and metastasis: risky liaisons, or not? Nat. Rev. Clin. Oncol. 2011;8:393–404. doi: 10.1038/nrclinonc.2011.83. [DOI] [PubMed] [Google Scholar]
- Folkman J. Angiogenesis: an organizing principle for drug discovery? Nat. Rev. Drug Discov. 2007;6:273–286. doi: 10.1038/nrd2115. [DOI] [PubMed] [Google Scholar]
- Kerbel R., Folkman J. Clinical translation of angiogenesis inhibitors. Nat. Rev. Cancer. 2002;2:727–739. doi: 10.1038/nrc905. [DOI] [PubMed] [Google Scholar]
- Motzer R.J., Barrios C.H., Kim T.M., Falcon S., Cosgriff T., Harker W.G., Srimuninnimit V., Pittman K., Sabbatini R., Rha S.Y. Phase II randomized trial comparing sequential first-line everolimus and second-line sunitinib versus first-line sunitinib and second-line everolimus in patients with metastatic renal cell carcinoma. J. Clin. Oncol. 2014;32:2765–2772. doi: 10.1200/JCO.2013.54.6911. [DOI] [PMC free article] [PubMed] [Google Scholar]
- Pàez-Ribes M., Allen E., Hudock J., Takeda T., Okuyama H., Viñals F., Inoue M., Bergers G., Hanahan D., Casanovas O. Antiangiogenic therapy elicits malignant progression of tumors to increased local invasion and distant metastasis. Cancer Cell. 2009;15:220–231. doi: 10.1016/j.ccr.2009.01.027. [DOI] [PMC free article] [PubMed] [Google Scholar]
- Pisarsky L., Bill R., Fagiani E., Dimeloe S., Goosen R.W., Hagmann J., Hess C., Christofori G. Targeting metabolic symbiosis to overcome resistance to anti-angiogenic therapy. Cell Rep. 2016;15:1161–1174. doi: 10.1016/j.celrep.2016.04.028. this issue. [DOI] [PMC free article] [PubMed] [Google Scholar]
- Rini B.I. Vascular endothelial growth factor-targeted therapy in metastatic renal cell carcinoma. Cancer. 2009;115(10, Suppl):2306–2312. doi: 10.1002/cncr.24227. [DOI] [PubMed] [Google Scholar]
- Rini B.I., Atkins M.B. Resistance to targeted therapy in renal-cell carcinoma. Lancet Oncol. 2009;10:992–1000. doi: 10.1016/S1470-2045(09)70240-2. [DOI] [PubMed] [Google Scholar]
- Schulze A., Harris A.L. How cancer metabolism is tuned for proliferation and vulnerable to disruption. Nature. 2012;491:364–373. doi: 10.1038/nature11706. [DOI] [PubMed] [Google Scholar]
- Sonveaux P., Végran F., Schroeder T., Wergin M.C., Verrax J., Rabbani Z.N., De Saedeleer C.J., Kennedy K.M., Diepart C., Jordan B.F. Targeting lactate-fueled respiration selectively kills hypoxic tumor cells in mice. J. Clin. Invest. 2008;118:3930–3942. doi: 10.1172/JCI36843. [DOI] [PMC free article] [PubMed] [Google Scholar]
- Ullah M.S., Davies A.J., Halestrap A.P. The plasma membrane lactate transporter MCT4, but not MCT1, is up-regulated by hypoxia through a HIF-1alpha-dependent mechanism. J. Biol. Chem. 2006;281:9030–9037. doi: 10.1074/jbc.M511397200. [DOI] [PubMed] [Google Scholar]
Associated Data
This section collects any data citations, data availability statements, or supplementary materials included in this article.