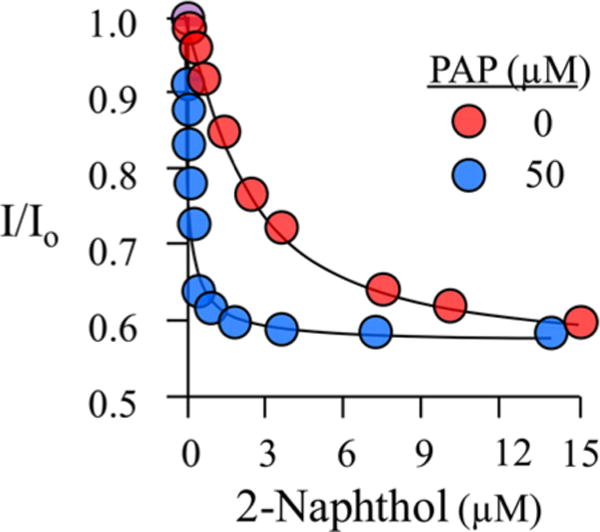
Figure 1.

Equilibrium binding of 2-naphthol to the E and E·PAP forms of SULT1A1. Binding was monitored via changes in the intrinsic fluorescence of SULT1A1 (λex = 290 nm; λem = 340 nm). The fluorescence intensity is given relative to that observed in the absence of 2-Nap (I/I0). The solution consisted of SULT2A1 [20 nM (dimer)], PAP [0 (red) or 50 μM (blue)], MgCl2 (5.0 mM), and NaPO4 (50 mM) at pH 7.2 and 25 ± 2 °C. Each point represents the average of three independent determinations, and the lines through the points are the behaviors predicted by a best-fit, single-site binding model.
