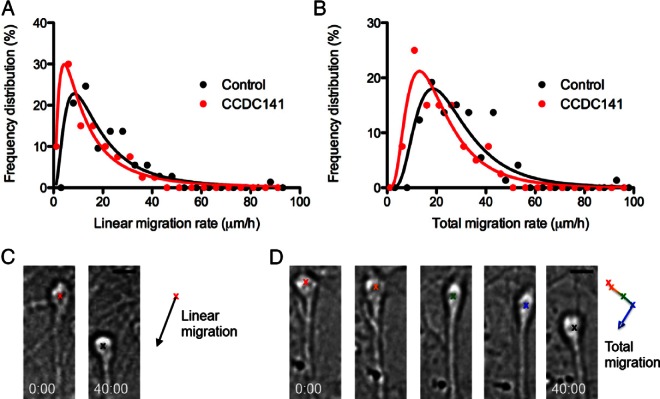
Figure 5.
CCDC141 knockdown reduces GnRH neuronal migration. A and B, Frequency distributions of the linear (A) and total (B) migration rates fit with lognormal curves showing a shift in the distribution in the CCDC141 siRNA-treated cultures vs the controls (P < .05, Mann-Whitney U test, n = 73 control, and n = 40 CCDC141 siRNA-treated cells; error bars, SEM). C and D, Examples of measurement of linear migration (C) and total migration (D) of GnRH neurons over a 40-minute imaging session. C, Linear migration rates represent the displacement of the neuron (black arrow) over the imaging period. D, Total migration rates represent the average of the frame-to-frame movement rates (represented by the simplified time series and trajectory trace). Scale bars, 10 μm.

