Abstract
Sphingosine 1-phosphate (S1P) is known to regulate insulin resistance in hepatocytes, skeletal muscle cells, and pancreatic β-cells. Among its 5 cognate receptors (S1pr1–S1pr5), S1P seems to counteract insulin signaling and confer insulin resistance via S1pr2 in these cells. S1P may also regulate insulin resistance in adipocytes, but the S1pr subtype(s) involved remains unknown. Here, we investigated systemic glucose/insulin tolerance and phenotypes of epididymal adipocytes in high-fat diet (HFD)-fed wild-type and S1pr2-deficient (S1pr2−/−) mice. Adult S1pr2−/− mice displayed smaller body/epididymal fat tissue weights, but the differences became negligible after 4 weeks with HFD. However, HFD-fed S1pr2−/− mice displayed better scores in glucose/insulin tolerance tests and had smaller epididymal adipocytes that expressed higher levels of proliferating cell nuclear antigen than wild-type mice. Next, proliferation/differentiation of 3T3-L1 and 3T3-F442A preadipocytes were examined in the presence of various S1pr antagonists: JTE-013 (S1pr2 antagonist), VPC-23019 (S1pr1/S1pr3 antagonist), and CYM-50358 (S1pr4 antagonist). S1P or JTE-013 treatment of 3T3-L1 preadipocytes potently activated their proliferation and Erk phosphorylation, whereas VPC-23019 inhibited both of these processes, and CYM-50358 had no effects. In contrast, S1P or JTE-013 treatment inhibited adipogenic differentiation of 3T3-F442A preadipocytes, whereas VPC-23019 activated it. The small interfering RNA knockdown of S1pr2 promoted proliferation and inhibited differentiation of 3T3-F442A preadipocytes, whereas that of S1pr1 acted oppositely. Moreover, oral JTE-013 administration improved glucose tolerance/insulin sensitivity in ob/ob mice. Taken together, S1pr2 blockade induced proliferation but suppressed differentiation of (pre)adipocytes both in vivo and in vitro, highlighting a novel therapeutic approach for obesity/type 2 diabetes.
Obesity has been implicated in the pathogenesis of various metabolic diseases, including type 2 diabetes, dyslipidemia, and hypertension, which can be associated with the onset of atherosclerosis and cardiovascular events. Insulin resistance has been proposed as a key factor that links obesity to these diseases; however, the molecular mechanisms underlying obesity (or excessive food intake)-induced insulin resistance have not yet been elucidated in detail. Previous clinical findings revealed a relationship between adipocyte hypertrophy and the onset of type 2 diabetes (1), and recent animal experiments suggested that adipocyte hypertrophy rather than its hyperplasia leads to metabolic abnormality (2). Smaller adipocytes may be induced by either the activation (by agonists) or inhibition (by genetic heterozygous deletion) of peroxisome proliferator-activated receptor (PPAR)γ activity in mice, which has been shown to ameliorate insulin resistance by different mechanisms (3). Adipocyte hypertrophy was reported to decrease the production of adiponectin (4) and induce the secretion of chemokines, such as monocyte chemotactic protein-1 and C-C motif chemokine 2, for the recruitment of proinflammatory (M1) macrophages (rather than antiinflammatory [M2] macrophages) to adipose tissues (5, 6). Thus, hypertrophied adipose tissues in obesity may contribute to the onset of low-grade chronic inflammation, which leads to insulin resistance. In the present study, we propose sphingosine 1-phosphate (S1P) as a key regulatory factor of adipocyte hypertrophy and proliferation that influence its insulin resistance.
S1P is a bioactive lipid mediator that is generated from sphingosine (a ceramide derivative) by 2 sphingosine kinases (Sphks), Sphk1 and Sphk2 (7). S1P is then exported from the cell, where it activates 5 classes of cell surface G protein-coupled receptors (S1P receptor 1 [S1pr1]-S1pr5) (8–11). S1pr1 preferentially couples with Gi, and activates the phospholipase C, Ras-Erk, and phosphoinositide 3-kinase/Akt pathways in a pertussis toxin-sensitive manner (12), and thereby regulates a wide range of cell reactions such as chemotaxis, angiogenesis (9), and lymphocyte trafficking (13). In contrast, S1pr2 and S1pr3 couple with several G proteins, including Gi, Gq, and G12/13, and drive other pathways (11, 12). S1P has been shown to regulate cell proliferation, migration, and survival, and it exerts diverse physiological roles in the immune, neuronal, and circulatory systems (10, 11). Although the physiological roles of S1P have been examined extensively in these fields, its involvement in obesity/glucose metabolism remains unclear, especially in terms of adipocyte functions (14). Previous studies demonstrated that intracerebroventricular injections of S1P in mice reduced food intake, whereas a hypothalamic-selective deletion of S1pr1 in mice increased food intake (15), and that S1P regulated lipolysis and leptin production in cultured rat adipocytes (16) and might directly act as a PPARγ ligand (17). Here, we demonstrated that the blockade of S1pr2 signaling causes adipocyte proliferation, improves insulin resistance in mice with high-fat diet (HFD)-induced or genetically induced obese states, and influences the proliferation/adipogenic differentiation of preadipocytic cell lines.
Materials and Methods
Animals
Male and female heterozygous S1pr2+/− mice previously generated by our group on C57BL/6 background (18) were bred to generate S1pr2−/− mice. Male S1pr2−/− and wild-type (WT) littermates were ad libitum fed a CE-2 standard dry rodent diet (Normal diet; Japan Clea) consisting of 51.4% (g/g) carbohydrates, 24.9% crude protein, 4.6% crude fat, and 3.7% crude fiber up to 10 weeks of age, and then HFD (High Fat Diet 32, Japan Clea) that consists of 13.7% carbohydrates, 25.5% crude protein, 32.0% crude fat, and 2.9% crude fiber up to 14 weeks of age. C57BL/6JHamSlc-ob/ob (ob/ob, C57BL/6 background) mice were purchased from Japan SLC. Male and female heterozygous ob/OB mice were bred to generate homozygous ob/ob mice. The homozygous ob/ob and WT male mice were fed ad libitum CE-2 powder with/without 40-mg/kg JTE-013 (S1pr2 antagonist; Cayman Chemical) (19) during 10–14 weeks of age. Mice were housed in a specific pathogen-free, air-conditioned room kept on a 12-hour light, 12-hour dark cycle (8 pm to 8 am), and fasted for 15 hours (7 pm to 10 am) before measurements of plasma glucose using a Quickauto-Neo GLU-HK (Shino-Test Corp) kit. All procedures for animal experiments were carried out in accordance with protocols approved by the Gifu Institutional Animal Care Committee (number 23-4).
Epididymal adipocyte preparation
Epididymal fat tissues were isolated from anesthetized mice and digested with collagenase to obtain adipocytes and stromal vascular fractions (SVFs). Briefly, epididymal fat tissues were minced with scissors to a diameter of approximately 0.5 mm followed by incubation with type 1 collagenase (1 mg/mL; Sigma)-containing Krebs-Ringer-modified buffer with HEPES (pH 7.4) at 37°C for 30 minutes. After filtration through a nylon mesh, the filtrate was centrifuged at 8g for 1 minute, and the floating layer was rinsed 4 times with Krebs-Ringer-modified buffer with HEPES to isolate adipocytes. The remaining layer was centrifuged at 210g for 3 minutes, and SVF were obtained from the resulting pellet.
Glucose tolerance test (GTT) and insulin tolerance test (ITT)
Glucose tolerance and insulin sensitivity were evaluated using a conventional ip-GTT (glucose, 2 g/kg) and ip-ITT (insulin, 0.3 IU/kg).
Histological study
Epididymal fat tissues were fixed in 10% neutral buffered formalin and embedded in paraffin. Three-micrometer-thick sections were cut, deparaffinized, stained using anti-SPHK1 (20) or anti-CD11c antibodies, and detected using a Vectastain ABC kit (Vector Laboratories). Oil Red O (Santa Cruz Biotechnology, Inc) staining was carried out to estimate triglyceride contents; Oil Red O-stained cells were lysed in 1% Triton X-100/PBS, and absorbance at 540 nm (OD540) was measured. Genomic DNA contents in the lysate were also measured using QuantiFluor dsDNA System (Promega) and used for normalization. To evaluate adipocyte sizes, formalin-fixed epididymal adipose tissue sections were stained with hematoxylin/eosin and the long axis of 300 independent mature adipocytes (per mouse) was measured by manual tracing using a BZ-II image analysis application (Keyence).
Cell culture
Both 3T3-L1 and 3T3-F442A preadipocytes were purchased from ECACC (catalog numbers 86052701 and 00070654, respectively) and cultured in DMEM supplemented with 10% fetal bovine serum, 100-U/mL penicillin, and 0.1-mg/mL streptomycin. Only cells with lower (<6) passages were used for this study. Upon reaching confluence, insulin (10nM) (plus dexamethasone (10μM) and 3-isobutyl-1-methylxantine (0.5mM) for 3T3-L1 cells) was supplemented to promote adipogenic differentiation. To examine the involvement of S1P signals in this differentiation, S1P (Cayman Chemical), VPC-23019 (S1pr1/S1pr3 antagonist; Santa Cruz Biotechnology, Inc) (21), JTE-013, or CYM-50358 (S1pr4 antagonist; R&D Systems) (22) was added to the medium. Adipogenic differentiation was evaluated after 5 days of cultivation by the accumulation of triglycerides or expression levels of adipocyte-specific genes. The proliferation of 3T3-L1 and 3T3-F442A preadipocytes was evaluated by cell number counting, the WST assay using Cell Proliferation Reagent WST-1 (Roche), or 5-ethynyl-2′-deoxyuridine (EdU) incorporation assay using the Click-iT EdU Imaging kit (Invitrogen). The numbers of EdU-positive cells and total cells were automatically counted using the BZ-II analysis application (Keyence). The small interfering RNA (siRNA) knockdown of S1pr1 and S1pr2 genes in 3T3-F442A cells was performed using EDG-1 siRNA (m), EDG-5 siRNA (m), and Plasmid Transfection Reagent (Santa Cruz Biotechnology, Inc). Control siRNA-A (Santa Cruz Biotechnology, Inc) was used for negative controls. At 2 days after the transfection, cells were trypsinized and reseeded for cell proliferation and differentiation assays.
Quantitative PCR
Quantitative PCR was performed to determine the mRNA levels of various adipocyte-specific genes. Total RNA was isolated using TRIzol (Invitrogen) and purified using RNase-free DNase (Promega). Reverse transcription was performed using a PrimeScript Reverse Transcriptase (Takara), and the cDNA produced was amplified using a SYBR Premix Ex Taq kit (Takara). Twenty microliters of the reaction solution contained 2 μL of the template, 10-μL SYBR Premix Ex Taq, 0.4 μL of each primer (10μM), 0.4-μL ROX Reference Dye, and RNase-free water. PCR amplification was performed as follows: 1 cycle of predenaturation at 95°C for 30 seconds and 40 cycles of 95°C for 5 seconds and 60°C–62°C for 30 seconds using a Thermal Cycler Dice (Takara). Oligonucleotide primers were designed based on sequences from the GenBank database: S1pr1, 5′-acacaacgggagcaacagc-3′ (forward [f]) and 5′-tggtagagcgggagcacg-3′ (reverse [r]); S1pr2, 5′-ACACAACGGGAGCAACAGC-3′ (f) and 5′-TGGTAGAGCGGGAGCACG-3′ (r); Pparγ, 5′-CCCTTTGGTGACTTTATGGA-3′ (f) and 5′-CTGCCTGAGGTCTGTCATCT-3′ (r); fatty acid binding protein 4 (Fabp4), 5′-AAAGACAGCTCCTCCTCGAAGGTT-3′ (f) and 5′-TGACCAAATCCCCATTTACGC-3′ (r); lipoprotein lipase (Lpl), 5′-AGGATGCAACATTGGAGAAG-3′ (f) and 5′-TCTCTTGGCTCTGACCTTGT-3′ (r); adiponectin, C1Q and collagen domain containing (Adipoq), 5′-AAGGACAAGGCCGTTCTCT-3′ (f) and 5′-TATGGGTAGTTGCAGTCAGTTGG-3′ (r); leptin (Lep), 5′-GACACCAAAACCCTCATCAA-3′ (f) and 5′-TCTCCAGGTCATTGGCTATC-3′ (r); sterol regulatory element binding transcriptional factor 1 (Srebp1), 5′-TACCAGCAATGGACCCCAG-3′ (f) and 5′-AACCTGCCCTCCTCAGAC-3′ (r); fatty acid synthase (Fasn), 5′-AGATCCTGGAACGAGAACACGAT-3′ (f) and 5′-CAAGTCCAGGAGTGACACGTCTC-3′ (r); integrin αX (Itgax/Cd11c), 5′-CTGGATAGCCTTTCTTCTGCTG-3′ (f) and 5′-GCACACTGTGTCCGAACTC-3′ (r); nitric oxide synthase 2, inducible (Nos2), 5′-CCAAGCCCTCACCTACTTCC-3′ (f) and 5′-CTCTGAGGGCTGACACAAGG-3′ (r); arginase, liver (Arg1), 5′-CTCCAAGCCAAAGTCCTTAGAG-3′ (f) and 5′-AGGAGCTGTCATTAGGGACATC-3′ (r); and glyceraldehyde-3-phosphate dehydrogenase (Gapdh), 5′-GGCATTGTGGAAGGGCTCAT-3′ (f) and 5′-GACACATTGGGGGTAGGAACA-3′ (r). Expression levels were quantified using the comparative CT method with housekeeping Gapdh levels for normalization.
Western blotting
Equal protein amounts of the cell lysate were subjected to 10% SDS-PAGE, and transferred onto nitrocellulose or polyvinylidene difluoride membranes. The membranes were blocked with 5% bovine serum albumin and 0.1% Tween 20 in Tris-buffered saline, and incubated with antiproliferating cell nuclear antigen (PCNA), anti-β-actin, anti-Sphk1 (20), antiphospho-Erk (p-Erk), anti-Erk, antiadiponectin, or antileptin antibodies (see Table 1). Protein bands were visualized using secondary antibodies (Amersham), an Amersham ECL Prime system, and a LAS-4000 Luminescent Image Analyzer (Fujifilm). Data were quantified using Multi Gauge Ver3.0 software (Fujifilm).
Table 1.
Antibody Table
| Peptide/Protein Target | Antigen Sequence (if Known) | Name of Antibody | Manufacturer, Catalog Number, and/or Name of Individual Providing the Antibody | Species Raised in; Monoclonal or Polyclonal | Dilution Used | DOI or Publication Data |
|---|---|---|---|---|---|---|
| PCNA | Rat PCNA made in the protein A expression vector pR1T2T | PCNA (PC10) | Santa Cruz Biotechnology, Inc, sc-56 | Mouse; monoclonal | 50 (WB[Millipore SNAP i.d]) | 10.1016/j.imlet.2013.12.020 |
| Cd11c | Mouse spleen dendritic cells | Integrin αX antibody (N418) | Santa Cruz Biotechnology, Inc, sc-23951) | Armenian hamster; monoclonal | 50 (IHC) | 10.1167/iovs.14-14307 |
| Sphk1 | Mouse SPHK1 C-terminal residue (APSGRDSRRGPPPEEP) | Anti-SPHK1a | Homemade by Terada et al | Rabbit; polyclonal | 50 (IHC, WB [Millipore SNAP i.d]) | 10.1002/cne.11002 |
| β-Actin | Gizzard actin of avian origin | β-Actin (C4) | Santa Cruz Biotechnology, Inc, sc-47778 | Mouse; monoclonal | 50 (WB[Millipore SNAP i.d]) | 10.1016/j.cellsig.2013.11.012 |
| p-Erk1/2 | A synthetic phosphopeptide corresponding to residues surrounding Thr202/Tyr204 of human p44 MAPK | Phospho-p44/42 MAPK (Erk1/2) (Thr202/Tyr204) (D13.14.4E) XP rabbit mAb | Cell Signaling, 4370S | Rabbit; monoclonal | 2000 (WB) | 10.1002/jcb.25032 |
| Erk1/2 | A synthetic peptide (KLH coupled) derived from a sequence in the C terminus of rat p44 MAPK | p44/42 MAPK (Erk1/2) antibody | Cell Signaling, 9102S | Rabbit; polyclonal | 2000 (WB) | 10.1158/0008-5472.CAN-12-3023 |
| Adiponectin | A synthetic peptide derived from a sequence in the internal region of human Acrp30 | Acrp30 (A-123) | Santa Cruz Biotechnology, Inc, sc-26497 | Goat; polyclonal | 50 (WB[Millipore SNAP i.d]) | 10.1074/jbc.M605132200 |
| Leptin | A recombinant protein coding amino acids 22–167 of human Ob | Ob (H-146) | Santa Cruz Biotechnology, Inc, sc-9014 | Rabbit; polyclonal | 50 (WB[Millipore SNAP i.d]) | 10.1074/jbc.270.46.27728 |
Abbreviations: WB, Western blotting; IHC, immunohistochemistry.
Statistics
All experimental data were shown as mean ± SEM (n, sample numbers). Statistical comparisons were performed using an unpaired 2-tailed Student's t test. Significance was defined as P < .05.
Results
HFD-induced glucose intolerance/insulin resistance is attenuated in S1pr2−/− mice
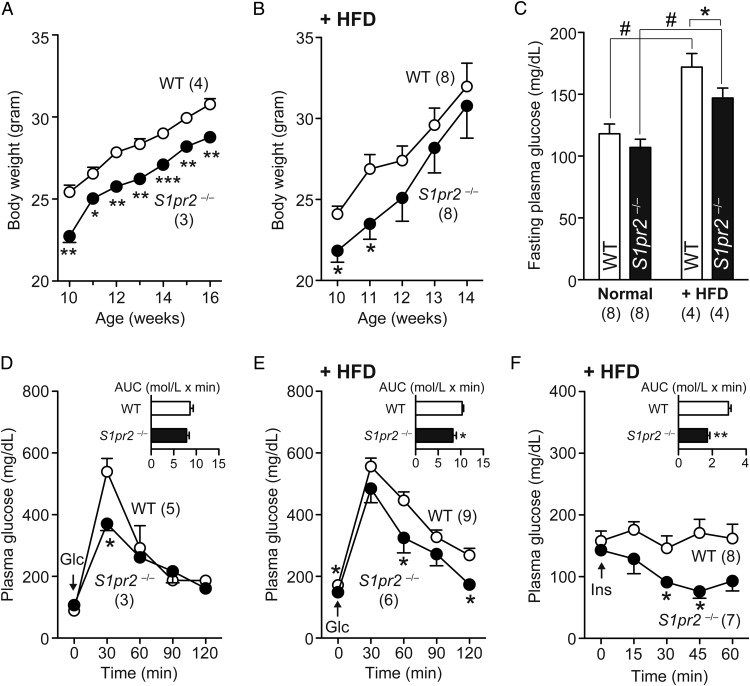
Our initial observation was the smaller body weights of S1pr2−/− mice compared with WT mice through adult development (Figure 1A), which might be attributable to frequent spontaneous seizures during juvenile development (23). Interestingly, the body weight differences between these mice diminished after 4 weeks of feeding with the HFD (Figure 1B). Fasting plasma glucose levels were similar between WT and S1pr2−/− mice, but HFD (for 4 wk)-induced increases in these levels were smaller in S1pr2−/− mice (Figure 1C). The glucose tolerance activity evaluated using ip-GTT was equivalent between WT and S1pr2−/− mice (Figure 1D), but HFD-induced glucose intolerance was less apparent in S1pr2−/− mice; the area under the curve (AUC) was 19.8% lower than that of WT mice (Figure 1E). HFD also caused insulin resistance in WT mice but not in S1pr2−/− mice; the AUC was 42.0% lower in S1pr2−/− mice (Figure 1F). These results indicate that S1pr2−/− mice are protected against HFD-induced glucose intolerance/insulin resistance, but not from HFD-induced body weight gain.
Figure 1.
HFD-induced glucose intolerance and insulin resistance are attenuated in S1pr2−/− mice. Ten-week-old WT and S1pr2−/− male mice were fed a HFD for 4 weeks. A, Body weight changes after feeding a normal diet. B, Body weight changes after feeding a HFD. C, Fasting plasma glucose levels in normal diet- and HFD-fed WT and S1pr2−/− mice. D, ip-GTT in normal diet-fed WT and S1pr2−/− mice. E, ip-GTT in HFD-fed WT and S1pr2−/− mice. F, ip-ITT in HFD-fed WT and S1pr2−/− mice. In D–F, the AUCs are shown as inset graphs. Data are mean ± SEM (n, sample numbers); *, P < .05 and **, P < .01 vs WT samples; and #, P < .05 vs normal diet-fed samples (t test).
HFD-induced adipocyte hypertrophy/inflammation is attenuated in S1pr2−/− mice
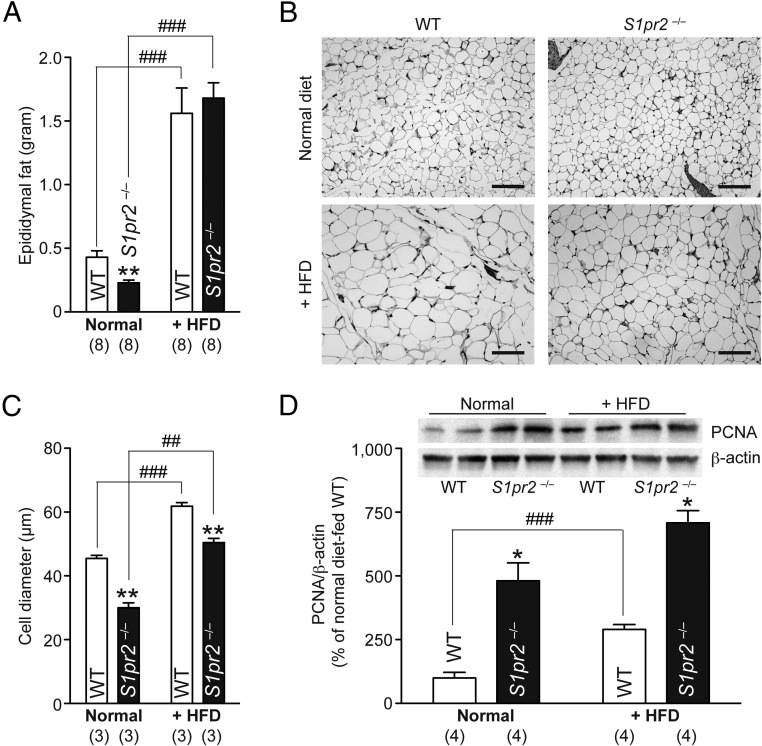
Epididymal fat tissue weights in S1pr2−/− mice were 46.5% lower than those in WT mice (Figure 2A). Histological analyses of epididymal adipocytes (Figure 2B) identified that S1pr2−/− adipocytes were smaller in size (Figure 2C) and expressed higher levels of PCNA, a cell proliferation marker (Figure 2D). HFD for 4 weeks induced significant increases in epididymal fat tissue weights in both WT and S1pr2−/− mice; there was no other significant differences (Figure 2A) just as in body weights (Figure 1B). However, the epididymal adipocytes were much smaller and expressed more PCNA in HFD-fed S1pr2−/− mice (Figure 2, C and D, respectively). These results suggest that HFD causes less adipocyte hypertrophy (enlargement) and more adipocyte hyperplasia (proliferation) in S1pr2−/− mice.
Figure 2.
HFD-induced adipocyte hyperplasia/proliferation in S1pr2−/− mice. Ten-week-old WT and S1pr2−/− mice were fed a HFD for 4 weeks. A, Epididymal fat tissue weights of normal diet- and HFD-fed mice. B, Hematoxylin/eosin-stained epididymal fat tissue sections. Scale bar, 50 μm. C, Average diameters of 300 epididymal adipocytes in each mouse line. D, Western blot analysis of PCNA expression in epididymal fat tissues. Representative blot images (duplicate) are shown as insets, and PCNA expression was quantified by normalization with β-actin levels. Data are mean ± SEM (n, sample numbers); **, P < .01 and ***, P < .001 vs WT samples; and ##, P < .01 and ###, P < .001 vs normal diet-fed samples (t test).
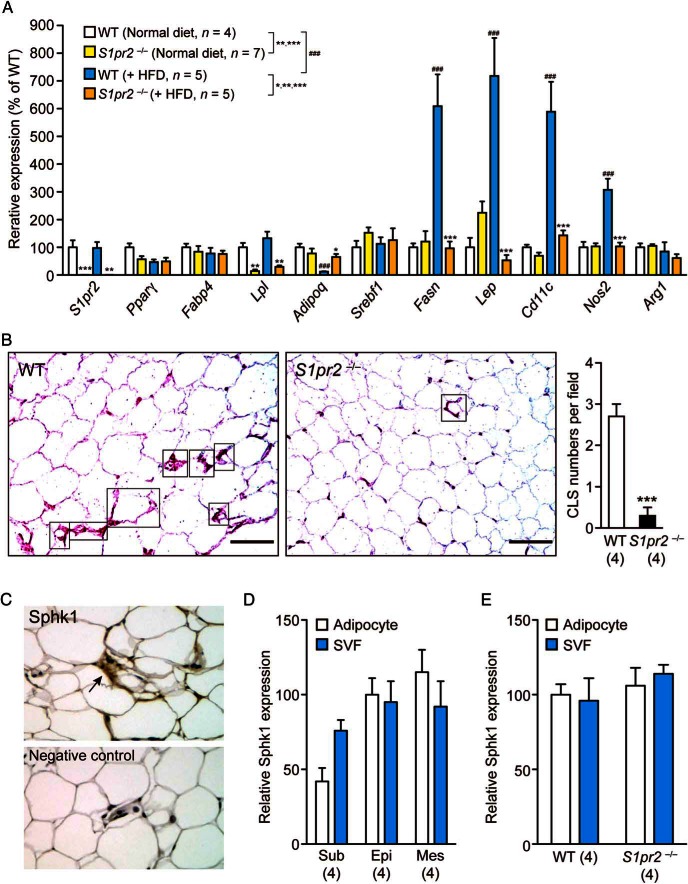
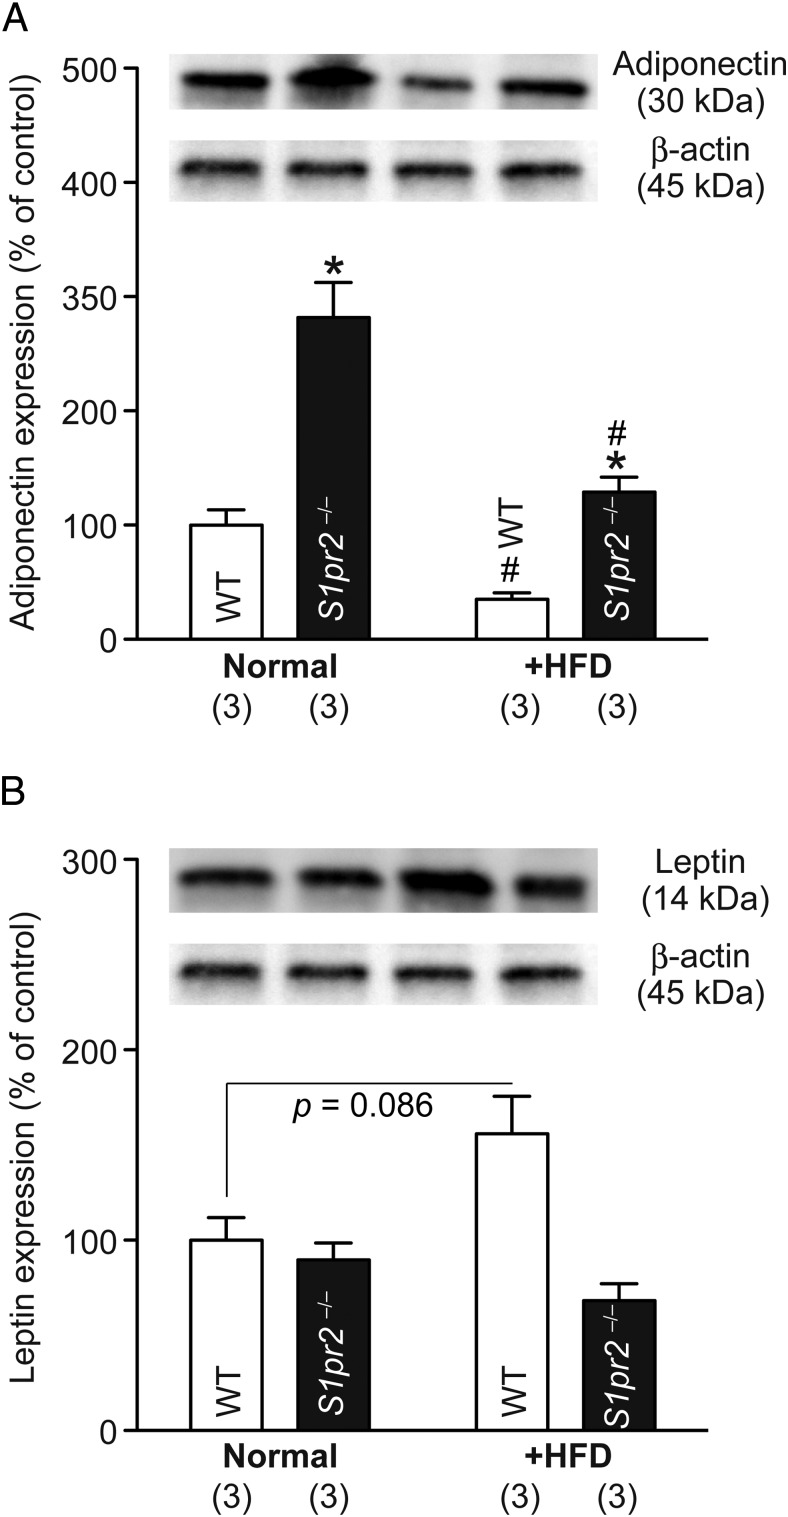
We next examined the expression of adipocyte-specific genes by quantitative PCR and the polarization of macrophages by immunostaining in the epididymal fat tissues. The expression level of S1pr2 was not altered in WT tissues by the HFD and was not detected at all in S1pr2−/− tissues (Figure 3A). No significant differences or changes were observed in Pparγ, Fabp4, or Srebf1 levels, whereas Lpl levels were significantly lower in S1pr2−/− tissues irrespective of the diet (Figure 3A). HFD induced a significant decrease in Adipoq levels and significant increases in the levels of Fasn, Lep, and 2 M1 macrophage markers (Cd11c and Nos2) in WT tissues, but such effects were totally or mostly absent in S1pr2−/− tissues (Figure 3A). HFD decreased protein levels of adiponectin in both WT and S1pr2−/− mice but the levels were still higher in HFD-fed S1pr2−/− mice (Figure 4A) and HFD increased protein levels of leptin in WT but not S1pr2−/− mice (Figure 4B), partially reflecting the mRNA level changes. The mRNA expression of an M2 macrophage marker (Arg1) was not significantly affected by HFD or S1pr2 deletion (Figure 3A). Histological analyses of epididymal fat tissues identified many crown-like structures (CLSs) (structures formed by Cd11c-positive M1 macrophages that surround dying or dead adipocytes) in HFD-fed WT mice but much fewer were observed in HFD-fed S1pr2−/− mice (Figure 3B), and no CLSs were found in normal diet-fed WT and S1pr2−/− mice (data not shown). These results suggest that HFD-induced M1 (not M2) macrophage recruitment to adipose tissues (ie, adipose inflammation) is significantly suppressed in S1pr2−/− mice.
Figure 3.
HFD-induced inflammation of epididymal adipocytes is attenuated in S1pr2−/− mice. A, Expression levels of various adipocyte-specific genes in the epididymal fat tissues of HFD-fed WT and S1pr2−/− mice. Data are mean ± SEM; *, P < .05; **, P < .01; and ***, P < .001 vs WT samples; and ###, P < .001 vs normal diet-fed samples (t test). B, Distribution of CLSs (indicated by rectangles) identified by Cd11c staining. (purple). The number of CLSs (in which at least two-thirds of the cell periphery was stained with Cd11c) per microscopic field was counted. Data are mean ± SEM (n, sample numbers); ***, P < .001 (t test). Scale bar, 50 μm. C, Representative image of Sphk1 staining of epididymal fat tissues in WT mice. A negative control (no Sphk1 antibody) image is attached. D, Sphk1 expression levels in isolated adipocyte fraction and SVF of sc (Sub), epididymal (Epi), and mesenteric (Mes) fat cells isolated from WT mice. E, Sphk1 expression levels in epididymal adipocytes and SVF isolated from WT and S1pr2−/− mice. Data are mean ± SEM (n, sample numbers); no significant difference was observed in D and E.
Figure 4.
Higher adiponectin expression and lower leptin expression in epididymal adipocytes of HFD-fed S1pr2−/− mice compared with HFD-fed WT mice. Expression of adiponectin (A) and leptin (B) was examined by Western blot analysis in epididymal adipocytes of normal diet/HFD-fed WT and S1pr2−/− mice. The average of expression relative to β-actin levels in normal diet-fed WT mice was set as 100%. Data are mean ± SEM (n, sample numbers); *, P < .05 vs WT samples; and #, P < .05 vs normal diet-fed samples (t test). The representative picture data are shown in the inset.
A previous study demonstrated that a HFD significantly increased S1P contents in epididymal fat tissues of WT mice and that these increases are much less in Sphk1-deficient mice (24). Our histological analyses revealed the expression of Sphk1 in epididymal fat tissues (Figure 3C). The expression of Sphk1 in fat tissues was ubiquitous because it was detected in both adipocytes and SVF of all sc, epididymal, and mesenteric fat cells (Figure 3D). The Sphk1 expression in epididymal adipocytes and SVF was comparable between WT and S1pr2−/− (Figure 3E).
S1pr2 antagonist induces, whereas S1pr1/S1pr3 antagonist inhibits, adipocyte proliferation
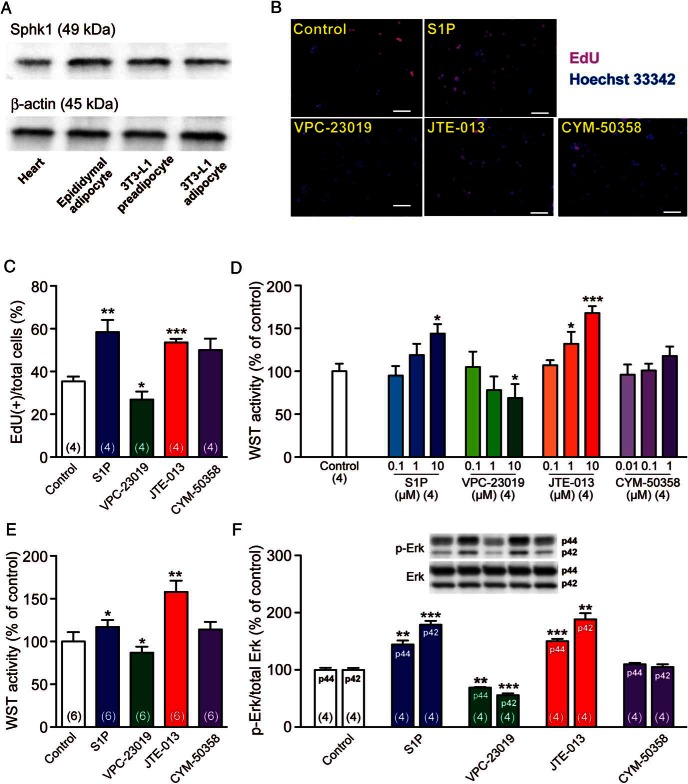
To gain further insight on S1pr subtypes involved in adipocyte functions, the effects of S1P and various S1pr antagonists on the proliferation of preadipocyte cell lines were examined. We first confirmed the substantial expression of Sphk1, the major cellular and secreted source of S1P (24), in 3T3-L1 preadipocytes/differentiated adipocytes, which was equivalent to that in mouse epididymal adipocytes and higher than that in mouse hearts (Figure 5A). S1P significantly potentiated the proliferation of 3T3-L1 preadipocytes, as indicated by increased EdU labeling (Figure 5, B and C) and WST activity (Figure 5D). Moreover, VPC-23019 (S1pr1/S1pr3 antagonist) inhibited the proliferation of 3T3-L1 preadipocytes, whereas JTE-013 (S1pr2 antagonist) potentiated it and CYM-50358 (S1pr4 antagonist) had no significant effect (Figure 5, B–D). Similar results were obtained in the WST assay of 3T3-F442A preadipocytes (Figure 5E). These results suggest that S1pr1 and/or S1pr3 mediate the proliferative effects of S1P and S1pr2 antagonizes them. We then investigated the phosphorylation (ie, activation) of Erk, which is involved in S1P-mediated cell proliferation (25) and located downstream of S1pr1, S1pr2, and S1pr3 signaling (26). S1P and JTE-013 increased the phosphorylated forms of Erk (both p44 and p42) in 3T3-L1 preadipocytes, whereas VPC-23019 decreased them and CYM-50358 had no effect (Figure 5F). Therefore, S1P induced cell proliferation (and Erk activation) of 3T3-L1 preadipocytes probably via S1pr1 and/or S1pr3, and the S1pr2 signaling counteracted it.
Figure 5.
S1P and S1pr antagonists regulate preadipocyte proliferation. A, Western blot analysis of Sphk1 expression in the heart, epididymal adipocytes, and preadipocytic/differentiated 3T3-L1 cells. β-Actin was detected as loading controls. B, Representative fluorescent images of EdU (red)-labeled and Hoechst 33342 (blue)-labeled 3T3-L1 preadipocytes after a 24-hour incubation with S1P (10μM), VPC-23019 (10μM), JTE-013 (10μM), or CYM-50358 (1μM). Scale bar, 100 μm. C, Percentages of EdU-labeled (proliferative) cells/Hoechst 33342-labeled (total) cells. Over 100 Hoechst 33342-labeled cells were counted in 4 independent wells. D, WST proliferation assay of 3T3-L1 adipocytes after a 24-hour incubation with graded concentrations of S1P, VPC-23019, JTE-013, or CYM-50358. E, WST proliferation assay of 3T3-F442A adipocytes after a 24-hour incubation with S1P (10μM), VPC-23019 (10μM), JTE-013 (10μM), or CYM-50358 (1μM). F, Western blot analyses of 3T3-L1 preadipocytes using anti-Erk and anti-p-ERK antibodies. Cells were incubated with S1P (10μM), VPC-23019 (10μM), JTE-013 (10μM), or CYM-50358 (1μM) for 1 hour, and cell lysates were analyzed for Erk phosphorylation/activation. Representative images are presented. Data are mean ± SEM (n, sample numbers); *, P < .05; **, P < .01; and ***, P < .001 vs control samples (t test).
S1pr2 antagonist inhibits, whereas S1pr1/S1pr3 antagonist induces, adipogenic differentiation
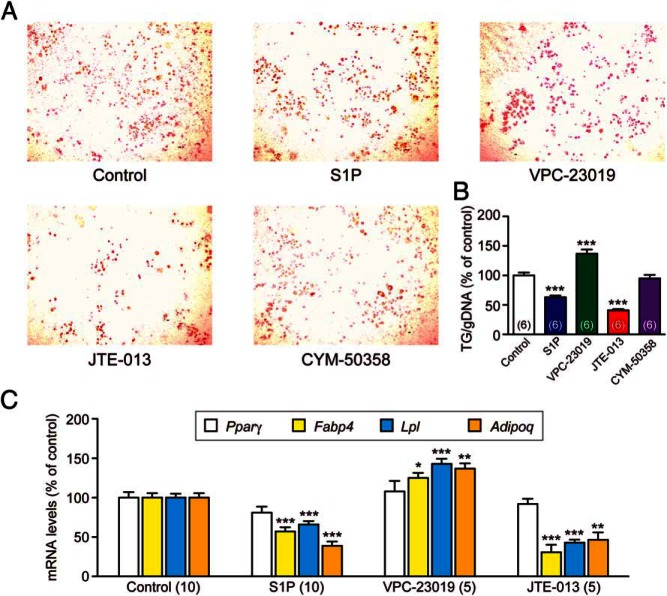
3T3-L1 preadipocytes require pharmacological stimulation (eg, with dexamethasone, 3-isobutyl-methylxanthine, and insulin) for adipogenic differentiation (27). In contrast, 3T3-F442A preadipocytes spontaneously differentiate into adipocytes, which is potentiated by insulin; therefore, to simplify the system, we examined the role of S1P/S1pr in insulin-potentiated adipogenic differentiation of 3T3-F442A preadipocytes. S1P or JTE-013 treatment of 3T3-F442A preadipocytes significantly suppressed adipogenic differentiation, whereas VPC-23019 activated it and CYM-50358 had no effect (Figure 6, A and B). Quantitative PCR analysis showed that S1P and JTE-013 suppressed the expression of adipocyte-specific genes, Fabp4, Lpl, and Adipoq (although not for Pparγ), and that VPC-23019 increased the expression of Fabp4, Lpl, and Adipoq (although not for Pparγ) (Figure 6C). These results imply that S1P promotes adipogenic differentiation of 3T3-F442A preadipocytes via S1pr1/S1pr3 and inhibits it via S1pr2.
Figure 6.
S1P and S1pr antagonists regulate adipogenic differentiation of 3T3-F442A preadipocytes. When 3T3-F442A preadipocytes reached confluence, insulin (10nM) plus S1P (10μM), VPC-23019 (10μM), JTE-013 (10μM), or CYM-50358 (1μM) were added and incubated for 5 days. A, Representative images of Oil-Red O staining. B, Triglyceride (TG) contents were examined by Oil-Red O staining and normalized by genomic DNA (gDNA) contents in the cell lysates. C, Effects of S1P (10μM), VPC-23019 (10μM), and JTE-013 (10μM) on the expression of adipocyte-specific genes: Pparγ, Fabp4, Lpl, and Adipoq. Data are mean ± SEM (n, sample numbers); *, P < .05; **, P < .01; and ***, P < .001 vs control samples (t test).
S1pr2 knockdown inhibits, but S1pr1 knockdown induces, adipogenic differentiation
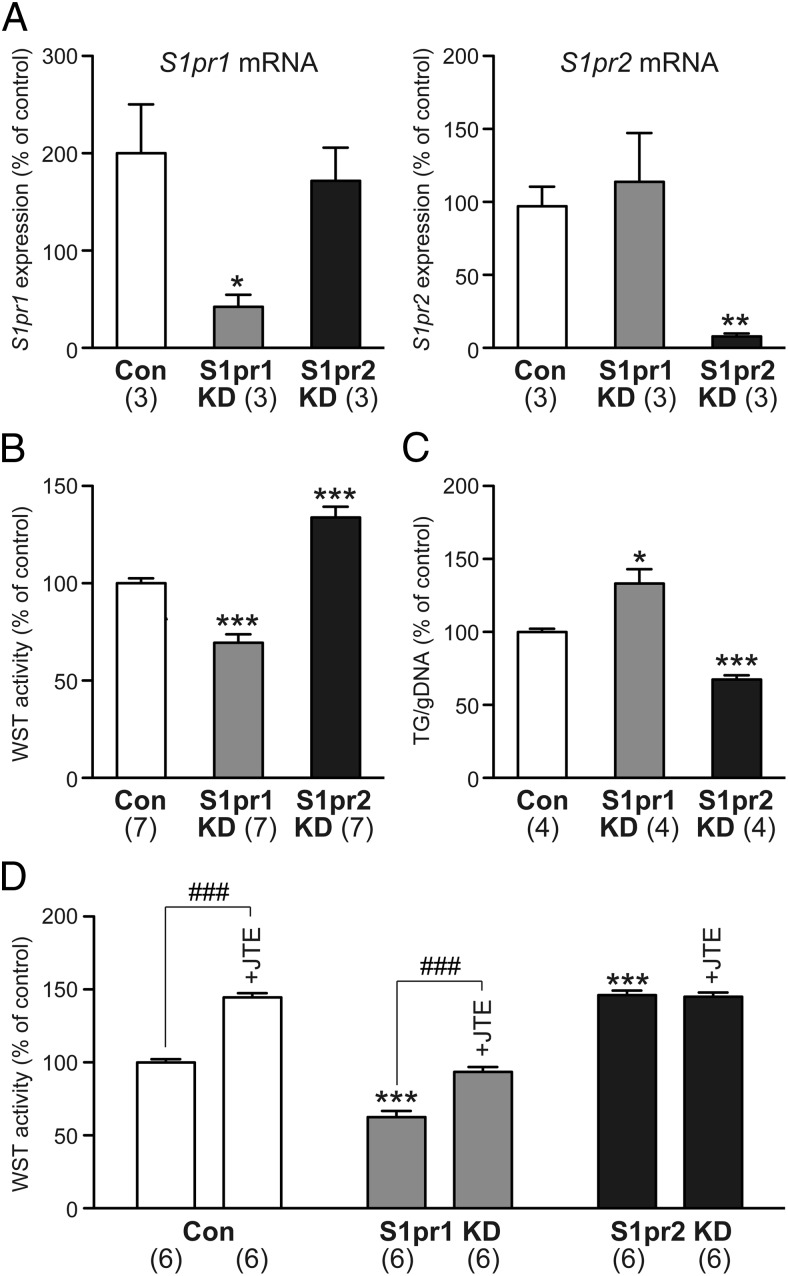
Because both VPC-23019 and JTE-013 regulated differentiation of 3T3-F442A preadipocytes (Figure 6), these cells were employed for S1pr1/S1pr2 knockdown experiments. Successful siRNA knockdown of S1pr1 and S1pr2 genes was confirmed by quantitative PCR (Figure 7A). The siRNA knockdown of S1pr2 induced, whereas that of S1pr1 inhibited, cell proliferation (Figure 7B). In contrast, S1pr2 knockdown inhibited but S1pr1 knockdown induced adipogenic differentiation (Figure 7C). The cell proliferative effect of JTE-013 was present in S1pr1 knockdown 3T3-F442A cells but absent in S1pr2 knockdown cells, suggesting the specific blockade of S1pr2 signaling by JTE-013 in these cells (Figure 7D).
Figure 7.
The siRNA knockdown of S1pr1 and S1pr2 regulates proliferation and differentiation of 3T3-F442A preadipocytes. A, S1pr1 knockdown (KD) reduced mRNA expression of S1pr1 but not S1pr2, whereas S1pr2 KD reduced mRNA expression of S1pr2 but not S1pr1. B, S1pr1 KD inhibited but S1pr2 KD activated cell proliferation. C, S1pr1 KD activated but S1pr2 KD inhibited adipogenic differentiation. D, S1pr2 KD but not S1pr1 KD abolished JTE-013 (10μM)-induced cell proliferation. The mRNA expression, WST activity, and triglyceride (TG) contents (normalized by genomic DNA [gDNA] levels) in control cells transfected with control siRNA were set as 100%. Data are mean ± SEM (n, sample numbers); *, P < .05; **, P < .01; and ***, P < .001 vs control samples; ###, P < .001 vs no JTE-013 samples (t test).
JTE-013 administration improves glucose tolerance/insulin sensitivity in ob/ob mice
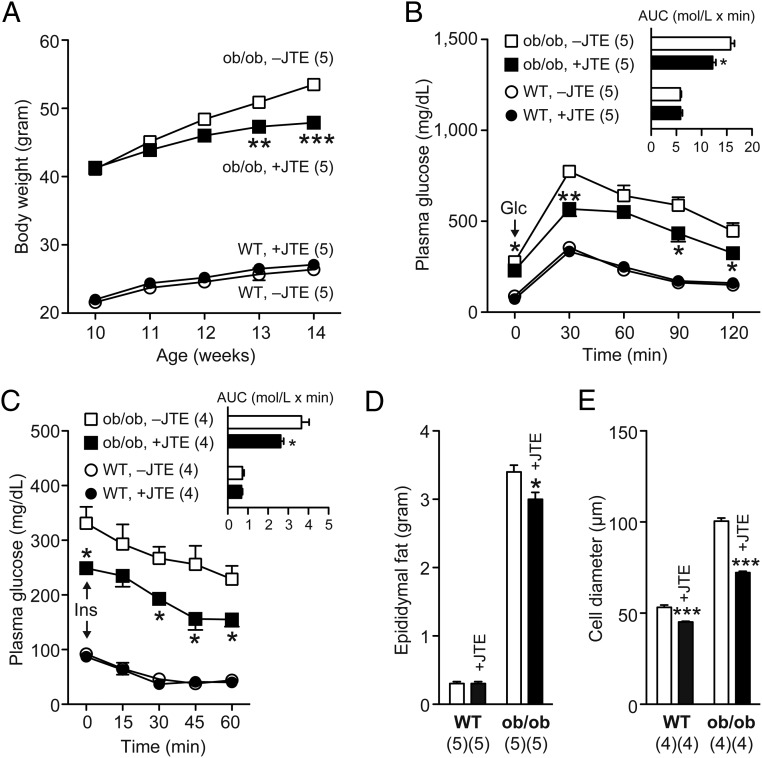
To generalize the systemic effect of the S1pr2 blockade on glucose intolerance/insulin resistance under obese/diabetic states, JTE-013 was orally administrated with genetically obese ob/ob mice, a model of type 2 diabetes (28). JTE-013 administration induced gradual recession in age-dependent body weight increase of ob/ob mice but not WT mice; the suppressive effects became statistically significant after 3 weeks of feeding (Figure 8A). Moreover, JTE-013 administration (for 4 wk) significantly improved both glucose tolerance and insulin sensitivity; the AUC became 22.6% and 28.3% lower, respectively, by JTE-013 only in ob/ob mice (Figure 8, B and C, respectively). JTE-013 also reduced epididymal fat weights in ob/ob mice but not WT mice (Figure 8D). In contrast, JTE-013 decreased average cell diameters of epididymal adipocytes in both WT and ob/ob mice, but the effects were more potent in ob/ob mice (Figure 8E).
Figure 8.
Oral JTE-013 administration reduces body/epididymal fat tissue and improves glucose tolerance and insulin sensitivity in ob/ob mice. A, Ten-week-old WT and ob/ob mice were fed a normal diet powder containing JTE-013 for 4 weeks. A, Body weight changes after the diet change. B, ip-GTT. C, ip-ITT. In B and C, the AUCs are shown as inset graphs. D, Epididymal fat weights after 4 weeks. E, Average diameters of 300 epididymal adipocytes. Data are mean ± SEM (n, sample numbers); *, P < .05; **, P < .01; ***, P < .01 vs no JTE-013 samples (t test).
Discussion
A wide range of cellular actions by S1P is mediated via 5 S1prs and their downstream effectors (8, 10, 11). Previous studies using mice lacking each, or a combination of, S1pr1–S1pr5 have contributed greatly to our insights into their specific functions (11). For example, the genetic depletion of S1pr1 in mice resulted in embryonic lethality owing to impaired vascular maturation (29), whereas S1pr2−/− mice developed with no apparent abnormality except for spontaneous seizures during juvenile development (18, 23). In the present study, we investigated the role of S1P/S1pr in (pre)adipocyte growth and differentiation using S1pr2−/− mice and S1pr1–S1pr4 subtype-specific antagonists because adipocyte hypertrophy/inflammation have been increasingly recognized as major contributors to obesity-induced systemic insulin resistance (30) and S1P has been shown to regulate insulin signaling (14). Impaired adipogenesis due to nutritional overload induces ectopic lipid deposition in insulin-sensitive tissues such as liver, pancreas, and skeletal muscles, and disrupts their normal metabolic functions, thereby causing systemic insulin resistance, which may progress to type 2 diabetes (30). Thus, we also examined the efficacy of JTE-013 against glucose intolerance/insulin resistance in ob/ob mice, an established model of type 2 diabetes.
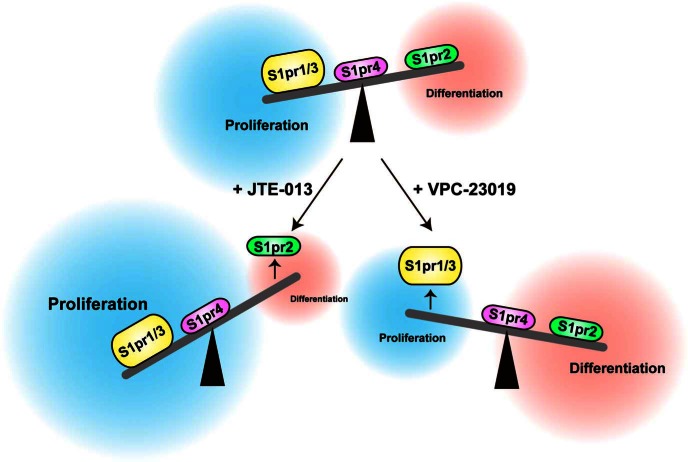
Here, we demonstrated that 1) S1pr2−/− mice are protected from HFD-induced systemic glucose intolerance/insulin resistance (Figure 1), 2) HFD-induced adipocyte hypertrophy is attenuated in S1pr2−/− mice (Figure 2), 3) HFD-induced adipocyte inflammation is almost absent in S1pr2−/− mice (Figure 3), 4) S1P activates preadipocyte proliferation via S1pr1/S1pr3 but inhibits it via S1pr2 (Figures 5 and 7), 5) S1P inhibits preadipocyte differentiation via S1pr1/S1pr3 but activates it via S1pr2 (Figures 6 and 7), and 6) oral administration of JTE-013 improves glucose tolerance/insulin sensitivity in ob/ob mice (Figure 8). Our proposed scheme is presented in Figure 9. These results may explain the highly proliferative (Figure 2D) but less differentiative (Figure 3A) nature of epididymal adipocytes in HFD-fed S1pr2−/− mice. The HFD used in this study contains 32.0% crude fat (∼7-fold of normal diet) and may provide much larger amounts of S1P precursors, such as sphingosine, ceramide, and palmitate (14). Wang et al reported that their palmitate-rich HFD not only increased S1P accumulation but also induced Sphk1 mRNA expression in mouse epididymal fat tissues (24). Therefore, S1P is considered to be especially abundant in adipose tissues under HFD-induced obese states. Unfortunately, direct S1P quantification in biological samples was not possible in this study. The S1prs have been shown to often act adversely. S1P regulates Rac activation and cell migration positively via S1pr1/S1pr3 but negatively via S1pr2 in transfected CHO cells (26). The metastasis of B16F10 melanoma cells was activated substantially when S1pr1 was overexpressed but inhibited when S1pr2 was overexpressed (31). The expression of S1PR/S1pr1–3 is ubiquitous among human/mouse organs (compared with S1PR/S1pr4/5) (10, 32); therefore, dual regulation by the S1pr1/S1pr3–S1pr2 axis (Figure 9) may be common throughout the body, which could modify adipocyte functions, especially in S1P-rich obese states.
Figure 9.
Proposed scheme for S1P regulation of adipocyte proliferation and differentiation by the S1pr1/S1pr3–S1pr2 axis. JTE-013 was used as a S1pr2-specific antagonist and VPC-23019 as a S1pr1/S1pr3-specific antagonist.
Previous studies linked obesity-induced insulin resistance to the low-grade inflammation of adipose tissue, which is characterized by macrophage infiltration and polarization from M2 to M1 (5, 6). In addition to proinflammatory and antiinflammatory cytokines such as monocyte chemotactic protein-1 and TNFα (30), some fatty acids and lipid mediators were suggested to associate with adipocyte hypertrophy (33). HFD-induced mRNA expression of the M1 macrophage markers Cd11c and Nos2 was attenuated (Figure 3A), and HFD-induced increases of Cd11c-positive CLS (a hallmark for adipocyte inflammation) were much less apparent (Figure 3B) in S1pr2−/− epididymal fat tissues, compared with corresponding WT tissues. These results imply that the obesity-induced inflammation of adipose tissues is almost abrogated in S1pr2−/− mice. Previous studies reported that the production of adiponectin is suppressed in hypertrophic adipocytes (4), and that the mild prevention of adipocyte hypertrophy by a PPARγ/RXR inhibitor (HX531) results in increased adiponectin production (34). Therefore, much higher adiponectin mRNA/protein expression in epididymal adipocytes of HFD-fed S1pr2−/− mice (compared with HFD-fed WT mice) (Figures 3A and 4A) may be attributable to their less hypertrophic (Figure 2, B and C) and more proliferative (Figure 2D) phenotypes, conferring improved systemic insulin sensitivity (Figure 1F) and glucose tolerance (Figure 1E) in HFD-induced obese states.
S1P is known to activate the proliferation of various cell types, and we used 2 preadipocyte cell lines to investigate the roles of S1P/S1prs for adipocyte proliferation and differentiation. We here found that S1P (10μM) activates proliferation of both 3T3-L1 and 3T3-F442A preadipocytes (Figure 5, B–E). Recently, Hashimoto et al reported that S1P treatment (1μM) does not activate proliferation of C3H10T1/2 multipotent stem cells that could differentiate into either adipocytes or osteoblasts (35), but 1μM may not be sufficient to activate cell proliferation significantly (Figure 5D). JTE-013 (10μM) was more potent than S1P (10μM) in the activation of 3T3-L1/3T3-F442A cell proliferation (Figure 5, D and E), suggesting that the S1P concentration in 3T3-L1/3T3-F442A culture media could be over 10μM. The siRNA knockdown of S1pr2 (not S1pr1) induced proliferation and inhibited differentiation of 3T3-F442A preadipocytes without exogenous S1P, also indicating the actions by substantial levels of S1P in culture media (Figure 7, B–D).
Several lines of evidence have shown that S1P/S1pr modulates insulin resistance in various tissues such as the liver, skeletal muscles, and pancreas (14). In the liver, S1P counteracts insulin-mediated Akt phosphorylation via S1pr2, thereby attenuating glucokinase expression/glycogen synthase activation and hence diminishing glycogen synthesis (36). In skeletal muscle, S1P stimulates IL-6 production via S1pr3 and thereby inhibits insulin signaling, or induces Ca2+-dependent generation of reactive oxygen species via S1pr2 and thus activates protein tyrosine phosphatase 1B, which negatively regulates insulin signaling (14). In pancreatic β-cells, S1P activates JNK and inhibits Akt signaling via S1pr2, and thereby counteracts insulin signaling (37). JTE-013 administration was effective in preserving β-cells when mice were fed a HFD (a model of type 2 diabetes) (37) or received streptozotocin (a model of type 1 diabetes) (38). We previously confirmed the attenuated streptozotocin-induced apoptosis of β-cells in S1pr2−/− mice (38). Thus, the blockade of S1pr2 signaling, by either gene deletion or oral antagonist administration, could improve systemic glucose tolerance/insulin sensitivity (Figures 1, E and F, and 8, B and C) by influencing various insulin-sensitive tissues simultaneously.
In conclusion, S1P regulated the proliferation and adipogenic differentiation of (pre)adipocytes in vivo and in vitro, and its overall direction was modulated by the S1pr1/S1pr3–S1pr2 axis (Figure 9). The specific blockade of S1pr2 signaling may represent a novel therapeutic strategy for obesity and type 2 diabetes.
Acknowledgments
S.K. is a research fellow of Japan Society for the Promotion of Science.
Author contributions: Y.K., K.K., K.T., I.M., M.Y., T.Ik., M.K., M.A., T.K., and S.K. researched data; T.Is., Y.B., I.K., J.C., I.I., and H.M. contributed to discussion/review/edit manuscript; Y.K., K.K., I.I., and H.M. project management, wrote manuscript, and researched data; all authors approved final version of manuscript.
This work was supported in part by the joint research program of the Institute for Molecular and Cellular Regulation, Gunma University. J.C. was supported by the National Institutes of Health. I.I. was supported by Keio University Special Grant-in-Aid for Innovative Collaborative Research Project and Keio Gijuku Fukuzawa Memorial Fund.
Disclosure Summary: The authors have nothing to disclose.
Footnotes
- Adipoq
- adiponectin, C1Q and collagen domain containing
- AUC
- area under the curve
- CLS
- crown-like structure
- EdU
- 5-ethynyl-2′-deoxyuridine
- f
- forward
- Fabp4
- fatty acid binding protein 4
- GTT
- glucose tolerance test
- HFD
- high-fat diet
- ITT
- insulin tolerance test
- Lpl
- lipoprotein lipase
- Nos2
- nitric oxide synthase 2, inducible
- PCNA
- proliferating cell nuclear antigen
- p-Erk
- phospho-Erk
- PPAR
- peroxisome proliferator-activated receptor
- r
- reverse
- siRNA
- small interfering RNA
- S1P
- sphingosine 1-phosphate
- S1pr1
- S1P receptor 1
- Sphk
- sphingosine kinase
- SVF
- stromal vascular fraction
- WT
- wild type.
References
- 1. Leonhardt W, Hanefeld M, Schneider H, Haller H. Human adipocyte volumes: maximum size, and correlation to weight index in maturity onset-diabetes. Diabetologia. 1972;8:287–291. [DOI] [PubMed] [Google Scholar]
- 2. Inoue N, Yahagi N, Yamamoto T, et al. Cyclin-dependent kinase inhibitor, p21WAF1/CIP1, is involved in adipocyte differentiation and hypertrophy, linking to obesity, and insulin resistance. J Biol Chem. 2008;283:21220–21229. [DOI] [PMC free article] [PubMed] [Google Scholar]
- 3. Yamauchi T, Kamon J, Waki H, et al. The mechanisms by which both heterozygous peroxisome proliferator-activated receptor γ (PPARγ) deficiency and PPARγ agonist improve insulin resistance. J Biol Chem. 2001;276:41245–41254. [DOI] [PubMed] [Google Scholar]
- 4. Yamamoto K, Kiyohara T, Murayama Y, et al. Production of adiponectin, an anti-inflammatory protein, in mesenteric adipose tissue in Crohn's disease. Gut. 2005;54:789–796. [DOI] [PMC free article] [PubMed] [Google Scholar]
- 5. Kanda H, Tateya S, Tamori Y, et al. MCP-1 contributes to macrophage infiltration into adipose tissue, insulin resistance, and hepatic steatosis in obesity. J Clin Invest. 2006;116:1494–1505. [DOI] [PMC free article] [PubMed] [Google Scholar]
- 6. Harford KA, Reynolds CM, McGillicuddy FC, Roche HM. Fats, inflammation and insulin resistance: insights to the role of macrophage and T-cell accumulation in adipose tissue. Proc Nutr Soc. 2011;70:408–417. [DOI] [PubMed] [Google Scholar]
- 7. Maceyka M, Payne SG, Milstien S, Spiegel S. Sphingosine kinase, sphingosine-1-phosphate, and apoptosis. Biochim Biophys Acta. 2002;1585:193–201. [DOI] [PubMed] [Google Scholar]
- 8. Kihara Y, Maceyka M, Spiegel S, Chun J. Lysophospholipid receptor nomenclature review: IUPHAR review 8. Br J Pharmacol. 2014;171:3575–3594. [DOI] [PMC free article] [PubMed] [Google Scholar]
- 9. Wang F, Van Brocklyn JR, Hobson JP, et al. Sphingosine 1-phosphate stimulates cell migration through a G (i) -coupled cell surface receptor. Potential involvement in angiogenesis. J Biol Chem. 1999;274:35343–35350. [DOI] [PubMed] [Google Scholar]
- 10. Ishii I, Fukushima N, Ye X, Chun J. Lysophospholipid receptors: signaling and biology. Annu Rev Biochem. 2004;73:321–354. [DOI] [PubMed] [Google Scholar]
- 11. Takuwa Y, Okamoto Y, Yoshioka K, Takuwa N. Sphingosine-1-phosphate signaling in physiology and diseases. Biofactors. 2012;38:329–337. [DOI] [PubMed] [Google Scholar]
- 12. Taha TA, Argraves KM, Obeid LM. Sphingosine-1-phosphate receptors: receptor specificity versus functional redundancy. Biochim Biophys Acta. 2004;1682:48–55. [DOI] [PubMed] [Google Scholar]
- 13. Mandala S, Hajdu R, Bergstrom J, et al. Alteration of lymphocyte trafficking by sphingosine-1-phosphate receptor agonists. Science. 2002;296:346–349. [DOI] [PubMed] [Google Scholar]
- 14. Fayyaz S, Japtok L, Kleuser B. Divergent role of sphingosine 1-phosphate on insulin resistance. Cell Physiol Biochem. 2014;34:134–147. [DOI] [PubMed] [Google Scholar]
- 15. Silva VR, Micheletti TO, Pimentel GD, et al. Hypothalamic S1P/S1PR1 axis controls energy homeostasis. Nat Commun. 2014;5:4859. [DOI] [PubMed] [Google Scholar]
- 16. Jun DJ, Lee JH, Choi BH, et al. Sphingosine-1-phosphate modulates both lipolysis and leptin production in differentiated rat white adipocytes. Endocrinology. 2006;147:5835–5844. [DOI] [PubMed] [Google Scholar]
- 17. Parham KA, Zebol JR, Tooley KL, et al. Sphingosine 1-phosphate is a ligand for peroxisome proliferator-activated receptor-γ that regulates neoangiogenesis. FASEB J. 2015;29:3638–3653. [DOI] [PMC free article] [PubMed] [Google Scholar]
- 18. Ishii I, Ye X, Friedman B, et al. Marked perinatal lethality and cellular signaling deficits in mice null for the two sphingosine 1-phosphate (S1P) receptors, S1P(2)/LP(B2)/EDG-5 and S1P(3)/LP(B3)/EDG-3. J Biol Chem. 2002;277:25152–25159. [DOI] [PubMed] [Google Scholar]
- 19. Sanchez T, Skoura A, Wu MT, Casserly B, Harrington EO, Hla T. Induction of vascular permeability by the sphingosine-1-phosphate receptor-2 (S1P2R) and its downstream effectors ROCK and PTEN. Arterioscler Thromb Vasc Biol. 2007;27:1312–1318. [DOI] [PubMed] [Google Scholar]
- 20. Terada N, Banno Y, Ohno N, et al. Compartmentation of the mouse cerebellar cortex by sphingosine kinase. J Comp Neurol. 2004;469:119–127. [DOI] [PubMed] [Google Scholar]
- 21. Balthasar S, Samulin J, Ahlgren H, et al. Sphingosine 1-phosphate receptor expression profile and regulation of migration in human thyroid cancer cells. Biochem J. 2006;398:547–556. [DOI] [PMC free article] [PubMed] [Google Scholar]
- 22. Cencetti F, Bernacchioni C, Tonelli F, Roberts E, Donati C, Bruni P. TGFβ1 evokes myoblast apoptotic response via a novel signaling pathway involving S1P4 transactivation upstream of Rho-kinase-2 activation. FASEB J. 2013;27:4532–4546. [DOI] [PubMed] [Google Scholar]
- 23. Akahoshi N, Ishizaki Y, Yasuda H, et al. Frequent spontaneous seizures followed by spatial working memory/anxiety deficits in mice lacking sphingosine 1-phosphate receptor 2. Epilepsy Behav. 2011;22:659–665. [DOI] [PubMed] [Google Scholar]
- 24. Wang J, Badeanlou L, Bielawski J, Ciaraldi TP, Samad F. Sphingosine kinase 1 regulates adipose proinflammatory responses and insulin resistance. Am J Physiol Endocrinol Metab. 2014;306:E756–E768. [DOI] [PMC free article] [PubMed] [Google Scholar]
- 25. Osinde M, Mullershausen F, Dev KK. Phosphorylated FTY720 stimulates ERK phosphorylation in astrocytes via S1P receptors. Neuropharmacology. 2007;52:1210–1218. [DOI] [PubMed] [Google Scholar]
- 26. Okamoto H, Takuwa N, Yokomizo T, et al. Inhibitory regulation of Rac activation, membrane ruffling, and cell migration by the G protein-coupled sphingosine-1-phosphate receptor EDG5 but not EDG1 or EDG3. Mol Cell Biol. 2000;20:9247–9261. [DOI] [PMC free article] [PubMed] [Google Scholar]
- 27. Lane MD, Tang QQ, Jiang MS. Role of the CCAAT enhancer binding proteins (C/EBPs) in adipocyte differentiation. Biochem Biophys Res Commun. 1999;266:677–683. [DOI] [PubMed] [Google Scholar]
- 28. Okada H, Ikeda T, Kajita K, et al. Effect of nematode Trichinella infection on glucose tolerance and status of macrophage in obese mice. Endocr J. 2013;60:1241–1249. [DOI] [PubMed] [Google Scholar]
- 29. Liu Y, Wada R, Yamashita T, et al. Edg-1, the G protein-coupled receptor for sphingosine-1-phosphate, is essential for vascular maturation. J Clin Invest. 2000;106:951–961. [DOI] [PMC free article] [PubMed] [Google Scholar]
- 30. Guilherme A, Virbasius JV, Puri V, Czech MP. Adipocyte dysfunctions linking obesity to insulin resistance and type 2 diabetes. Nat Rev Mol Cell Biol. 2008;9:367–377. [DOI] [PMC free article] [PubMed] [Google Scholar]
- 31. Yamaguchi H, Kitayama J, Takuwa N, et al. Sphingosine-1-phosphate receptor subtype-specific positive and negative regulation of Rac and haematogenous metastasis of melanoma cells. Biochem J. 2003;374:715–722. [DOI] [PMC free article] [PubMed] [Google Scholar]
- 32. Ishii I, Friedman B, Ye X, et al. Selective loss of sphingosine 1-phosphate signaling with no obvious phenotypic abnormality in mice lacking its G protein-coupled receptor, LP(B3)/EDG-3. J Biol Chem. 2001;276:33697–33704. [DOI] [PubMed] [Google Scholar]
- 33. Masoodi M, Kuda O, Rossmeisl M, Flachs P, Kopecky J. Lipid signaling in adipose tissue: connecting inflammation, metabolism. Biochim Biophys Acta. 2015;1851:503–518. [DOI] [PubMed] [Google Scholar]
- 34. Yamauchi T, Waki H, Kamon J, et al. Inhibition of RXR and PPARγ ameliorates diet-induced obesity and type 2 diabetes. J Clin Invest. 2001;108:1001–1013. [DOI] [PMC free article] [PubMed] [Google Scholar]
- 35. Hashimoto Y, Matsuzaki E, Higashi K, et al. Sphingosine-1-phosphate inhibits differentiation of C3H10T1/2 cells into adipocyte. Mol Cell Biochem. 2015;401:39–47. [DOI] [PubMed] [Google Scholar]
- 36. Fayyaz S, Henkel J, Japtok L, et al. Involvement of sphingosine 1-phosphate in palmitate-induced insulin resistance of hepatocytes via the S1P2 receptor subtype. Diabetologia. 2014;57:373–382. [DOI] [PubMed] [Google Scholar]
- 37. Japtok L, Schmitz EI, Fayyaz S, Krämer S, Hsu LJ, Kleuser B. Sphingosine 1-phosphate counteracts insulin signaling in pancreatic β-cells via the sphingosine 1-phosphate receptor subtype 2. FASEB J. 2015;29:3357–3369. [DOI] [PubMed] [Google Scholar]
- 38. Imasawa T, Koike K, Ishii I, Chun J, Yatomi Y. Blockade of sphingosine 1-phosphate receptor 2 signaling attenuates streptozotocin-induced apoptosis of pancreatic β-cells. Biochem Biophys Res Commun. 2010;392:207–211. [DOI] [PMC free article] [PubMed] [Google Scholar]


