Abstract
In near infrared fluorescence-guided surgical oncology, it is challenging to distinguish healthy from cancerous tissue. One promising research avenue consists in the analysis of the exogenous fluorophores’ lifetime, which are however in the (sub-)nanosecond range. We have integrated a single-photon pixel array, based on standard CMOS SPADs (single-photon avalanche diodes), in a compact, time-gated measurement system, named FluoCam. In vivo measurements were carried out with indocyanine green (ICG)-modified derivatives targeting the αvβ3 integrin, initially on a genetically engineered mouse model of melanoma injected with ICG conjugated with tetrameric cyclic pentapeptide (ICG−E[c(RGD f K)4]), then on mice carrying tumour xenografts of U87-MG (a human primary glioblastoma cell line) injected with monomeric ICG−c(RGD f K). Measurements on tumor, muscle and tail locations allowed us to demonstrate the feasibility of in vivo lifetime measurements with the FluoCam, to determine the characteristic lifetimes (around 500 ps) and subtle lifetime differences between bound and unbound ICG-modified fluorophores (10% level), as well as to estimate the available photon fluxes under realistic conditions.
OCIS codes: (030.5260) Photon counting, (170.2520) Fluorescence microscopy, (170.3650) Lifetime-based sensing, (170.3880) Medical and biological imaging, (230.5160) Photodetectors
1. Introduction
Over the last 25 years, the treatment of cancer has made great progress. Using non-invasive imaging technologies such as CT, MRI and PET, cancer can be detected at an early stage and can be removed either by open surgery or by employing minimally-invasive techniques such as endoscopy or laparoscopy. The intra-operative clinical discrimination between tumor and normal tissue is however mostly based on visual inspection and palpation. It is therefore far from straightforward for the surgeon to ensure that during surgical operations the tumor is removed completely with a sufficient tumor-free margin.
A promising development in this area is the use of exogenous near infrared (NIR) fluorescent probes [1, 2]. Operating in the 700–900 nm wavelength window has the substantial advantage of enabling deeper penetration in tissue (up to about 5–10 mm [3]) as well as reducing the background due to the autofluorescence of (naturally occurring) endogenous fluorophores. The corresponding intensity-based imaging techniques, some of which have already become commercially available, are mostly based on standard CMOS or CCD cameras with high sensitivity in the NIR and appropriate illumination engines [4–8].
There is nevertheless the need to overcome several limitations of intra-operative clinical, wide-field intensity-based fluorescence imaging systems for surgical oncology. One promising research avenue consists in the analysis of the fluorophore lifetime, which is typically in the (sub)nanosecond range, whether in an imaging-based modality akin to Fluorescence Lifetime Imaging (FLIM) as used in microscopy for example [9], or in a simpler (raster scanned) point detection set-up. Fluorescence lifetime analysis does potentially offer a better differentiation between fluorophores bound to cancer cells and those floating freely through the body or aggregated in cysts. In addition, it allows minimizing the effect of photon scattering in thick layers of sample, is insensitive, within reasonable limits [9], to fluorophore concentration variations, and offers better discrimination from background signals such as from endogenous fluorophores. The main disadvantages from the hardware perspective lie in the need for compact, high sensitivity real-time capable sensors and algorithms, with the corresponding illumination engines.
While it is true that very few fluorescent markers are approved for routine clinical use - notably IndoCyanine Green (ICG) in the NIR [10,11] - several are at present undergoing clinical evaluation. ICG per se is not cancer specific but can be chemically conjugated, e.g. with an Arg-Gly-Asp (RGD) peptide sequence so as to target cancer cells with much higher efficiency [12, 13].
Fluorescence lifetime analysis systems have been created for in vivo preclinical applications [14]. Time domain systems employ a combination of raster scanned fast PMT coupled with single point Time Correlated Single Photon Counting (TCSPC) systems [15–17], time-gated intensified CCDs [18,19], or high-speed digitizers for direct sampling of the fluorescence temporal decay [20]. Frequency domain systems have been reported as well [21, 22], usually employing slower frequency modulation techniques [23].
We report here on the use of a novel class of sensors - digital single-photon avalanche diode (SPAD) arrays implemented in standard CMOS technologies - towards in vivo fluorescence lifetime analysis-based oncology applications in the NIR, relying on exogenous fluorophores. These all solid state sensor arrays feature excellent single-photon timing resolution (in the order of 100 ps for each pixel, potentially in parallel over all pixels), low power, compactness, low voltage operation, and are amenable to mass production and therefore low cost. These features are usually traded off against overall sensitivity, due to the need for more complex in-pixel electronics and therefore somewhat reduced fill-factor.
An existing SPAD array was enhanced with a gating scheme, building the core of a compact measurement system, named FluoCam [24, 25], capable of providing both intensity and lifetime data by scanning half the integral of the lifetime response in time steps as fine as 12.3 ps, and accurately reconstructing it (Section 2). The step size can be adjusted to allow faster imaging, with similar lifetime precision. The sensor was combined with a picosecond diode laser, offering the possibility of studying sub-nanosecond fluorescence mechanisms as well as subtle lifetime differences between bound and unbound fluorophores. Finally, while the system is indeed capable of providing lifetime images, it was initially employed in a point detection set-up, using data from all pixels for lifetime extraction, to maximise the photon yield.
After having tested the system against ICG solutions with known lifetimes (Section 3), we carried out a series of in vitro tests, characterizing cultured melanoma cells labelled with tumour-specific fluorescent probes, i.e. ICG conjugated with cyclic pentapeptide (ICG − c(RGD f K)) (Section 4). We then moved to in vivo measurements (Section 5), studying a genetically engineered mouse model of melanoma injected with ICG − E[c(RGD f K)4], as well as mice carrying tumour xenografts of U87-MG - a human primary glioblastoma cell line - injected with ICG − c(RGD f K). This allowed us to demonstrate the feasibility of lifetime measurements with the FluoCam and determine the characteristic lifetimes and available photon fluxes under realistic conditions.
2. Description of the measurement system
The complete FluoCam system is composed of the parts shown in Fig. 1. The optical set-up permits to focus the laser light as a mm-sized point onto the sample, in epi-illumination mode, and to image the fluorescence emission at 835 nm. The illumination source is featured on the top left; it is composed of a PiLas picosecond diode laser (100 MHz EIG1000AF pulse generator and PIL080F laser head, Advanced Laser Diode Systems A.L.S. GmbH, Berlin, Germany), generating 70 ps wide pulses (FWHM) at λ = 790 nm, with an average power of 1.7 mW [I]. Two wavelength filters (775±25 nm [WF1] and 845±25 nm [WF2]) and a dichroic mirror (810 nm [D]) specific for ICG fluorescence (filter set No 41030, Chroma Technology Corp., Bellows Falls, USA) allow suppressing background and source illumination. The fluorescence light passing through the dichroic mirror is then focussed on the camera and integrated in two counters.
Fig. 1:
Schematic overview of the FluoCam fluorescence imaging system composed of the SPSD single-photon camera (on the right), and optical path (on the left), with lenses [L1/L2], wavelength filters [WF1/WF2] and ps-based laser illumination source [I]. The laser illumination is reflected by the dichroic mirror [D] onto the sample, whereas the fluorescence light passes through the dichroic due to the wavelength shift. The fluorescence light is integrated in the camera chip in counters C0/C2, whose data is transmitted to a host PC through a USB interface. The delay is incremented in time steps as fine as 12.3 ps to cover the fluorescence response.
The counter values are transmitted to the host PC through a USB connection. The delay of the delay lines is set by the FPGA and incremented in steps of 12.3 ps (on average).
2.1. SPSD camera
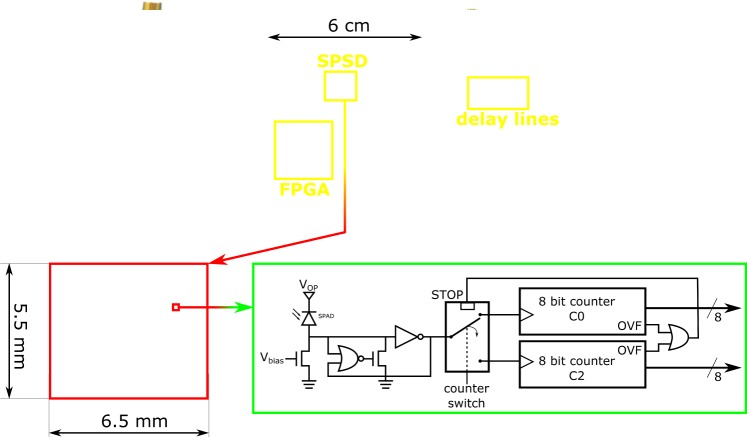
The FluoCam is based on the single photon synchronous detection (SPSD) imager detailed in [26]. It comprises 60×48 pixels implemented in 0.35 µm CMOS technology. Each pixel is composed of a SPAD, two 8 bit counters (C0 and C2), and a high-frequency switch, as shown in Fig. 2.
Fig. 2:
Detailed overview of the FluoCam camera system. Top: SPSD-based camera comprising (from left to right) the SPSD chip with the FPGA control board, a delay lines board, and a power management board. Bottom: chip micrograph and pixel schematic [24, 26].
The SPSD imager was originally developed for indirect time-of-flight 3D imaging, using low frequency modulation. In the new fluorescence camera (FluoCam), the system was modified so as to use a precise time-based gating technique which allows the complete fine reconstruction of a fluorescence signal.
An overview of the SPSD-based FluoCam specifications is provided in Table 1. The system is air cooled (from an initial temperature of 40°C down to approximately 25°C) so as to decrease the SPAD intrinsic noise, or DCR (dark count rate), by a factor of 3 to about 400 cps, and increase the resolution of the delay lines (from 12.6 to 12.3 ps) [27, pp. 71–73].
Table 1:
Overview of FluoCam characteristics at system, chip and pixel level.
| System level | Specification | |
|---|---|---|
|
|
|
|
| System | System & Laser CLK [MHz] | 100 |
| Gating duration [ns] | 5 | |
| Gating step [ps] | ≥ 12.3 | |
| Matrix readout time [µs] | 10.8 | |
| Frame acquisition time [s] | ≤ 1 | |
|
|
|
|
| Chip | Size [mm2] | 6.5×5.5 |
| Pixel array | 60×48 | |
| CMOS process [µm] | 0.35 | |
|
|
|
|
| Pixel | Pixel pitch [µm] | 85 |
| Fill factor [%] | 0.8 | |
| Photodetection Probability* @ 835 nm [%] | 2 | |
| Dead time [ns] | 40 | |
| Dark count rate @ 25°C [cps] | 400 | |
Photodetection Probability = Quantum efficiency × probability to trigger an avalanche.
The complete photodetection system is shown in more detail in Fig. 2, from the assembled camera down to pixel level. It is composed of a camera driven by an FPGA and several discrete electronic components in three compact PCB modules of roughly 6×6 cm, resulting in a total system size smaller than 7×7×6 cm3. One PCB features the SPSD camera itself [26] and the FPGA (Altera Cyclone II EP2C35U484C8N), a second the delay lines (2× MC10EP195, cascaded), and a third the power regulators (AXH003A0X). A cooling system is added on the exterior of the camera.
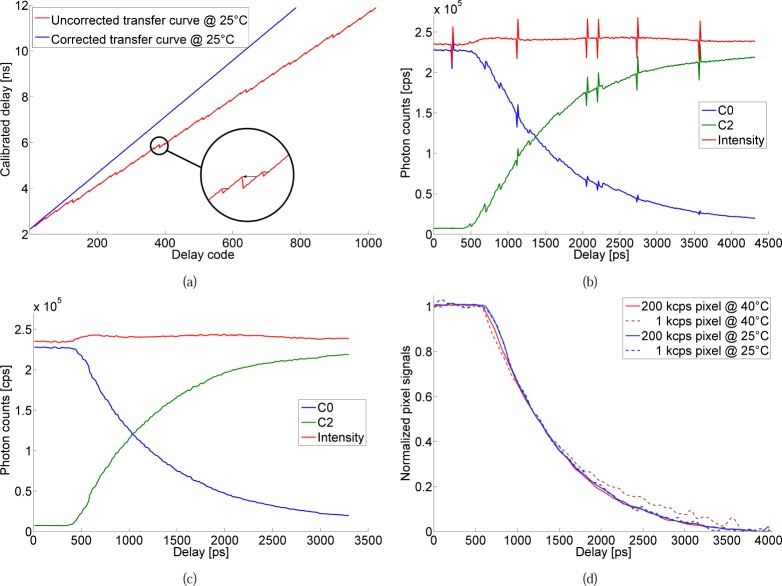
High timing resolution is possible by means of a gating scheme controlled by delay lines with a resolution of approximately 12.3 ps after correction for non-linearities (see Fig. 5(a)). This allows parallel multi-channel analysis with a typical single-photon timing resolution in the order of 100 ps.
Fig. 5:
Signal processing steps: (a) correction of the non-linearities; the calibrated delay transfer curve (as specified by the manufacturer) is corrected by removing redundant sequences in the delays. After fitting the corrected transfer curve, a resolution of 12.3 ps is reached. (b) Raw counter signals C0 and C2 and the corresponding total intensity, featuring non-linearities and readout spikes. (c) Counter signals corrected for non-linearities with the procedure from (a) and applying a moving average filter. (d) Final intensity normalized C0 signals for both cooled / uncooled camera systems, the noise being significantly higher for the uncooled system.
2.2. Lifetime measurement principle
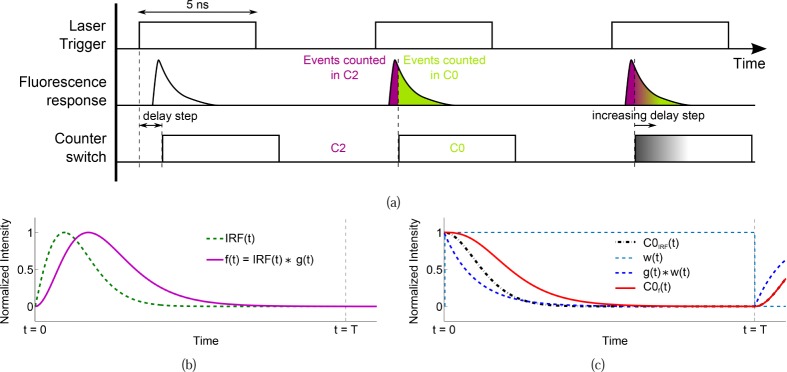
The time-gated fluorescence lifetime reconstruction principle is illustrated in Fig. 3(a). A picosecond diode laser is triggered at 100 MHz to deliver light pulses to the sample. The 100 MHz laser trigger signal is used as reference clock for the system and, after adding a delay, as a counter switch.
Fig. 3:
(a) Time-gated fluorescence lifetime reconstruction principle as applied to the FluoCam measurements. The laser trigger is used both as system clock and as trigger of the laser pulse. The laser pulse is pointed at the sample which generates an exponential fluorescence response. This fluorescence response is finally measured by the SPAD camera. Depending on the delay step (N×12.3 ps) between laser trigger and counter switch, the events are stored in either the C0 or the C2 counter. (b) IRF and the fluorescence exponential convolved with the IRF, i.e. the signal detected on the camera. (c) The integrated responses as measured by the camera in the C0 counter.
The fluorescence emission density g(t) is approximated as a single-exponential function [28, 29]; this is also justified by our final interest in lifetime contrast in a clinical context, rather than measurement of absolute values. The normalized density function is . The white background contributed by dark counts and background noise can be easily suppressed. The fluorescence measured by the SPAD camera can therefore be represented by a convolution with the system’s Instrument Response Function IRF(t):
| (1) |
This fluorescence signal f (t) is sensed by the SPAD-based camera as in Fig. 3(b), in which events have been generated over a random exponential distribution (fluorescence response). The counter switch, delayed in steps of roughly 12.3 ps with respect to the laser trigger, switches alternatively between the counters C0 and C2 (high: C0, low: C2).
The normalized integrated counter responses C0 and C2 (as a function of the delay step t) are therefore:
| (2a) |
| (2b) |
| (2c) |
| (2d) |
where the gate width T = 5 ns and w(t) is the window w(t) = 1 for 0 ≤ t ≤ T and w(t) = 0 otherwise. The ideal integrated counter responses C0(t) are depicted in Fig. 3(c). For simplicity, Eq. (1) and (2) as well as Fig. 3 do not include noise. A more detailed error analysis, taking into account noise sources such as Poisson, DCR or background noise, is outside the scope of this paper; it can be performed by applying procedures similar to those published in [30–32].
One frame, i.e. one image at a fixed delay step, was mostly acquired in 1 s, after which the delay step was incremented and a new 1 s acquisition started. Scanning the signal with of up to 500 steps enables us to observe the fluorescence over 6.25 ns, which is sufficient to study fluorescent probes with time constants of the order of 1 ns and below, like for ICG. The acquisition time was initially maintained high on purpose, so as to perform analysis with sufficient photon statistics. Therefore the total time required to measure one lifetime image is up to about 10 minutes, during which the counts measured in C2 will increase (C0 will decrease) over the acquired frames with increasing delay step. The result of such an acquisition is shown in Fig. 5(b).
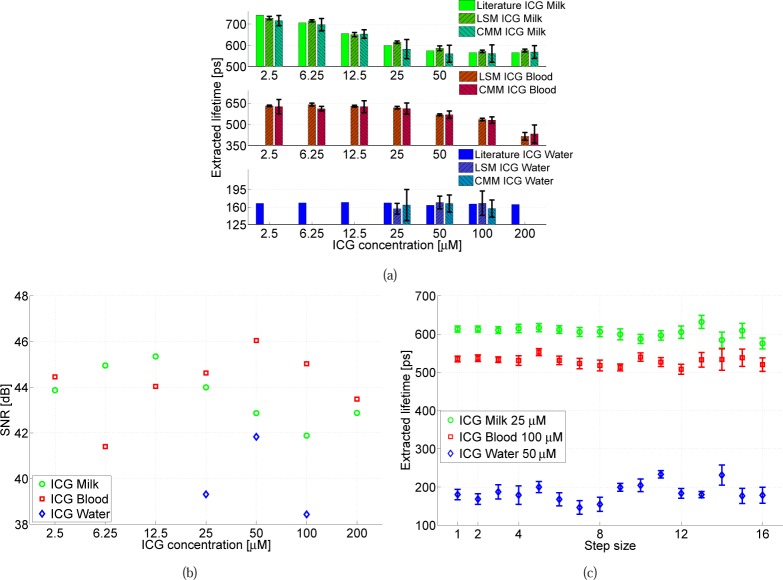
The total acquisition time can however be significantly reduced by either shortening the 1 s frame acquisition time or by increasing the delay step size. Data gathered with a delay step up to 8×, shows indeed similar lifetime extraction performance compared to the minimum delay step, as will be later revealed in Fig. 8(c).
Fig. 8:
(a) Extracted lifetime obtained with the algorithm proposed in Fig. 4 and a CMM algorithm, compared with [29], and (b) spot SNR vs. ICG molar concentration in various media (water, milk and blood). (c) Extracted lifetime and error obtained for different delay lines step sizes (N×12.3 ps) for three samples. Results from literature have been interpolated to match the concentrations used in our measurements.
2.3. Signal processing and lifetime calculation
We investigated two complementary fluorescence lifetime processing approaches, namely iterative Least Squares based fitting Methods (LSM) [33, 34] and Centre-of-Mass based approximation Methods (CMM) [32,35]. While it is true that CMM is inherently simpler and amenable to real-time implementation in future high-sensitivity imagers, fitting methods proved to generate more accurate results that are less affected by the inherent noise of the SPAD-based system, the average LSM standard deviation being over 50% smaller than that achievable with CMM over the same set of measurement points. We will therefore focus on LSM results (except for Fig. 8(a)) and the corresponding processing steps.
All measurements are achieved following the procedure detailed in Fig. 4, which is carried out offline after the measurement on the 60×48 SPAD pixels, allowing the generation of two dimensional lifetime data.
Fig. 4:
Signal processing chain (LSM fitting approach). Online measurements are carried out in parallel over the whole imager, the offline processing is done sequentially.
The first step in the procedure consists in the correction of the delay lines non-linearities produced by redundant sequences in the delays. The delay transfer curve, as calibrated by the manufacturer, is shown in Fig. 5(a). The correction procedure removes the points that are below the delay that was already reached. A linear fit on the corrected data indicates a timing resolution after correction of approximately 12.3 ps.
This procedure is applied on the raw signals as measured by the camera; Fig. 5(b) shows the measured C0 and C2 counters as well as the total intensity C0 +C2. The correction removes those signal parts that are also redundant. Furthermore, a moving average filter of size 3 is applied on the corrected results to smooth the data as shown in Fig. 5(c).
The last step is to normalize the signals with respect to the total intensity, i.e. , with C0m the normalized C0 signal. This procedure corrects the C0 signal for any change in the total intensity over time, compensating for example for photobleaching. A set of samples of C0m signals are shown in Fig. 5(d) for both cooled (25°C) and uncooled (40°C) data with different pixel intensity. On the brightest pixel (250 kcps), the signals are almost identical. However on the pixels with 1 kcps intensity, the signal from the temperature stabilized camera is significantly less noisy.
The actual lifetime can then be extracted in two steps from C0m as detailed in Fig. 6. The standard LSM approach relies on minimizing the least square error ε given by:
| (3) |
with C0t being the theoretical C0 signal defined in Eq. (2c) and M the total number of time step frames acquired in the measurement.
Fig. 6:
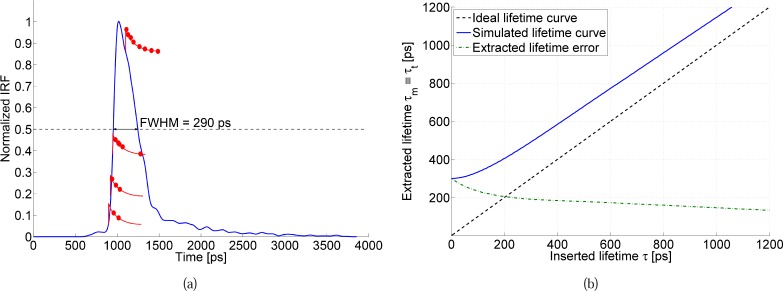
(a) IRF compensation simulation principle. Random events are generated with an exponential distribution (with lifetime τ) over the IRF, which determines the amount of events to be generated at each time step (10×1 million per inserted lifetime). (b) For τ ranging from 0 to 1.2 ns, the procedure described in (a) is applied, followed by a standard exponential fit (resulting in an extracted lifetime τt), leading to a lifetime correction look-up table.
However, it is overly complicated and time consuming to calculate the convolution in each iteration. Instead, we minimize first:
| (4) |
where Δ is the time step (12.3 ps minimum) and τm is a time constant, calculated from the measured data, but affected by an offset introduced by the IRF. τm can be obtained from a standard exponential fit on the normalized C0 curves.
In order to calculate the aforementioned offset, and therefore be able to retrieve the original lifetime τ in a second step, we first need to carry out the same procedure on C0t, minimizing
| (5) |
over a range of lifetime values and creating a look-up table of the extracted lifetime τt versus the original τ of the exponential used to create C0t. The corresponding Monte Carlo simulation procedure is schematically shown in Fig. 6(a). C0t is created by randomly distributing events over exponential curves (with a given time constant τ) superimposed to the measured IRF. The number of generated events depends on the normalized IRF area, i.e. most events will be generated when the IRF is maximum. This signal is then integrated, forming the C0 and C2 counter signals. This simulation takes into account the actual IRF, DCR noise and jitter of the FluoCam system.
The resulting table of τt versus the original τ is shown in Fig. 6(b) over lifetimes in the range 0 to 1.2 ns. The influence of the IRF-introduced offset is significant, especially for lower lifetimes, ranging from more than 200 ps for extremely short lifetimes to roughly 130 ps for lifetimes over 1 ns. As the IRF introduces a non-linear offset at very short lifetimes, the IRF correction is based on this look-up table, rather than a fixed offset.
The final correction assumes τm ≡ τt and replaces the measured lifetime τm by the lifetime τ corresponding to τt. In the remainder of this work “extracted lifetime” will always refer to the lifetime after correction.
3. System calibration
The FluoCam’s lifetime extraction capability was characterised using ICG. This NIR fluorescence marker with sub-nanosecond lifetime properties was chosen because it is already approved for clinical use [10, 11]. The previously described set-up was used with a slightly de-focused optics, in order to increase the statistics over more pixels in the array. The samples targeted in this initial calibration phase were solutions of ICG diluted in water, milk (3.5% fat) and blood (which is biologically more relevant). The concentrations of ICG in the solutions ranged from 2 µM to 200 µM, under conditions similar to those employed in [29] to allow a comparison of the results.
The most stable lifetime over different concentrations is provided by ICG in water, which exhibits quite a short lifetime (ranging from 150 ps in [36], 166 ps in [29] and 170 ps in [37], to 190 ps in [38] and 200 ps in [39]). On average a result around 170 ps for every molar concentration is expected.
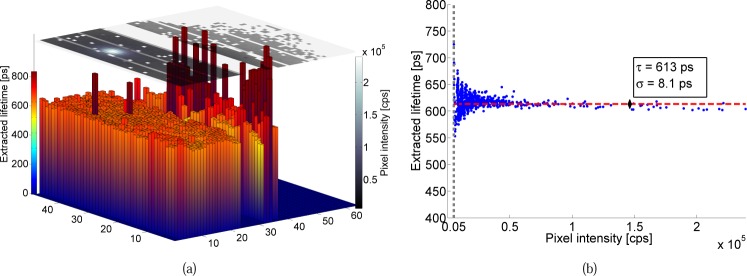
An example of the images provided by the FluoCam is shown in Fig. 7(a), with the intensity profile, peaking over the laser illumination spot, drawn on top of a mostly uniform lifetime image. Vertical stripes every 8 rows are due to a system readout artefact. Furthermore, some rows (and pixels) were disabled as they were saturating or showing excessive noise.
Fig. 7:
Extracted lifetime and intensity for ICG diluted in milk (concentration: 25 µM). (a) Extracted lifetime (3D bars) showing the uniform lifetime extraction ability with respect to the measured pixel intensity (top 2D plane). (b) Scatter plot of the extracted lifetime versus pixel intensity. The lifetime oscillations with intensity are likely due to a sub-optimal optical set-up, which slightly distorted the fluorescence signal. Their effect on the average lifetime is minor.
In this case, the total photon flux sensed in the spot area, averaged over the whole acquisition time (⟨hΦtot⟩), is of about 3 · 107 cps, i.e. photons per second. The spot area is defined as all pixels Ntot above the intensity threshold set during analysis. In this example there are about 900 pixels in the spot.
The signal-to-noise ratio (SNR) of the sample is defined, for photon counting imagers, as:
| (6) |
The SNR of the ICG in milk sample is for example 45 dB. Switching to ICG in vivo, the SNR drops to less than 39 dB. Equation (6) approximates the theoretical best SNR achievable in lifetime estimations [31]. A detailed derivation of the precision equation of the proposed lifetime estimation methods can be obtained following the procedures published elsewhere [31, 32].
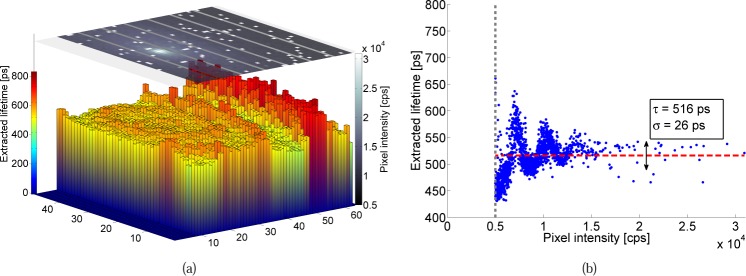
The sample’s overall lifetime is determined from the lifetimes extracted in each individual pixel (Fig. 7(a)) by applying an intensity-weighted Gaussian fit to the corresponding distribution (Fig. 7(b)). The deviation from the resulting average lifetime can be seen to be determined by the pixel SNR, whereby pixels with high intensity show less spread compared to those with low intensity and thus low SNR.
Although the pixel SNR on the edges of the spot decreases, the extracted lifetime is stable down to a signal intensity of roughly 4 kcps. Therefore the intensity threshold was set at 5 kcps, ignoring pixels with a lower intensity, as their SNR is by experience too low for proper data analysis. In this example, this results in an average τ of 613 ps with a standard deviation σ of about 8 ps.
A second way to determine the SNR is directly from the sample’s lifetime [32] by applying
| (7) |
which yields 38 dB (and 26 dB for the in vivo sample), confirming a lifetime extraction algorithm induced SNR deterioration of several dB compared to the theoretical maximum SNR obtained with Eq. (6) [31]. We will be using Eq. (6) to calculate all following SNR values, indicating the maximum achievable SNR of the sample.
Figure 8(a) finally shows the extracted lifetime (as per Fig. 7) as a function of the ICG concentration, in the three different media under analysis. The results acquired with both LSM and CMM, ranging from 165 ps to 700 ps, are in very good agreement with those previously reported in the literature [29]. The decrease in lifetime for higher concentrations, in the case of milk and blood, is likely due to the quenching effect, and to a possible reabsorption of the fluorescence photons by the dye itself [29]. The extraction performance over other delay steps (N×12.3 ps), shown in Fig. 8(c), is obtained by ignoring the intermediate time steps from measurements obtained with the minimum 12.3 ps step size. The resulting performance features results similar to those obtained with a 1× delay step at least up to 8×. While the acquisition time could therefore be reduced accordingly (to about 1–2 minutes), we preferred to carry out all following acquisitions with the minimum time step, except where indicated otherwise.
4. In vitro measurements
In order to test the camera with biologically relevant samples, and as a mandatory step before in vivo data acquisition, measurements were carried out with living cells cultured in vitro. We studied a contrast agent specific for tumors, which targets the αvβ3 integrin. The αvβ3 integrin is an attractive marker for diagnostic imaging of tumor angiogenesis due to its high expression on activated and proliferating endothelial cells during tumor angiogenesis and metastasis, in contrast to resting endothelial cells and most normal organs. It is also expressed by many tumors, such as metastatic melanoma and glioblastoma. The αvβ3 integrin is the receptor for extracellular matrix proteins such as vitronectin, which binds to the integrin via an Arg-Gly-Asp (RGD) peptide sequence [12, 40–42]. In order to target this receptor, mono-, di- and tetrameric c(RGD f K) structures were conjugated to an ICG-modified derivative to yield, respectively, ICG-c(RGD f K), ICG−E[c(RGD f K)2], and ICG−E[c(RGD f K)4] [13].
A first experiment consisted in measuring the mono- and dimeric RGD molecules diluted in milk at a same concentration of 20 µM, to compare the compounds to standard ICG. Figure 9 shows the scatter plots of extracted lifetimes versus pixel intensity for the three solutions. The lifetime for standard ICG (607±5 ps) is about 60 ps lower than that measured with ICG-c(RGD f K) and ICG−E[c(RGD f K)2], which are comparable (671±6 ps and 669±10 ps, respectively).
Fig. 9:
Comparison of extracted lifetimes for untargeted vs. targeted ICG in milk (concentration: 20 µM). Fluorescent probes used: (a) ICG, (b) ICG−c(RGD f K), (c) ICG−E[c(RGD f K)2]. The targeted ICG shows a lifetime about 60 ps higher than untargeted ICG.
The flux of photons sensed in the whole spot area was of 4.61 · 107, 2.22 · 107 and 1.21 · 107 cps, for standard ICG, ICG-c(RGD f K) and ICG−E[c(RGD f K)2], respectively, corresponding to SNR values of 44 dB, 42 dB and 40 dB, respectively.
All three measurements were carried out under the same conditions; the quantum yield decrease when moving from standard ICG to mono- and dimeric c(RGD f K) structures is likely due to a packing effect, which leads to quenching of the fluorescence signal.
In vitro measurements were then carried out using ICG-c(RGD f K). Two cell lines were studied: SK-MEL-37 melanoma cells, expressing αvβ3 integrin on the cell surface, and HEK-293T embryonic kidney cells, negative for the marker (as assessed by flow cytometric analysis with a specific antibody). Aliquots of cells (106) were incubated for 10 minutes at 37°C in a 1% bovine serum albumin (BSA)/Hanks balanced salt solution containing ICG-c(RGD f K) at concentrations from 5 µM up to 200 µM. Labeled cells were washed to remove unincorporated dye and pelleted into wells of flat-bottom 96-well plates.
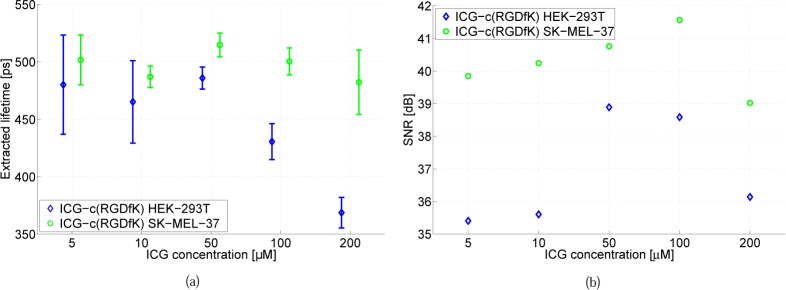
Figure 10(a) shows that the extracted time constants range from 370 ps to 510 ps. Cells that express the αvβ3 integrin feature an equal (within the measurement errors, which affected in particular the low concentration measurements) or higher lifetime, with the difference increasing towards higher concentration values. Figure 10(b) shows the corresponding spot SNR results for the two cell lines, whereby cells expressing the αvβ3 integrin emit more fluorescence photons (1.5–3×).
Fig. 10:
Measurements of in vitro cultured melanoma cells expressing αvβ3 integrin (SK-MEL-37 cell line) vs. melanoma cells not expressing αvβ3 integrin (HEK-293T embryonic kidney cells). (a) Extracted lifetime and (b) spot SNR versus ICG-c(RGD f K) concentration.
These preliminary in vitro measurements proved our capability of measuring lifetimes on biologically relevant samples, and provided an indication of the expected lifetimes in vivo (which actually turned out to be quite comparable) when employing targeted ICG. However, one should be careful with the interpretation of low-intensity measurements as the standard deviation gets larger with lower signals, and overall additional measurements are needed to derive firmer conclusions.
5. In vivo measurements
5.1. Preliminary measurements
As a first step towards more clinically relevant data, the FluoCam was used to characterize ICG−E[c(RGD f K)4], in vivo. Tetrameric c(RGD f K) is potentially appealing due to its higher affinity and also activity against integrins as compared to monomeric and dimeric c(RGD f K) [43]. It also shows higher levels of internalization/endocytosis by the cell. On the other hand, solubility can be an issue, the compound is more difficult to synthesize, and tetrameric c(RGD f K) can tend to aggregate, thereby quenching the fluorescence signal.
In order to faithfully model a human tumor we used a genetically engineered mouse model of melanoma [44], in which tumors were locally induced at the ears, by topically applying 4 hydroxy-tamoxifen. These tumors express high levels of αvβ3 integrin. The animals were used at the EPFL (Ecole Polytechnique Fédérale de Lausanne, Switzerland) in accordance with local animal ethical regulations and under an approved animal license protocol (Protocol 2564). Tumor bearing mice with 200 mm3 tumors were injected with ICG−E[c(RGD f K)4] in the tail vein under general anesthesia. A total of 17 µg of ICG−E[c(RGD f K)4], dissolved in 100 µL of phosphate buffer saline (PBS):dimethyl sulfoxide (DMSO) 2:1, was delivered.
The mouse was imaged with the FluoCam, on a station equipped with anesthesia and a heated bed. Fluorescence lifetimes were measured 0.5 hour, 24 hours and 96 hours after administration of the fluorescent probe. In addition, the mouse was imaged with a pre-clinical in vivo imaging system (Perkin-Elmer IVIS Spectrum), which can only measure the fluorescence intensity.
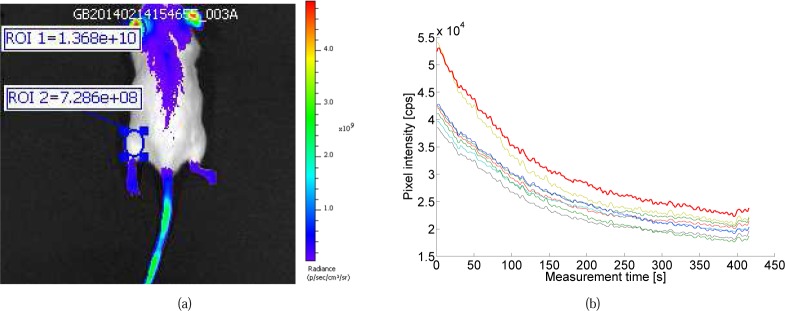
The intensity image obtained by the IVIS imaging system 24 hours after injection (Fig. 11(a)) shows a 20 times higher fluorescence intensity at the ears of the mouse (tumor spot), than for the background signal, demonstrating the excellent specificity of ICG−E[c(RGD f K)4] on the targeted tumor. The same pattern was observed with the FluoCam (Table 2) for the spot SNR on the mouse tumor. The SNR peaks roughly 24 hours after injection. The FluoCam data showed a clear fluorescence signal when the laser spot was aimed at the tumor, but it disappeared when any other region of the mouse was targeted.
Fig. 11:
(a) ICG−E[c(RGD f K)4] in vivo (melanoma mouse model) fluorescence intensity measured 24 hours after injection with IVIS Spectrum and with (b) FluoCam targeted on the tumor (mouse ear), showing pho-tobleaching in the brightest pixels during the 7 minutes acquisition time. No usable fluorescence signal was detected elsewhere with the FluoCam.
Table 2:
in vivo (melanoma mouse model) lifetime results for ICG−E[c(RGD f K)4], including with a simulated 4× delay step (results for two consecutive measurements M1/M2, whenever available).
| Delay step size 1× | Delay step size 4× | |||||
|---|---|---|---|---|---|---|
|
| ||||||
| Target | Time of measurement after injection | Extracted lifetime τ [ps] | Lifetime error σ [ps] | Extracted lifetime τ [ps] | Lifetime error σ [ps] | SNR [dB] |
| Solution | Before | 323 / 332 | 6 / 6 | 387 / 310 | 11 / 9 | 43 |
|
| ||||||
| 0.5 hour | 424 | 22 | 466 | 29 | 37 | |
| Tumor | 24 hours | 508 / 516 | 29 / 26 | 503 / 500 | 29 / 30 | 39 |
| 96 hours | 453 / 459 | 27 / 37 | 448 / 442 | 26 / 39 | 38 | |
The fluorescence lifetime was extracted for each pixel in the spot above the usual intensity threshold at 5 kcps. For the tumor measurement 24 hours after injection of the probe, this result is shown in Fig. 12. From the 1500 pixels above the threshold, the extracted lifetime was 516±26 ps. Despite mouse motion (breathing) and photobleaching (Fig. 11(b)), the extracted lifetimes were very stable and reproducible in multiple measurements.
Fig. 12:
In vivo (melanoma mouse model) extracted lifetime and intensity on the mouse tumor (ear) 24 hours after injection. (a) Extracted lifetime (3D bars) and measured pixel intensity (2D plane). (b) Scatter plot of the extracted lifetime versus pixel intensity.
The complete set of measurement results are presented in Table 2, which includes a comparison with the values which would have been obtained employing a 4× delay step. As reference, the solution’s lifetime was measured before injection, and is of the order of 330 ps. 0.5 hour after injection, the ICG starts to be bound to the tumor and the lifetime increases to 424 ps.
24 hours after injection, when the intensity peaks and the tumor-to-background ratio was maximal, the lifetime was around 512 ps. After 24 hours the signal degraded and both intensity and lifetime decreased; the fluorescent probe is washed out and becomes unbound. However, the lifetime signal is still detectable 96 hours after injection.
This data demonstrated the feasibility of performing reproducible in vivo measurements, including over long time spans. Also, a good cross-correlation was found with the IVIS intensity images. However, there is a need to differentiate bound from unbound c(RGD f K) in vivo, at the same moment in time, to achieve a clinically relevant system. Therefore we conducted a second in vivo, larger series of experiments using a higher dose of the monomeric fluorescent probe version (easier to synthesize) in order to enable measurements both in tumor and adjacent, normal (control) tissue.
5.2. Additional measurements
Animal experiments were performed in 6–8 week-old a-tymic female mice (CD1-Fox1nu, Charles River Laboratories, l’Arbresle, France), weighing 25–35 g. The mice were provided with autoclaved low fluorescence pellet food, normal pellet food and sterilized water ad libitum. Experiments were approved by the Animal Welfare Committee of Leiden University Medical Center, The Netherlands.
Tumor inoculation and lifetime measurements were performed under isoflurane gas anesthesia (4% induction and 2% maintenance). Four subcutaneous tumors on the back were induced by injection of U87-MG cells (1.5 – 3.0 · 106 cells per site) - a human primary glioblastoma cell line, expressing high levels of αvβ3. When tumors were grown, 30 nmol (50 µg) of ICG-c(RGD f K), dissolved in PBS, was injected intravenously. This corresponds to approximatively 12 times as many tracer molecules as in the previously described experiments with tetrameric c(RGD f K) (3× weight increase and 1:4 molecular weight ratio). For the tail, a small additional ICG-c(RGD f K) bolus was injected subcutaneously to create a pocket of unbound probe.
Fluorescent lifetimes were measured at the tail, muscle, and tumor both 0.5–2.5 hours and 24 hours after injection. Measurements were taken with the default 1× delay step as well as with 4× delay steps to reduce the acquisition time.
The variance between groups was first assessed via one way analysis of variation; differences in means between two groups were assessed via the post-hoc Bonferroni test. p < 0.05 was considered statistically significant.
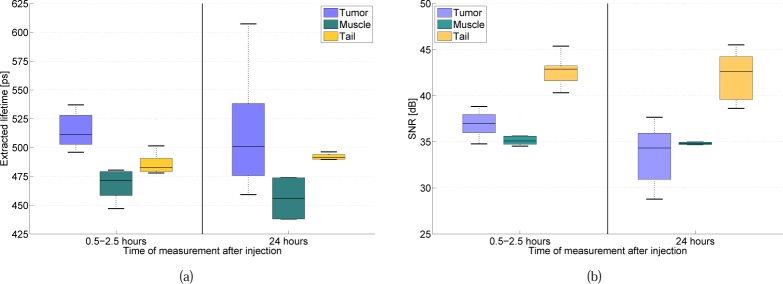
In total 42 measurements (30 with delay step 1× and 12 with 4× delay steps) were taken in two mice: 15 at the tail, 8 at muscle tissue, and 19 at tumor tissue. Only from one measurement no lifetime could be extracted due to too low SNR. Figure 13(a) shows the resulting extracted lifetimes. Lifetimes in both tail (n = 9; 480 ± 36 ps) and muscle (n = 6; 468 ± 16 ps) were significantly lower than in tumor (n = 11; 515 ± 15 ps) 0.5–2.5 hours after injection (p = 0.011 and p = 0.003, respectively), while tail and muscle lifetimes did not differ significantly. No significant differences were found between the tissue types 24 hours after injection, nor over time at a given location. Figure 13(b) shows the signal-to-noise ratio. Due to the bolus injection at the tail, the spot SNR was there almost 6 dB higher than at the tumor, whereas the lowest spot SNR was seen at the muscle, as much less αvβ3 is present there. Finally, the spot SNR at the tumor site decreases significantly (3 dB) 24 hours after injection, whereas it stays nearly constant at the other sites.
Fig. 13:
ICG-c(RGD f K) in vivo (glioblastoma mouse model) fluorescence lifetime and spot SNR measurements. The injected concentration of ICG-c(RGD f K) is 30 nmol (50 µg). (a) Extracted lifetimes for mouse tumor (bound), muscle (partially bound) and tail (unbound fluorophore), both 0.5–2.5 and 24 hours after injection. (b) Signal-to-Noise ratio both 0.5–2.5 and 24 hours after injection.
These preliminary measurements indicate that our system is able to capture the subtle lifetime differences between bound and unbound probe in vivo. As αvβ3 is highly expressed in tumor tissue and not present in the tail bolus, bound probe is mostly present in tumor, and unbound probe in tail. For muscle tissue, a combination of bound and unbound probe probably applies, as αvβ3 is present in blood vessels, but not as abundantly as in tumor tissue. We observe that the lifetime of the bound probe is significantly higher than that of the unbound probe. Although the number of measurements is limited, it is encouraging that unbound and bound probe can be differentiated, even more so as these differences are measurable shortly after injection.
6. Conclusion and outlook
We have shown that the proposed SPAD-based FluoCam, resulting from the integration of an existing single-photon SPSD imager with a precise gating scheme and innovative signal processing and lifetime calculation approaches, allows the complete fine reconstruction of a fluorescence signal and is capable of deriving sound fluorescence intensity and lifetime data for ICG-modified derivatives, in particular those conjugated with cyclic pentapeptide targeting the αvβ3 integrin. Its sensitivity, albeit at present low in absolute terms and therefore entailing long acquisition times, is sufficient to derive sub-nanosecond lifetimes in good agreement with literature, as well as to carry out measurements in vivo.
FluoCam’s signal processing capabilities, as well as its IRF and precise gating control, which are at a comparable level with other existing time-gated solid state FLIM sensors [45–47], did eventually enable true in vivo discrimination of the subtle lifetime differences between bound and unbound ICG-modified fluorophores (10% level in our case).
The FluoCam will therefore be used to perform further biological experiments, including extensive in vivo studies. In parallel we will be working on improving its performance, towards our goal of designing a next-generation real-time SPAD-based instrument to study how the lifetime information could improve fluorescence-guided surgical procedures in the operating theatre. This activity focuses on the one hand on the improvement of the fill-factor at the pixel level - to bring it on par with other existing solid-state FLIM sensors [45–47] - and on the photon detection probability increase in the near infrared [48], on the other hand on the implementation of more photon-efficient architectures such as TCSPC [49]. We believe that these results are within reach, in particular by migrating to more advanced CMOS technology nodes and/or 3D stacking approaches, thus paving the way to the clinical use of fluorescence lifetime data.
Acknowledgments
Work at EPFL was supported in part by CTI, the Swiss Federal Administration’s Commission for Technology and Innovation (Project 9801.1 PFLS-LS), by the Swiss National Foundation under Grant SNF 51NF40-144633, and by the NCCR MICS. We gratefully acknowledge E. Grigoriev (Forimtech S.A., Switzerland), D. Hanahan (EPFL, Lausanne, Switzerland) and O. Michielin (CHUV, Lausanne, Switzerland) for their support and fruitful discussions.
References and links
- 1.Mieog J. S. D., Troyan S. L., Hutteman M., Donohoe K. J., Vorst J. R., Stockdale A., Liefers G.-J., Choi H. S., Gibbs-Strauss S. L., Putter H., Gioux S., Kuppen P. J. K., Ashitate Y., Löwik C. W. G. M., Smit V. T. H. B. M., Oketokoun R., Ngo L. H., Velde C. J. H., Frangioni J. V., Vahrmeijer A. L., “Toward Optimization of Imaging System and Lymphatic Tracer for Near-Infrared Fluorescent Sentinel Lymph Node Mapping in Breast Cancer,” Annals of Surgical Oncology 18(9), 2483–2491 (2011). 10.1245/s10434-011-1566-x [DOI] [PMC free article] [PubMed] [Google Scholar]
- 2.Vahrmeijer A. L., Hutteman M., van der Vorst J. R., van de Velde C. J., Frangioni J. V., “Image-guided cancer surgery using near-infrared fluorescence,” Nature Reviews Clinical Oncology 10(9), 507–518 (2013). 10.1038/nrclinonc.2013.123 [DOI] [PMC free article] [PubMed] [Google Scholar]
- 3.Stolik S., Delgado J., Perez A., Anasagasti L., “Measurement of the penetration depths of red and near infrared light in human ex vivo tissues,” J. Photochem. Photobiol., B 57(2), 90–93 (2000). 10.1016/S1011-1344(00)00082-8 [DOI] [PubMed] [Google Scholar]
- 4.Troyan S. L., Kianzad V., Gibbs-Strauss S. L., Gioux S., Matsui A., Oketokoun R., Ngo L., Khamene A., Azar F., Frangioni J. V., “The FLARE™ Intraoperative Near-Infrared Fluorescence Imaging System: A First-in-Human Clinical Trial in Breast Cancer Sentinel Lymph Node Mapping,” Annals of Surgical Oncology 16(10), 2943–2952 (2009). 10.1245/s10434-009-0594-2 [DOI] [PMC free article] [PubMed] [Google Scholar]
- 5.Miwa M., Shikayama T., “ICG fluorescence imaging and its medical applications,” Proc. SPIE 7160, 71600K (2008). 10.1117/12.817856 [DOI] [Google Scholar]
- 6.Gioux S., Choi H. S., Frangioni J. V., “Image-Guided Surgery Using Invisible Near-Infrared Light: Fundamentals of clinical translation,” Mol. Imaging 9(5), 237–255 (2010). [PMC free article] [PubMed] [Google Scholar]
- 7.Navarro F. P., Berger M., Goutayer M., Guillermet S., Josserand V., Rizo P., Vinet F., Texier I., “A novel indocyanine green nanoparticle probe for non invasive fluorescence imaging in vivo,” Proc. SPIE 7190, 71900L (2009). [Google Scholar]
- 8.Keereweer S., Kerrebijn J. D. F., Driel P. B. A. A., Xie B., Kaijzel E. L., Snoeks T. J. A., Que I., Hutteman M., Vorst J. R., Mieog J. S. D., Vahrmeijer A. L., Velde C. J. H., Baatenburg de Jong R. J., Löwik C. W. G. M., “Optical Image-guided Surgery - Where Do We Stand?” Mol. Imag. Biol. 13(2), 199–207 (2010). 10.1007/s11307-010-0373-2 [DOI] [PMC free article] [PubMed] [Google Scholar]
- 9.Becker W., “Fluorescence lifetime imaging - techniques and applications,” J. Microsc. 247, 119–136 (2012). 10.1111/j.1365-2818.2012.03618.x [DOI] [PubMed] [Google Scholar]
- 10.“Product Insert: Indocyanine Green (IC-Green™),” (2007). URL http://www.accessdata.fda.gov/drugsatfda_docs/label/2006/011525s017lbl.pdf.
- 11.Alander J. T., Kaartinen I., Laakso A., Pätilä T., Spillmann T., Tuchin V. V., Venermo M., Välisuo P., “A review of indocyanine green fluorescent imaging in surgery,” Int. J. Biomed. Imaging 2012, 7 (2012). 10.1155/2012/940585 [DOI] [PMC free article] [PubMed] [Google Scholar]
- 12.Cao J., Wan S., Tian J., Li S., Deng D., Qian Z., Gu Y., “Fast clearing RGD-based near-infrared fluorescent probes for in vivo tumor diagnosis,” Contrast Media & Mol. Imaging 7(4), 390–402 (2012). 10.1002/cmmi.1464 [DOI] [PubMed] [Google Scholar]
- 13.Danhier F., Breton A. L., Preat V., “RGD-based strategies to target αvβ3 integrin in cancer therapy and diagnosis,” Mol. Pharmaceutics 9(11), 2961–2973 (2012). 10.1021/mp3002733 [DOI] [PubMed] [Google Scholar]
- 14.Berezin M. Y., Achilefu S., “Fluorescence lifetime measurements and biological imaging,” Chem. Rev. 110(5), 2641–2684 (2010). 10.1021/cr900343z [DOI] [PMC free article] [PubMed] [Google Scholar]
- 15.Biffi S., Garrovo C., Macor P., Tripodo C., Zorzet S., Secco E., Tedesco F., Lorusso V., “In Vivo Biodistribution and Lifetime Analysis of Cy5.5-Conjugated Rituximab in Mice Bearing Lymphoid Tumor Xenograft Using Time-Domain Near-Infrared Optical Imaging,” Mol. Imaging 7(6), 272–282 (2008). [PubMed] [Google Scholar]
- 16.Bloch S., Lesage F., McIntosh L., Gandjbakhche A., Liang K., Achilefu S., “Whole-body fluorescence lifetime imaging of a tumor-targeted near-infrared molecular probe in mice,” J. Biomed. Opt. 10(5), 054003 (2005). 10.1117/1.2070148 [DOI] [PubMed] [Google Scholar]
- 17.Mincu N., Huang D. C., Piche M., Ma G., “Quantitative in vivo lifetime imaging using a time-domain platform with a supercontinuum tunable laser for extended spectral coverage,” Proc. SPIE 7910, 79101K (2011). 10.1117/12.875214 [DOI] [Google Scholar]
- 18.Sun Y., Hatami N., Yee M., Phipps J., Elson D. S., Gorin F., Schrot R. J., Marcu L., “Fluorescence lifetime imaging microscopy for brain tumor image-guided surgery,” J. Biomed. Opt. 15(5), 056022 (2010). 10.1117/1.3486612 [DOI] [PMC free article] [PubMed] [Google Scholar]
- 19.Sun Y., Phipps J., Elson D. S., Stoy H., Tinling S., Meier J., Poirier B., Chuang F. S., Farwell D. G., Marcu L., “Fluorescence lifetime imaging microscopy: in vivo application to diagnosis of oral carcinoma,” Opt. Lett. 34(13), 2081–2083 (2009). 10.1364/OL.34.002081 [DOI] [PMC free article] [PubMed] [Google Scholar]
- 20.Shrestha S., Applegate B. E., Park J., Xiao X., Pande P., Jo J. A., “High-speed multispectral fluorescence lifetime imaging implementation for in vivo applications,” Opt. Lett. 35(15), 2558–2560 (2010). 10.1364/OL.35.002558 [DOI] [PMC free article] [PubMed] [Google Scholar]
- 21.Gioux S., Lomnes S. J., Choi H. S., Frangioni J. V., “Low-frequency wide-field fluorescence lifetime imaging using a high-power near-infrared light-emitting diode light source,” J. Biomed. Opt. 15(2), 199–207 (2010). 10.1117/1.3368997 [DOI] [PMC free article] [PubMed] [Google Scholar]
- 22.Kumar A. T. N., Raymond S. B., Bacskai B. J., Boas D. A., “Comparison of frequency-domain and time-domain fluorescence lifetime tomography,” Opt. Lett. 33(5), 470–472 (2008). 10.1364/OL.33.000470 [DOI] [PMC free article] [PubMed] [Google Scholar]
- 23.Mizeret J., Stepinac T., Hansroul M., Studzinski A., van den Bergh H., Wagnières G., “Instrumentation for real-time fluorescence lifetime imaging in endoscopy,” Rev. Sci. Instrum. 70(12), 4689–4701 (1999). 10.1063/1.1150132 [DOI] [Google Scholar]
- 24.Powolny F., Bruschini C., Dubikovskaya E., Grigoriev E., Michielin O., Muehlethaler K., Prior J., Rimoldi D., Sinisi R., Charbon E., “Compact imaging system with single-photon sensitivity and picosecond time resolution for fluorescence-guided surgery with lifetime imaging capability,” Proc. SPIE 8798, 879806 (2013). 10.1117/12.2032537 [DOI] [Google Scholar]
- 25.Powolny F., Homicsko K., Sinisi R., Bruschini C., Grigoriev E., Homulle H., Prior J. O., Hanahan D., Dubikovskaya E., Charbon E., “Time-resolved imaging system for fluorescence-guided surgery with lifetime imaging capability,” Proc. SPIE 9129, 912938 (2014). 10.1117/12.2052411 [DOI] [Google Scholar]
- 26.Niclass C., Favi C., Kluter T., Monnier F., Charbon E., “Single-photon synchronous detection,” IEEE J. Solid-State Circuits 44(7), 1977–1989 (2009). 10.1109/JSSC.2009.2021920 [DOI] [Google Scholar]
- 27.Homulle H. A. R., “Development of a Multichannel TCSPC System in a Spartan 6 FPGA,” Master’s thesis, TU Delft; (2014). URL http://repository.tudelft.nl/view/ir/uuid%3A86ecbaba-0711-40e8-8b10-1001b3772206/. [Google Scholar]
- 28.Lakowicz J. R., Principles of Fluorescence Spectroscopy (Kluwer Academic/Plenum, New York, USA, 1983). 10.1007/978-1-4615-7658-7 [DOI] [Google Scholar]
- 29.Gerega A., Zolek N., Soltysinski T., Milej D., Sawosz P., Toczylowska B., Liebert A., “Wavelength-resolved measurements of fluorescence lifetime of indocyanine green,” J. Biomed. Opt. 16(6), 067010 (2011). 10.1117/1.3593386 [DOI] [PubMed] [Google Scholar]
- 30.Hall P., Selinger B., “Better estimates of exponential decay parameters,” J. Phys. Chem. 85(20), 2941–2946 (1981). 10.1021/j150620a019 [DOI] [Google Scholar]
- 31.Li D.-U., Walker R., Richardson J., Rae B., Buts A., Renshaw D., Henderson R., “Hardware implementation and calibration of background noise for an integration-based fluorescence lifetime sensing algorithm,” J. Opt. Soc. Am. A 26(4), 804–814 (2009). 10.1364/JOSAA.26.000804 [DOI] [PubMed] [Google Scholar]
- 32.Li D.-U., Rae B., Andrews R., Arlt J., Henderson R., “Hardware implementation algorithm and error analysis of high-speed fluorescence lifetime sensing systems using center-of-mass method,” J. Biomed. Opt. 15(1), 017006 (2010). [DOI] [PubMed] [Google Scholar]
- 33.Enderlein J., Erdmann R., “Fast fitting of multi-exponential decay curves,” Opt. Commun. 134(1), 371–378 (1997). 10.1016/S0030-4018(96)00384-7 [DOI] [Google Scholar]
- 34.Halmer D., von Basum G., Hering P., Mürtz M., “Fast exponential fitting algorithm for real-time instrumental use,” Rev. Sci. Instrum. 75(6), 2187–2191 (2004). 10.1063/1.1711189 [DOI] [Google Scholar]
- 35.Moon S., Won Y., Kim D. Y., “Analog mean-delay method for high-speed fluorescence lifetime measurement,” Opt. Express 17(4), 2834–2849 (2009). 10.1364/OE.17.002834 [DOI] [PubMed] [Google Scholar]
- 36.Luo T., “Femtosecond Time-Resolved Studies on the Reaction Pathways for the Generation of Reactive Oxygen Species in Photodynamic Therapy by Indocyanine Green,” Master’s thesis, University of Waterloo, Canada: (2008). URL https://uwspace.uwaterloo.ca/handle/10012/3972. [Google Scholar]
- 37.Berezin M. Y., Lee H., Akers W., Guo K., Goiffon R. J., Almutairi A., Fréchet J. M., Achilefu S., “Engineering NIR dyes for fluorescent lifetime contrast,” in Engineering in Medicine and Biology Society, pp. 114–117 (2009). [DOI] [PubMed] [Google Scholar]
- 38.Becker W., Advanced Time-Correlated Single Photon Counting Techniques (Springer, Berlin, Germany, 2005). 10.1007/3-540-28882-1 [DOI] [Google Scholar]
- 39.Becker W., The bh TCSPC Handbook, 5th ed. (Becker & Hickl GmbH, Berlin, Germany, 2012). [Google Scholar]
- 40.Ye Y., Chen X., “Integrin Targeting for Tumor Optical Imaging,” Theranostics 1, 102–126 (2011). 10.7150/thno/v01p0102 [DOI] [PMC free article] [PubMed] [Google Scholar]
- 41.Wang W., Ke S., Wu Q., Charnsangavej C., Gurfinkel M., Gelovani J. G., Abbruzzese J. L., Sevick-Muraca E. M., Li C., “Near-infrared optical imaging of integrin αvβ3 in human tumor xenografts,” Mol. Imaging 3(4), 343–351 (2004). 10.1162/1535350042973481 [DOI] [PubMed] [Google Scholar]
- 42.Gurfinkel M., Ke S., Wang W., Li C., Sevick-Muraca E. M., “Quantifying molecular specificity of αvβ3 integrin-targeted optical contrast agents with dynamic optical imaging,” J. Biomed. Opt. 10(3), 034019 (2005). 10.1117/1.1924696 [DOI] [PubMed] [Google Scholar]
- 43.Wu Y., Cai W., Chen X., “Near-Infrared Fluorescence Imaging of Tumor Integrin αvβ3 Expression with Cy7-Labeled RGD Multimers,” Mol. Imag. Biol. 8(4), 226–236 (2006). 10.1007/s11307-006-0041-8 [DOI] [PMC free article] [PubMed] [Google Scholar]
- 44.Kwong L. N., Boland G. M., Frederick D. T., Helms T. L., Akid A. T., Miller J. P., Jiang S., Cooper Z. A., Song X., Seth S., Kamara J., Protopopov A., Mills G. B., Flaherty K. T., Wargo J. A., Chin L., “Co-clinical assessment identifies patterns of BRAF inhibitor resistance in melanoma,” The Journal of Clinical Investigation 125(4), 1459–1470 (2015). 10.1172/JCI78954 [DOI] [PMC free article] [PubMed] [Google Scholar]
- 45.Seo M.-W., Kagawa K., Yasutomi K., Kawata Y., Teranishi N., Li Z., Halin I., Kawahito S., “A 10 ps Time-Resolution CMOS Image Sensor With Two-Tap True-CDS Lock-In Pixels for Fluorescence Lifetime Imaging,” IEEE J. Solid-State Circuits 51(1), 141–154 (2016). 10.1109/JSSC.2015.2496788 [DOI] [Google Scholar]
- 46.Perenzoni M., Massari N., Perenzoni D., Gasparini L., Stoppa D., “160×120-pixel analog-counting single-photon imager with Sub-ns time-gating and self-referenced column-parallel A/D conversion for fluorescence lifetime imaging,” in Solid-State Circuits Conference (ISSCC), 2015 IEEE International, pp. 1–3 (2015). [Google Scholar]
- 47.Burri S., Maruyama Y., Michalet X., Regazzoni F., Bruschini C., Charbon E., “Architecture and applications of a high resolution gated SPAD image sensor,” Opt. Express 22(14), 589 (2014). 10.1364/OE.22.017573 [DOI] [PMC free article] [PubMed] [Google Scholar]
- 48.Mandai S., Fishburn M. W., Maruyama Y., Charbon E., “A wide spectral range single-photon avalanche diode fabricated in an advanced 180 nm CMOS technology,” Opt. Express 20(6), 5849–5857 (2012). 10.1364/OE.20.005849 [DOI] [PubMed] [Google Scholar]
- 49.Veerappan C., Richardson J., Walker R., Li D.-U., Fishburn M., Maruyama Y., Stoppa D., Borghetti F., Gersbach M., Henderson R., Charbon E., “A 160×128 single-photon image sensor with on-pixel 55ps 10b time-to-digital converter,” in Solid-State Circuits Conference (ISSCC), 2011 IEEE International, pp. 312–314 (2011). [Google Scholar]


