Abstract
Quantitative analysis of the cone photoreceptor mosaic in the living retina is potentially useful for early diagnosis and prognosis of many ocular diseases. Non-confocal split detector based adaptive optics scanning light ophthalmoscope (AOSLO) imaging reveals the cone photoreceptor inner segment mosaics often not visualized on confocal AOSLO imaging. Despite recent advances in automated cone segmentation algorithms for confocal AOSLO imagery, quantitative analysis of split detector AOSLO images is currently a time-consuming manual process. In this paper, we present the fully automatic adaptive filtering and local detection (AFLD) method for detecting cones in split detector AOSLO images. We validated our algorithm on 80 images from 10 subjects, showing an overall mean Dice’s coefficient of 0.95 (standard deviation 0.03), when comparing our AFLD algorithm to an expert grader. This is comparable to the inter-observer Dice’s coefficient of 0.94 (standard deviation 0.04). To the best of our knowledge, this is the first validated, fully-automated segmentation method which has been applied to split detector AOSLO images.
OCIS codes: (100.0100) Image processing, (170.4470) Ophthalmology, (110.1080) Active or adaptive optics
1. Introduction
A multitude of retinal diseases result in the death or degeneration of photoreceptor cells. As such, the ability to visualize and quantify changes in the photoreceptor mosaic could be useful for the diagnosis and prognosis of these diseases, or for studying treatment efficacy. The use of adaptive optics (AO) to correct for the monochromatic aberrations of the eye has given multiple ophthalmic imaging systems the ability to visualize photoreceptors in vivo [1–8], with the AO scanning light ophthalmoscope (AOSLO) [2] being the most common of these technologies. AO ophthalmoscopes have been utilized to quantify and characterize various aspects of the normal photoreceptor mosaic [1, 9–15], and also in the analysis of mosaics affected by various retinal diseases [16–22].
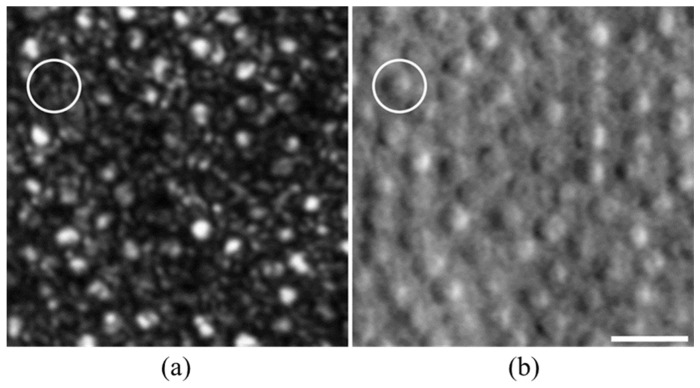
The resolution advantage of confocal AOSLO enables the visualization of the smallest photoreceptors in the retina - rods and foveal cones [12]. However, confocal AOSLO photoreceptor imaging, which is thought to rely on intact outer segment structure to propagate the waveguided signal, occasionally provides ambiguity in identifying retinal structures [23]. For example, in the confocal AOSLO image of the perifoveal retina shown in Fig. 1(a), it is challenging to clearly distinguish cones from rods. To address this issue, and inspired by earlier works on enhanced visualization of retinal vasculature using multiple-scattered light [24], non-confocal split detector AOSLO has been developed [25]. Split detector AOSLO reveals the cone inner segment mosaic, even in conditions where the waveguided signal in the accompanying confocal image is diminished [25]. Moreover, as shown in Fig. 1(b), split detector AOSLO images allow unambiguous identification of cones in the normal perifoveal retina.
Fig. 1.
Comparison of peripheral rod and cone visualization in confocal and split detector AOSLO imaging in a normal subject (a) Confocal AOSLO image at 10° from the fovea shows rod and cone structures, but it is challenging to confidently differentiate a cluster of rods from a single cone with a complex waveguide signal. (b) Split detector image from the same location better visualizes cones but is incapable of visualizing rods. Circle indicates a cone, which is clearly visible in split detector AOSLO but appears as a collection of rod-like structures in confocal AOSLO. Scale bar: 20 μm.
Identification of individual photoreceptors is often a required step in quantitative analysis of the photoreceptor mosaic. Since manual grading is subjective (with low repeatability for split detector and confocal AOSLO images [26]), and is often too costly and time consuming for clinical applications, multiple automated algorithms have been developed for detecting cones in AO images [27–37]. However, given the distinctive appearance of cones in split detector AOSLO images, one cannot simply transfer an existing algorithm from other AO modalities (e.g. confocal AOSLO, AO flood illumination, or AO optical coherence tomography) to split detector AOSLO without modifications. Thus, quantitative analysis of photoreceptor mosaics visualized on split detector AOSLO currently requires manual grading.
To address this problem, we present a fully-automated algorithm for the detection of cones in non-confocal split detector based AOSLO images. We validate this algorithm against the gold standard of manual marking at a variety of locations within the human retina.
2. Methods
We denote our proposed automated cone segmentation algorithm the adaptive filtering and local detection (AFLD) method. This two-step algorithm first estimates the radius of Yellott’s ring [38,39], which is an annular structure that appears in the Fourier transform of cone photoreceptor images, with a radius that coarsely corresponds to the modal cone spatial frequency [40]. The estimated frequency is then used to create a Fourier domain adaptive filter to remove information non-pertinent to the cones. In the second step, a priori information about the appearance of cones in split detector AOSLO images is used to aid in detection of cones. The schematic in Fig. 2 outlines the core steps in our algorithm, which are discussed in the following subsections. In what follows in this section, we first describe the image acquisition and pre-processing procedures in section 2.1. The two steps of the AFLD algorithm are explained in sections 2.2 and 2.3, respectively. Finally, section 2.4 describes the validation process used for evaluating the performance of the algorithm.
Fig. 2.
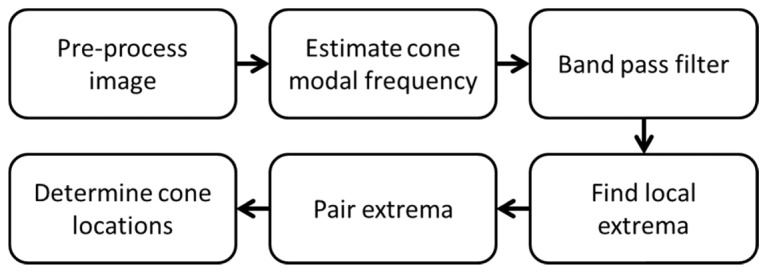
Schematic for AFLD split detector AOSLO cone detection algorithm.
2.1 Image acquisition and pre-processing
This research followed the tenets of the Declaration of Helsinki, and was approved by the institutional review boards at the Medical College of Wisconsin (MCW) and Duke University. Image sets from 14 subjects with normal vision were obtained from the Advanced Ocular Imaging Program image bank (MCW, Milwaukee, Wisconsin). In addition, images from 2 subjects with congenital achromatopsia and 2 subjects with oculocutaneous albinism were obtained. All images were acquired using a previously described split detector AOSLO [7,25], with a 1.0° field of view.
Axial length measurements were obtained from all subjects using an IOL Master (Carl Zeiss Meditec, Dublin, CA). To convert from image pixels to retinal distance (μm), images of a Ronchi ruling with a known spacing were used to determine the conversion between image pixels and degrees. An adjusted axial length method [41] was then used to approximate the retinal magnification factor (in µm/degree) and calculate the µm/pixel of each image.
We extracted eight split detector images of the photoreceptor mosaic from each subject’s data set within a single randomly-chosen meridian (superior, temporal, inferior, nasal) at multiple eccentricities (range: 500-2,800 µm). An ROI containing approximately 100 photoreceptors was extracted from each image, and intensity values were normalized to stretch between 0 and 255.
2.2 Fourier domain adaptive filtering
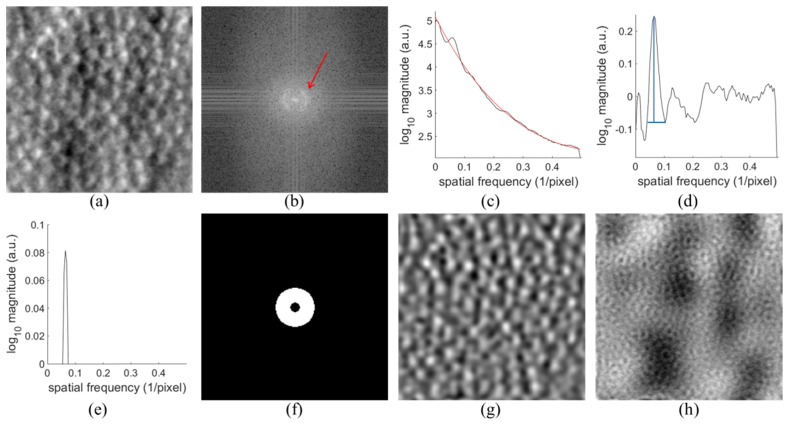
Cone mosaics can be well approximated by the band pass component of their Fourier domain representation [38,39] (Fig. 3). Therefore, removing low and high frequency components in the non-confocal split detector based AOSLO images of cones would reduce noise and improve image contrast. Thus, in the first step of the AFLD algorithm, we estimated the modal spatial frequency of the cones within the split detector AOSLO images in order to set the cutoff frequencies of a preprocessing band pass filter. This is similar to the method proposed in [42], where the modal frequency is estimated to directly calculate cone density in confocal AOSLO images. Here, we devised an alternate method for estimating the modal frequencies to account for the differences in the Fourier spectra between split detector and confocal AOSLO.
Fig. 3.
Adaptive filtering of split detector AOSLO cone images. (a) Original Image. (b) Discrete Fourier transform of (a) log10 compressed. Red arrow points to Yellott’s ring. (c) Average radial cross section of (b) over 9 sections after filtering in black. Fitted curve in red. (d) Result of subtracting fitted red curve from the black curve in (c). Peak corresponding to cones shown in blue. (e) Upper fourth of peak from (d). (f) Band pass filter in Fourier domain. (g) Filtered original image. (h) Information removed from (a) by filtering.
In this step, we transformed the image into the frequency domain using the discrete Fourier transform. Next, we applied a log10 transformation to the absolute value of the Fourier transformed image, resulting in a frequency domain image with a roughly circular band corresponding to the spatial frequency of the cones in the original image (Fig. 3(b)). We then applied a 7 × 7 pixel uniform averaging filter to this image to reduce noise.
In the next step, we estimated the 1-dimensional modal spatial frequency of the cones, corresponding to the radius of Yellott’s ring within the Fourier image. We averaged nine equally spaced slices through the center of the frequency space to get a 1-dimensional curve (black line in Fig. 3(c)) with a prominent peak corresponding to the modal cone spatial frequency. Note that due to the split detector orientation, the bulk of the spectral power for the cone component of the image is near the horizontal axis. Thus, the selected nine slices were spaced angularly from −20 to 20 degrees around the horizontal axis. As can be seen in Fig. 3(c), the resulting curve consists of a peak corresponding to cone information, along with a gradually decreasing distribution. We found that removing this underlying distribution prior to estimating the modal spatial frequency improved the reliability of locating the peak corresponding to the cone information and the final accuracy of the algorithm, even though removing the distribution leads to shifting the peak to slightly higher frequencies. We estimated the underlying distribution using the least-squares fit of a sum of two exponentials to the data (red curve in Fig. 3(c)), and then subtracted the fit from the curve (Fig. 3(d)). Next, we used MATLAB’s findpeaks function to find the peak corresponding to the modal cone spatial frequency. We chose the first prominent peak within the frequency range of 0.04 to 0.16 pixels−1. This range corresponds on average to cone densities between 5400 and 88000 cones/mm2, which was chosen to encapsulate the range of cone densities seen in healthy eyes at the eccentricities examined [43]. To find the final estimate of the modal cone spatial frequency (), we found the center of mass of the upper fourth of the peak (Fig. 3(e)).
We used the estimate of the cone spatial frequency to create a binary annular band pass filter (Fig. 3(f)), with upper and lower cutoff frequencies and the greater value between and 0.025 pixels−1, respectively. The hard lower bound was used to ensure adequate low frequency information was removed. We then multiplied this filter by the Fourier transformed cone photoreceptor image. We inverse Fourier transformed the resulting filtered image to the space domain (Fig. 3(g)), which has much of the non-cone low and high frequency fluctuations (Fig. 3(h)) removed. We used no additional windowing beyond what was described for the forward and inverse Fourier transforms.
2.3 Cone detection
The second step in the AFLD method is to find the location of cones within the filtered image. In split detector images, individual cones appear as pairs of horizontally separated dark and bright regions (Fig. 4(a)). The relative shift of these two regions is constant throughout an image and depends on the orientation of the split detection aperture (all images in this study had dark regions to the left of light regions). Thus, to improve detection accuracy, we exploited this a priori information on the paired local minima and maxima manifestation of cones in split detector AOSLO images.
Fig. 4.
Detection of cones in band pass filtered image from Fig. 3. (a) Original image (b) Filtered image, same as Fig. 3(g), with local minima marked in red and maxima in green. (c) Matched pairs of minima and maxima. (d) Final detection results on original image from (a). Cones found using matched pairs are shown in green and the cone found using maximum value only is shown in red.
First, we found the location and intensity values of all local minima and maxima in the filtered image (Fig. 4(b)). Next, we paired the minima and maxima together (Fig. 4(c)) following the constraints that 1) maxima must be to the right of minima, 2) the points must be within weighted distance of each other, 3) for each maximum only the pair with the smallest weighted distance may be used, and 4) each minimum is only included in one pair. The weighted distance is defined as , which has higher weight on the vertical component in order to prioritize horizontal matches. We used the inverse of the modal frequency to limit the search regions as it is related to the size and spacing of cones. To find these opposing extrema pairs, we used the convex hull function [44] to find the closest (using ) minima for each maxima under the given constraints. To make sure the matches are one-to-one, we checked each paired minima to see if it is paired with multiple maxima, and if so, we kept only the pair with the smallest distance between points. In order to satisfy the above constraints, some maxima may have no corresponding minimum pair. We recorded these unpaired maxima to be analyzed as well.
The final step is to use the matched extrema pairs to determine the locations of cones. We calculated the average intensity magnitude for each opposing extrema pair as . We then used thresholding to determine whether an extrema pair corresponded to a cone in the image. The threshold varied for different modal cone frequencies and for each image was defined as:
| (1) |
where is the standard deviation of the band pass filtered image. We accepted all extrema pairs with as corresponding to cones, and the location of each cone was defined as the average of the minimum and maximum’s location (Fig. 4(d)). We chose the threshold values in Eq. (1) empirically through training based on the observation that there was tendency to overestimate the number of cones at low modal frequencies and underestimate the number of cones at high frequencies. As such, the threshold values are generally higher at higher eccentricities and lower at lower eccentricities from the fovea. These thresholds were set based on a training data set from subjects which were not included in the testing set.
Additionally, we evaluated the maxima that were not paired in the same way using instead of , with the threshold for the same frequency bounds set to 2.1σ, 1.75σ, or 1.4σ, respectively. Naturally, cones found using the maxima alone have their location set to be at the maximum’s position. Only three percent of cones found across the validation data set were from the maxima alone.
2.4 Measures of performance and validation
Subjects with normal vision were divided into groups for training and validation. Subjects from the training and validation data sets did not overlap. In order to form the training group, one subject from each of the four meridians was randomly selected. All 8 images from each subject were used, totaling 32 images for algorithm training. All parameters used in implementing the algorithm were set based on this training. An expert grader performed the manual evaluations used in this process. We then used the 80 images from the remaining 10 subjects for performance evaluation of the algorithm.
We computed standard measures of performance for the AFLD algorithm with respect to the gold-standard of manual marking. Here, two expert manual graders independently evaluated the validation set; the first was the expert used in training the algorithm, and a second grader was also engaged. Thus, for each eye there were data from the AFLD algorithm and each of the graders. Two approaches were taken. First, we focused on the sensitivity and precision of the AFLD method. We analyzed the spatial distributions within each image of the cones identified by AFLD and by the manual assessments. We identified the overlaps in these cones (identified by both methods) and the sources (AFLD or manual) of the non-overlapping cones. This was based on a nearest neighbor analysis. This enabled determination of sensitivity (true positive rate) and precision (1-false discovery rate). Then, we considered measures of the total numbers of cones detected per image, expressed as the cone density, and contrasted them across the AFLD and manual results from both graders on a per image basis for the validation data set.
For the sensitivity/precision analysis, we focused on identifying cones in each image that both ALFD and the manual grading detected, those that AFLD failed to detect and those which it falsely detected. We found one-to-one pairs between the automatic and manual locations with the following constraints: 1) there are no restrictions on the orientation with respect to each other, 2) the two locations must be within of each other (where is the median cone spacing from manual marking for the image), 3) for each manual marking only the pair with the smallest distance is used, and 4) each automatic marking is only included in one pair. We estimated for an image by finding the distance for each manually marked cone to its nearest neighbor in pixels and then taking the median of these measurements. To remove border artifacts, we did not consider the cones located within 7 pixels of the edge of the image. The border value was chosen to correspond to half the average value of across our data set.
We denote the number of cones detected by both AFLD and manual as NTrue Positive, by manual with no corresponding automatic as NFalse Negative, and by automatic with no corresponding manual as NFalse Positive. The numbers of cones from both the automatic and manual markings are then expressed as:
| (2) |
| (3) |
In order to compare results of the automatic and manual approaches, we calculated the true positive rate, false discovery rate, and Dice’s coefficient [45,46] as:
| (4) |
| (5) |
| (6) |
Dice’s coefficient is a common metric for describing the overall similarity between two sets of observations, and is affected by both the true and false positives. Additionally, we calculated the same metrics comparing the two graders to one another. We used paired two-sided Wilcoxon signed rank tests in order to analyze significances of differences for each of these three summary metrics.
In order to compare the total numbers of cones found in images without considering their spatial locations, we calculated the cone density, defined as the ratio of the number of cones marked in an image to the total area of the image. This was compared across AFLD and both graders: grader #1 vs. AFLD; grader #2 vs. AFLD; grader #1 and grader #2 average (per image) vs. AFLD; and grader #1 vs grader #2. Two complementary approaches were taken. First, linear regression and correlation analyses were conducted. Then, Bland-Altman analyses were performed [47].
3. Results
3.1 Cone detection in healthy eyes
We coded the fully automated AFLD algorithm in MATLAB (The MathWorks, Natick, MA). The algorithm was run on a desktop computer with an i7-5930K CPU at 3.5 GHz and 64 GB of RAM. Parallelization across 6 cores with hyper threading was used. The mean run time for the AFLD algorithm was 0.03 seconds per image across the validation data set (average image size of 206.5 by 206.5 pixels). This included time for reading the images and saving results.
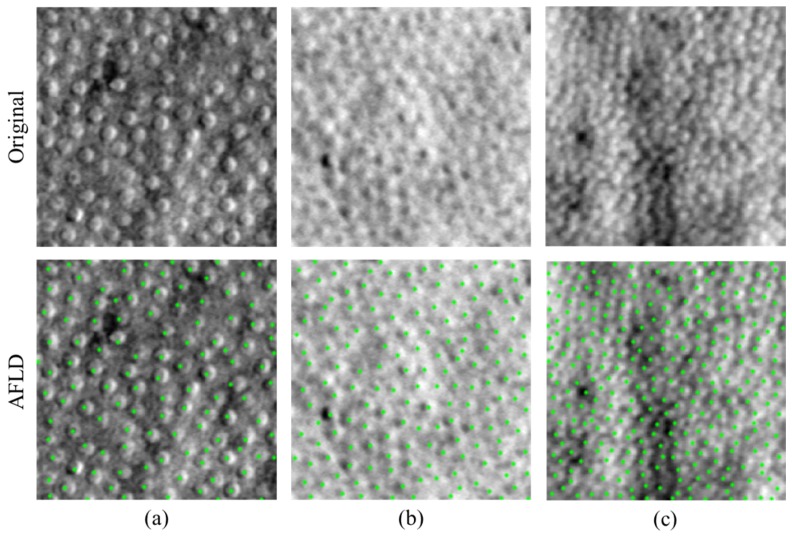
Across the validation data set, the AFLD algorithm found over 10500 cones in total. Figure 5 is a representative segmentation result in three images from different subjects and acquired from different eccentricities. Note the differences in cone spacing, and image quality.
Fig. 5.
AFLD cone detection in images of different cone spacing and image quality. Original images are shown in the top row and images with automatically detected cones marked in green are shown in the bottom row. Images have increasing cone density from left to right. The cone density is 8,947 cones/mm2 in (a), 14,206 cones/mm2 in (b), and 34,063 cones/mm2 in (c) as determined by the first manual marking. Dice’s coefficients are 0.9843 for (a), 0.9774 for (b), and 0.9243 for (c).
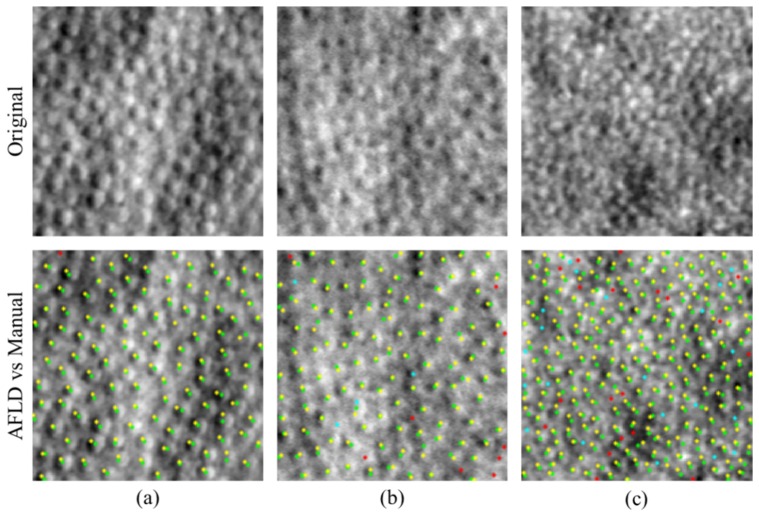
Figure 6 illustrates results for the AFLD and first manual marking for three images. In the set of marked images, matched pairs between AFLD and manual are shown in green for automatic and yellow for manual (true positives). Cones missed by AFLD are shown in cyan (false negatives), and locations marked by AFLD but not by the manual grader are shown in red (false positives).
Fig. 6.
Comparison of AFLD marking to the first manual marking on images with varying quality and cone contrast. Original images are shown in the top row. AFLD and manual markings are shown in the bottom row with markings as follows: green (automatic) and yellow (manual) denotes a match; cyan denotes a false negative; and red denotes a false positive. Dice’s coefficients are 0.9957 for (a), 0.9461 for (b), and 0.9123 for (c). Dice’s coefficients are approximately one standard deviation above, at, and one standard deviation below the mean value for the validation set.
Tables 1 and 2 summarize results of the sensitivity/precision analysis of the AFLD algorithm. Quantitatively, the true positive rates and Dice’s coefficients are relatively high. The false discovery rates are relatively low (albeit with notably greater variability across all the images for all methods). Table 1 summarizes the performance of the AFLD algorithm and grader #2, while using grader #1 as the gold standard. No significant differences were found between AFLD and the second manual grader for the true positive rates (p = 0.96), false discovery rates (p = 0.18), and Dice’s coefficients (p = 0.06). Table 2 shows analogous contrasts, now using grader #2 as the gold standard and evaluating performance of grader #1 as well as AFLD. Here, there were statistically significant differences in the true positive rates (p = 0.048), false discovery rates (p<0.001), and Dice’s coefficients (p<0.001), even though their absolute differences per image were relatively small.
Table 1. Performance of AFLD and second manual marking with respect to the first manual marking across the validation data set (standard deviations shown in parenthesis).
| True positive rate | False discovery rate | Dice’s coefficient | |
|---|---|---|---|
| Automated (AFLD) | 0.96 (0.03) | 0.05 (0.05) | 0.95 (0.03) |
| Manual (grader # 2) | 0.96 (0.05) | 0.06 (0.06) | 0.94 (0.04) |
Table 2. Performance of AFLD and first manual marking with respect to the second manual marking across the validation data set (standard deviations shown in parenthesis), where (*: p<0.05, ***: p<0.001).
| True positive rate* | False discovery rate*** | Dice’s coefficient*** | |
|---|---|---|---|
| Automated (AFLD) | 0.93 (0.07) | 0.07 (0.06) | 0.93 (0.05) |
| Manual (grader # 1) | 0.94 (0.07) | 0.04 (0.05) | 0.94 (0.05) |
Figure 7 gives a set of scatter plots of results for the cone density per image. These plots contrast manual grader #1 vs. AFLD (Fig. 7(a)), manual grader #2 vs. AFLD (Fig. 7(b)), the average per image of the two graders vs. AFLD (Fig. 7(c)), and manual grader #1 vs. manual grader #2 (Fig. 7(d)). All plots could be modeled as linear (p<0.001), with relatively small confidence intervals about the regression lines. The slopes of all regression lines in Fig. 7 were significantly different from unity (p<0.001), and the intercepts of all lines were significantly different from zero (p<0.001).
Fig. 7.
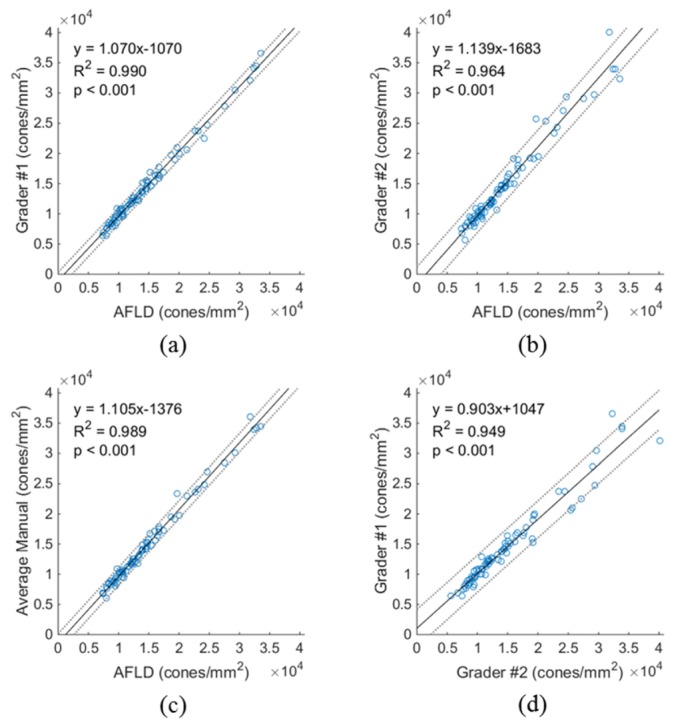
Scatter plots of cone density measures for (a) grader #1 vs. AFLD, (b) grader #2 vs. AFLD, (c) average of both graders vs. AFLD, and (d) grader #1 vs. grader #2. In each plot, the solid black line shows the regression line, with the corresponding equation, coefficient of determination (R2), and p value shown in the upper left corner. Dotted lines are 95% confidence intervals.
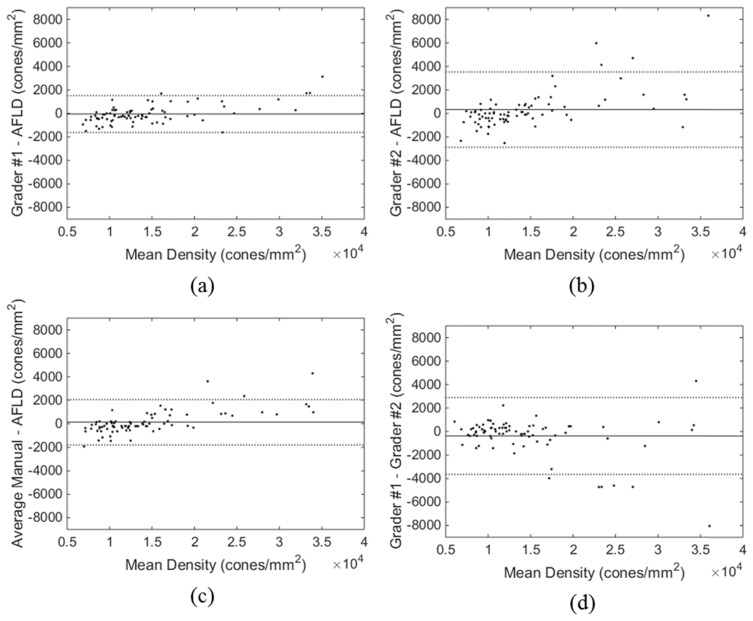
Figure 8 gives Bland-Altman plots for the same contrasts as Fig. 7. The solid line is the average difference per method and the dotted lines are 95% confidence limits. Notably, for cone densities below about 2.25 × 10⁴ cones/mm2, differences are within the confidence limit intervals. Above that density, there is more scatter between the two manual graders as well as in the comparisons with AFLD. This is consistent with the scatter in Fig. 7.
Fig. 8.
Bland-Altman plots of cone density for (a) grader #1 - AFLD, (b) grader #2 - AFLD, (c) average of both graders - AFLD, and (d) grader #1 - grader #2. The solid black line shows the mean difference, and the dotted lines show the 95% confidence limits of agreement.
3.2 Preliminary cone detection in pathologic eyes
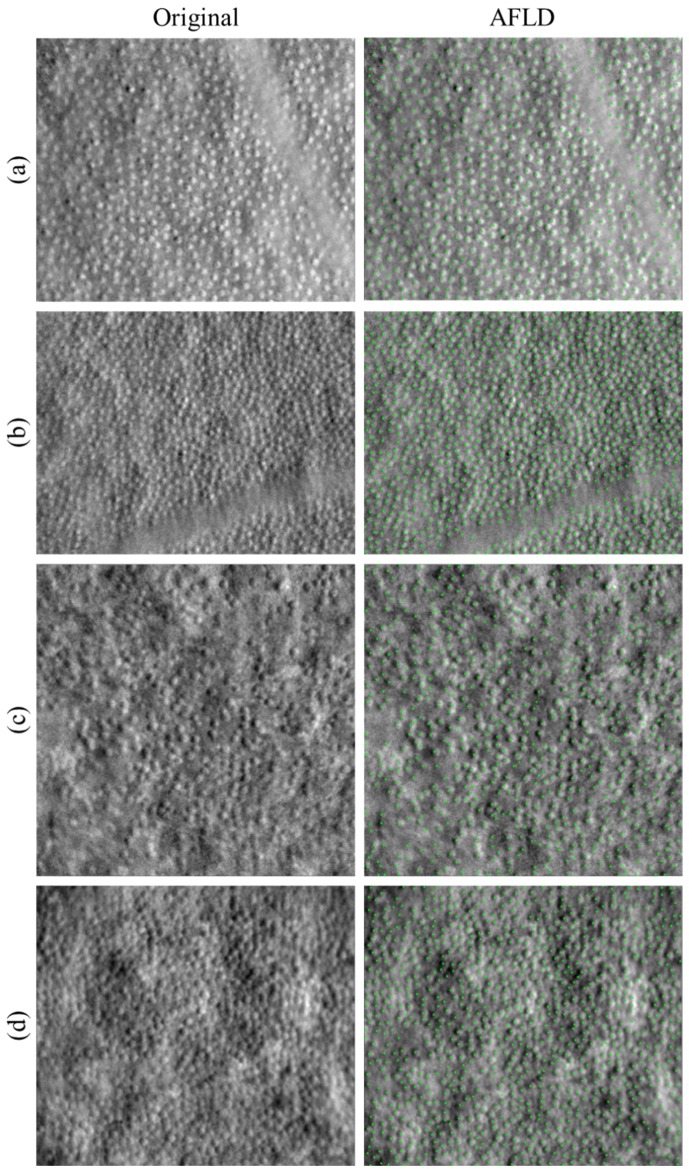
Section 3.1 described our detailed quantitative analysis of AFLD performance for detecting cones on split detector AOSLO images of normal eyes, which is the main goal of this paper. As a demonstrative example, we tested our algorithm on four subjects with diseases that affects photoreceptors. Figure 9 below shows the segmentation results for two subjects with albinism (Fig. 9(a)-9(b)) and two subjects with achromatopsia (Fig. 9(c)-9(d)). In these experiments, we implemented the AFLD algorithm as is without any modification. The extension and quantitative validation of our algorithm for diseased eyes are out of the scope of this preliminary paper, and will be fully addressed in our upcoming publications.
Fig. 9.
AFLD cone detection in split detector images of four subjects with photoreceptor pathology. Original images are shown in the left column, and images with automatically detected cones marked in green are shown in the right column. Subject pathologies are (a-b) oculocutaneous albinism and (c-d) achromatopsia.
4. Discussion
We developed a fully automated algorithm for localizing cones in non-confocal split detector based AOSLO images of healthy eyes. This utilizes an adaptive filter along with a priori information about the imaging modality to aid in detection. The algorithm was validated (without a need for manual adjustment of parameters, which were estimated from a separate training data set) against the current gold standard of manual segmentation. Our fast algorithm performed with a high degree of sensitivity, precision, and overall similarity as defined by the Dice’s coefficient, when compared to manual grading on a large data set of images differing greatly in appearance and cone density.
There were slight differences in overall similarity (Dice’s coefficient) of the AFLD algorithm and the two manual graders (Tables 1, 2). When comparing the automated marking and manual marking of the second grader to the marking of the first grader, the results of AFLD algorithm were closer to the gold standard first grader’s marking (without statistical significance). Alternatively, when comparing the automated marking and manual marking of the first grader to the marking of the second grader, the results of first grader were closer to the gold standard second grader’s marking (with statistical significance). This might be in part due to the fact that the algorithmic parameters were determined based on the training set marking from the first grader (the more experienced of the two). That is, our algorithm tends to mimic grader #1’s marking; thus it is reasonable that the automatic results would more closely match the first grader’s marking for the validation set. However, it should be emphasized that regardless of statistical significance, the Dice’s coefficient difference between the automated and manual methods in each of the above two cases was on the order of 0.01, a negligible amount in practice.
The AFLD method also shows good performance in determining summary measures per image of cone density. The linear regression and correlation analyses of the cone density scatter plots of Fig. 7 demonstrate the high degree of linear correspondence between the automatic and manual methods. Correlation is higher for AFLD vs. grader #1, consistent with the discussion above. Notably, the scatter plots show less (albeit still high) correlation between the two graders. Given the large sample size (n = 80), it is not surprising that, in a formal statistical sense, the values for the slopes and intercepts of the regression lines were found to be statistically different from one and zero, respectively. However, the magnitude of these differences was sufficiently small to demonstrate the fidelity of the automatic approach. The differences between the automated and manual results are also small, as seen in the Bland-Altman plots of Fig. 8. Again, these differences are greater when AFLD is compared to grader #2 than grader #1. And again, as for the scatter plots, the differences for grader #1 vs. grader #2 are also relatively larger. The discrepancies tend to occur at higher cone densities, where the AFLD method tends to underestimate the manually determined number of cones. The smaller cones at high eccentricities are more difficult to detect even by manual graders, as illustrated in Fig. 7(d) and Fig. 8(d).
Interpretation and quantification of retinal anatomy and pathology, as based on a single ophthalmic image modality, are at times unreliable. Of course, it is not surprising that a higher resolution system such as confocal AOSLO can visualize pathology not identifiable on clinical imaging systems such as optical coherence tomography (OCT) [22]. Moreover, as shown in Fig. 1, perifoveal cones and rods can be often better identified on split detector AOSLO and confocal AOSLO, respectively. Thus, optimal quantification of rod and cone photoreceptor structures requires analysis of both confocal and split detector AOSLO images from the same subject. On another front, OCT’s superior axial resolution with respect to AOSLO provides important complementary 3D information about the retinal structures. As such, a recent study recommends employing a multi-imaging modality approach (including OCT and AOSLO imaging systems) to provide additional evidence needed for confident identification of photoreceptors [23]. Development of such multi-modality image segmentation algorithms is part of our ongoing work.
A limitation of this study is that we only trained and quantitatively tested our algorithm on split detector AOSLO images of healthy eyes. Our data set does, however, contain images with significant variability in appearance (e.g. Fig. 6). Additionally, the algorithm relies on being able to locate Yellott’s ring, which may be difficult for irregular mosaics presented in some disease cases. As a future approach to this, we are developing a kernel regression [48] based machine learning algorithm trained on a large data set from diseased eyes in order to be able to locate cones without reliance on locating Yellott’s ring. However, the qualitative results in the pathologic images in Fig. 9 show promise for the adaptability of our algorithm to diseased cases. It is encouraging that the AFLD algorithm is able to correctly locate cones and ignore vascular and pathologic features that were not seen in training. We note that direct implementation of an algorithm developed for normal eyes is not expected to be robust for all types of pathology, as was the case for the development of automatic segmentation algorithms for retinal OCT. However, development of automated OCT segmentation algorithms for normal eyes (e.g [49].) was the crucial first step in development of future algorithms robust to pathology (e.g [48,50].). Indeed, as in the case of segmenting pathologic features in OCT images, there is a long road ahead in developing a robust comprehensive fully automatic AOSLO segmentation algorithm applicable to a large set of ophthalmic diseases.
Acknowledgments
Research reported in this publication was supported by the National Eye Institute and the National Institute of Biomedical Imaging and Bioengineering of the National Institutes of Health under award numbers R01EY017607, R01EY024969, P30EY001931, and T32EB001040. The content is solely the responsibility of the authors and does not necessarily represent the official views of the National Institutes of Health.
References and links
- 1.Roorda A., Williams D. R., “The arrangement of the three cone classes in the living human eye,” Nature 397(6719), 520–522 (1999). 10.1038/17383 [DOI] [PubMed] [Google Scholar]
- 2.Roorda A., Romero-Borja F., Donnelly Iii W., Queener H., Hebert T., Campbell M., “Adaptive optics scanning laser ophthalmoscopy,” Opt. Express 10(9), 405–412 (2002). 10.1364/OE.10.000405 [DOI] [PubMed] [Google Scholar]
- 3.Zawadzki R. J., Jones S. M., Olivier S. S., Zhao M., Bower B. A., Izatt J. A., Choi S., Laut S., Werner J. S., “Adaptive-optics optical coherence tomography for high-resolution and high-speed 3D retinal in vivo imaging,” Opt. Express 13(21), 8532–8546 (2005). 10.1364/OPEX.13.008532 [DOI] [PMC free article] [PubMed] [Google Scholar]
- 4.Merino D., Dainty C., Bradu A., Podoleanu A. G., “Adaptive optics enhanced simultaneous en-face optical coherence tomography and scanning laser ophthalmoscopy,” Opt. Express 14(8), 3345–3353 (2006). 10.1364/OE.14.003345 [DOI] [PubMed] [Google Scholar]
- 5.Torti C., Považay B., Hofer B., Unterhuber A., Carroll J., Ahnelt P. K., Drexler W., “Adaptive optics optical coherence tomography at 120,000 depth scans/s for non-invasive cellular phenotyping of the living human retina,” Opt. Express 17(22), 19382–19400 (2009). 10.1364/OE.17.019382 [DOI] [PMC free article] [PubMed] [Google Scholar]
- 6.Ferguson R. D., Zhong Z., Hammer D. X., Mujat M., Patel A. H., Deng C., Zou W., Burns S. A., “Adaptive optics scanning laser ophthalmoscope with integrated wide-field retinal imaging and tracking,” J. Opt. Soc. Am. A 27(11), A265–A277 (2010). 10.1364/JOSAA.27.00A265 [DOI] [PMC free article] [PubMed] [Google Scholar]
- 7.Dubra A., Sulai Y., “Reflective afocal broadband adaptive optics scanning ophthalmoscope,” Biomed. Opt. Express 2(6), 1757–1768 (2011). 10.1364/BOE.2.001757 [DOI] [PMC free article] [PubMed] [Google Scholar]
- 8.Jonnal R. S., Kocaoglu O. P., Wang Q., Lee S., Miller D. T., “Phase-sensitive imaging of the outer retina using optical coherence tomography and adaptive optics,” Biomed. Opt. Express 3(1), 104–124 (2012). 10.1364/BOE.3.000104 [DOI] [PMC free article] [PubMed] [Google Scholar]
- 9.Roorda A., Williams D. R., “Optical fiber properties of individual human cones,” J. Vis. 2(5), 404–412 (2002). 10.1167/2.5.4 [DOI] [PubMed] [Google Scholar]
- 10.Kitaguchi Y., Bessho K., Yamaguchi T., Nakazawa N., Mihashi T., Fujikado T., “In vivo measurements of cone photoreceptor spacing in myopic eyes from images obtained by an adaptive optics fundus camera,” Jpn. J. Ophthalmol. 51(6), 456–461 (2007). 10.1007/s10384-007-0477-7 [DOI] [PubMed] [Google Scholar]
- 11.Chui T. Y., Song H., Burns S. A., “Adaptive-optics imaging of human cone photoreceptor distribution,” J. Opt. Soc. Am. A 25(12), 3021–3029 (2008). 10.1364/JOSAA.25.003021 [DOI] [PMC free article] [PubMed] [Google Scholar]
- 12.Dubra A., Sulai Y., Norris J. L., Cooper R. F., Dubis A. M., Williams D. R., Carroll J., “Noninvasive imaging of the human rod photoreceptor mosaic using a confocal adaptive optics scanning ophthalmoscope,” Biomed. Opt. Express 2(7), 1864–1876 (2011). 10.1364/BOE.2.001864 [DOI] [PMC free article] [PubMed] [Google Scholar]
- 13.Pircher M., Kroisamer J. S., Felberer F., Sattmann H., Götzinger E., Hitzenberger C. K., “Temporal changes of human cone photoreceptors observed in vivo with SLO/OCT,” Biomed. Opt. Express 2(1), 100–112 (2011). 10.1364/BOE.2.000100 [DOI] [PMC free article] [PubMed] [Google Scholar]
- 14.Kocaoglu O. P., Lee S., Jonnal R. S., Wang Q., Herde A. E., Derby J. C., Gao W., Miller D. T., “Imaging cone photoreceptors in three dimensions and in time using ultrahigh resolution optical coherence tomography with adaptive optics,” Biomed. Opt. Express 2(4), 748–763 (2011). 10.1364/BOE.2.000748 [DOI] [PMC free article] [PubMed] [Google Scholar]
- 15.Lombardo M., Serrao S., Lombardo G., “Technical factors influencing cone packing density estimates in adaptive optics flood illuminated retinal images,” PLoS One 9(9), e107402 (2014). 10.1371/journal.pone.0107402 [DOI] [PMC free article] [PubMed] [Google Scholar]
- 16.Choi S. S., Doble N., Hardy J. L., Jones S. M., Keltner J. L., Olivier S. S., Werner J. S., “In vivo imaging of the photoreceptor mosaic in retinal dystrophies and correlations with visual function,” Invest. Ophthalmol. Vis. Sci. 47(5), 2080–2092 (2006). 10.1167/iovs.05-0997 [DOI] [PMC free article] [PubMed] [Google Scholar]
- 17.Duncan J. L., Zhang Y., Gandhi J., Nakanishi C., Othman M., Branham K. E. H., Swaroop A., Roorda A., “High-resolution imaging with adaptive optics in patients with inherited retinal degeneration,” Invest. Ophthalmol. Vis. Sci. 48(7), 3283–3291 (2007). 10.1167/iovs.06-1422 [DOI] [PubMed] [Google Scholar]
- 18.Choi S. S., Zawadzki R. J., Greiner M. A., Werner J. S., Keltner J. L., “Fourier-domain optical coherence tomography and adaptive optics reveal nerve fiber layer loss and photoreceptor changes in a patient with optic nerve drusen,” J. Neuroophthalmol. 28(2), 120–125 (2008). 10.1097/WNO.0b013e318175c6f5 [DOI] [PMC free article] [PubMed] [Google Scholar]
- 19.Ooto S., Hangai M., Sakamoto A., Tsujikawa A., Yamashiro K., Ojima Y., Yamada Y., Mukai H., Oshima S., Inoue T., Yoshimura N., “High-resolution imaging of resolved central serous chorioretinopathy using adaptive optics scanning laser ophthalmoscopy,” Ophthalmology 117(9), 1800–1809 (2010). 10.1016/j.ophtha.2010.01.042 [DOI] [PubMed] [Google Scholar]
- 20.Merino D., Duncan J. L., Tiruveedhula P., Roorda A., “Observation of cone and rod photoreceptors in normal subjects and patients using a new generation adaptive optics scanning laser ophthalmoscope,” Biomed. Opt. Express 2(8), 2189–2201 (2011). 10.1364/BOE.2.002189 [DOI] [PMC free article] [PubMed] [Google Scholar]
- 21.Kitaguchi Y., Kusaka S., Yamaguchi T., Mihashi T., Fujikado T., “Detection of photoreceptor disruption by adaptive optics fundus imaging and Fourier-domain optical coherence tomography in eyes with occult macular dystrophy,” Clin. Ophthalmol. 5, 345–351 (2011). 10.2147/OPTH.S17335 [DOI] [PMC free article] [PubMed] [Google Scholar]
- 22.Stepien K. E., Martinez W. M., Dubis A. M., Cooper R. F., Dubra A., Carroll J., “Subclinical photoreceptor disruption in response to severe head trauma,” Arch. Ophthalmol. 130(3), 400–402 (2012). 10.1001/archopthalmol.2011.1490 [DOI] [PMC free article] [PubMed] [Google Scholar]
- 23.Roorda A., Duncan J. L., “Adaptive optics ophthalmoscopy,” Annu Rev Vis Sci 1(1), 19–50 (2015). 10.1146/annurev-vision-082114-035357 [DOI] [PMC free article] [PubMed] [Google Scholar]
- 24.Chui T. Y. P., Vannasdale D. A., Burns S. A., “The use of forward scatter to improve retinal vascular imaging with an adaptive optics scanning laser ophthalmoscope,” Biomed. Opt. Express 3(10), 2537–2549 (2012). 10.1364/BOE.3.002537 [DOI] [PMC free article] [PubMed] [Google Scholar]
- 25.Scoles D., Sulai Y. N., Langlo C. S., Fishman G. A., Curcio C. A., Carroll J., Dubra A., “In vivo imaging of human cone photoreceptor inner segments,” Invest. Ophthalmol. Vis. Sci. 55(7), 4244–4251 (2014). 10.1167/iovs.14-14542 [DOI] [PMC free article] [PubMed] [Google Scholar]
- 26.Abozaid M. A., Langlo C. S., Dubis A. M., Michaelides M., Tarima S., Carroll J., “Reliability and repeatability of cone density measurements in patients with congenital achromatopsia,” Adv. Exp. Med. Biol. 854, 277–283 (2016). 10.1007/978-3-319-17121-0_37 [DOI] [PMC free article] [PubMed] [Google Scholar]
- 27.Li K. Y., Roorda A., “Automated identification of cone photoreceptors in adaptive optics retinal images,” J. Opt. Soc. Am. A 24(5), 1358–1363 (2007). 10.1364/JOSAA.24.001358 [DOI] [PubMed] [Google Scholar]
- 28.Xue B., Choi S. S., Doble N., Werner J. S., “Photoreceptor counting and montaging of en-face retinal images from an adaptive optics fundus camera,” J. Opt. Soc. Am. A 24(5), 1364–1372 (2007). 10.1364/JOSAA.24.001364 [DOI] [PMC free article] [PubMed] [Google Scholar]
- 29.Wojtas D. H., Wu B., Ahnelt P. K., Bones P. J., Millane R. P., “Automated analysis of differential interference contrast microscopy images of the foveal cone mosaic,” J. Opt. Soc. Am. A 25(5), 1181–1189 (2008). 10.1364/JOSAA.25.001181 [DOI] [PubMed] [Google Scholar]
- 30.Turpin A., Morrow P., Scotney B., Anderson R., Wolsley C., “Automated identification of photoreceptor cones using multi-scale modelling and normalized cross-correlation,” in Image Analysis and Processing – ICIAP 2011, Maino G., Foresti G., eds. (Springer Berlin Heidelberg, 2011), pp. 494–503. [Google Scholar]
- 31.Loquin K., Bloch I., Nakashima K., Rossant F., Boelle P.-Y., Paques M., “Automatic photoreceptor detection in in-vivo adaptive optics retinal images: statistical validation,” in Image Analysis and Recognition, Campilho A., Kamel M., eds. (Springer Berlin Heidelberg, 2012), pp. 408–415. [Google Scholar]
- 32.Liu X., Zhang Y., Yun D., “An automated algorithm for photoreceptors counting in adaptive optics retinal images,” Proc. SPIE 8419, 84191Z (2012). 10.1117/12.975947 [DOI] [Google Scholar]
- 33.Garrioch R., Langlo C., Dubis A. M., Cooper R. F., Dubra A., Carroll J., “Repeatability of in vivo parafoveal cone density and spacing measurements,” Optom. Vis. Sci. 89(5), 632–643 (2012). 10.1097/OPX.0b013e3182540562 [DOI] [PMC free article] [PubMed] [Google Scholar]
- 34.Mohammad F., Ansari R., Wanek J., Shahidi M., “Frequency-based local content adaptive filtering algorithm for automated photoreceptor cell density quantification,” in Proceedings of IEEE International Conference on Image Processing (IEEE, 2012), pp. 2325–2328. 10.1109/ICIP.2012.6467362 [DOI] [Google Scholar]
- 35.Chiu S. J., Lokhnygina Y., Dubis A. M., Dubra A., Carroll J., Izatt J. A., Farsiu S., “Automatic cone photoreceptor segmentation using graph theory and dynamic programming,” Biomed. Opt. Express 4(6), 924–937 (2013). 10.1364/BOE.4.000924 [DOI] [PMC free article] [PubMed] [Google Scholar]
- 36.Mariotti L., Devaney N., “Performance analysis of cone detection algorithms,” J. Opt. Soc. Am. A 32(4), 497–506 (2015). 10.1364/JOSAA.32.000497 [DOI] [PubMed] [Google Scholar]
- 37.Bukowska D. M., Chew A. L., Huynh E., Kashani I., Wan S. L., Wan P. M., Chen F. K., “Semi-automated identification of cones in the human retina using circle Hough transform,” Biomed. Opt. Express 6(12), 4676–4693 (2015). 10.1364/BOE.6.004676 [DOI] [PMC free article] [PubMed] [Google Scholar]
- 38.Yellott J. I., Jr., “Spectral analysis of spatial sampling by photoreceptors: Topological disorder prevents aliasing,” Vision Res. 22(9), 1205–1210 (1982). 10.1016/0042-6989(82)90086-4 [DOI] [PubMed] [Google Scholar]
- 39.Yellott J. I., Jr., “Spectral consequences of photoreceptor sampling in the rhesus retina,” Science 221(4608), 382–385 (1983). 10.1126/science.6867716 [DOI] [PubMed] [Google Scholar]
- 40.Coletta N. J., Williams D. R., “Psychophysical estimate of extrafoveal cone spacing,” J. Opt. Soc. Am. A 4(8), 1503–1513 (1987). 10.1364/JOSAA.4.001503 [DOI] [PubMed] [Google Scholar]
- 41.Bennett A. G., Rudnicka A. R., Edgar D. F., “Improvements on Littmann’s method of determining the size of retinal features by fundus photography,” Graefes Arch. Clin. Exp. Ophthalmol. 232(6), 361–367 (1994). 10.1007/BF00175988 [DOI] [PubMed] [Google Scholar]
- 42.Cooper R. F., Langlo C. S., Dubra A., Carroll J., “Automatic detection of modal spacing (Yellott’s ring) in adaptive optics scanning light ophthalmoscope images,” Ophthalmic Physiol. Opt. 33(4), 540–549 (2013). 10.1111/opo.12070 [DOI] [PMC free article] [PubMed] [Google Scholar]
- 43.Curcio C. A., Sloan K. R., Kalina R. E., Hendrickson A. E., “Human photoreceptor topography,” J. Comp. Neurol. 292(4), 497–523 (1990). 10.1002/cne.902920402 [DOI] [PubMed] [Google Scholar]
- 44.Barber C. B., Dobkin D. P., Huhdanpaa H., “The quickhull algorithm for convex hulls,” ACM Trans. Math. Softw. 22(4), 469–483 (1996). 10.1145/235815.235821 [DOI] [Google Scholar]
- 45.Dice L. R., “Measures of the amount of ecologic association between species,” Ecology 26(3), 297–302 (1945). 10.2307/1932409 [DOI] [Google Scholar]
- 46.Sørensen T., “A method of establishing groups of equal amplitude in plant sociology based on similarity of species and its application to analyses of the vegetation on Danish commons,” Biol. Skr. 5, 1–34 (1948). [Google Scholar]
- 47.Bland J. M., Altman D. G., “Statistical methods for assessing agreement between two methods of clinical measurement,” Lancet 327(8476), 307–310 (1986). 10.1016/S0140-6736(86)90837-8 [DOI] [PubMed] [Google Scholar]
- 48.Chiu S. J., Allingham M. J., Mettu P. S., Cousins S. W., Izatt J. A., Farsiu S., “Kernel regression based segmentation of optical coherence tomography images with diabetic macular edema,” Biomed. Opt. Express 6(4), 1172–1194 (2015). 10.1364/BOE.6.001172 [DOI] [PMC free article] [PubMed] [Google Scholar]
- 49.Chiu S. J., Li X. T., Nicholas P., Toth C. A., Izatt J. A., Farsiu S., “Automatic segmentation of seven retinal layers in SDOCT images congruent with expert manual segmentation,” Opt. Express 18(18), 19413–19428 (2010). 10.1364/OE.18.019413 [DOI] [PMC free article] [PubMed] [Google Scholar]
- 50.Chiu S. J., Izatt J. A., O’Connell R. V., Winter K. P., Toth C. A., Farsiu S., “Validated automatic segmentation of AMD pathology including drusen and geographic atrophy in SD-OCT images,” Invest. Ophthalmol. Vis. Sci. 53(1), 53–61 (2012). 10.1167/iovs.11-7640 [DOI] [PubMed] [Google Scholar]


