

Abstract
STUDY QUESTION
What are the functional characteristics and transcriptional regulators of human trophoblast progenitor cells (TBPCs)?
SUMMARY ANSWER
TBPC lines established from the human smooth chorion by cell sorting for integrin α4 expressed markers of stemness and trophoblast (TB) stage-specific antigens, invaded Matrigel substrates and contributed to the cytotrophoblasts (CTBs) layer of smooth chorion explants with high-mobility group protein HMGI-C (HMGA2) and transcription factor GATA-4 (GATA4) controlling their progenitor state and TB identity.
WHAT IS KNOWN ALREADY
Previously, we reported the derivation of TBPC lines by trypsinization of colonies that formed in cultures of chorionic mesenchyme cells that were treated with an activin nodal inhibitor. Microarray analyses showed that, among integrins, α4 was most highly expressed, and identified HMGA2 and GATA4 as potential transcriptional regulators.
STUDY DESIGN, SIZE, DURATION
The aim of this study was to streamline TBPC derivation across gestation. High-cell surface expression of integrin α4 enabled the use of a fluorescence-activated cell sorter (FACS) approach for TBPC isolation from the human smooth chorion (n = 6 lines). To confirm their TBPC identity, we profiled their expression of stemness and TB markers, and growth factor receptors. At a functional level, we assayed their invasive capacity (n = 3) and tropism for the CTB layer of the smooth chorion (n = 3). At a molecular level, we studied the roles of HMGA2 and GATA4.
PARTICIPANTS/MATERIALS, SETTINGS, METHODS
Cells were enzymatically disassociated from the human smooth chorion across gestation. FACS was used to isolate the integrin α4-positive population. In total, we established six TBPC lines, two per trimester. Their identity was determined by immunolocalization of a suite of antigens. Function was assessed via Matrigel invasion and co-culture with explants of the human smooth chorion. An siRNA approach was used to down-regulate HMGA2 and GATA4 expression and the results were confirmed by immunoblotting and quantitative reverse transcription–polymerase chain reaction (qRT–PCR) analyses. The endpoints analyzed included proliferation, as determined by 5-bromo-2′-deoxyuridine (BrDU) incorporation, and the expression of stage-specific antigens and hormones, as determined by qRT–PCR and immunostaining approaches.
MAIN RESULTS AND THE ROLE OF CHANCE
As with the original cell lines, the progenitors expressed a combination of human embryonic stem cell and TB markers. Upon differentiation, they primarily formed CTBs, which were capable of Matrigel invasion. Co-culture of the cells with smooth chorion explants enabled their migration through the mesenchyme after which they intercalated within the chorionic CTB layer. Down-regulation of HMGA2 showed that this DNA-binding protein governed their self-renewal. Both HMGA2 and GATA4 had pleitropic effects on the cells' progenitor state and TB identity.
LIMITATIONS, REASONS FOR CAUTION
This study supported our hypothesis that TBPCs from the chorionic mesenchyme can contribute to the subpopulation of CTBs that reside in the smooth chorion. In the absence of in vivo data, which is difficult to obtain in humans, the results have the limitations common to all in vitro studies.
WIDER IMPLICATIONS OF THE FINDINGS
The accepted view is that progenitors reside among the villous CTB subpopulation. Here, we show that TBPCs also reside in the mesenchymal layer of the smooth chorion throughout gestation. We theorize that they can contribute to the CTB layer in this region. This phenomenon may be particularly important in pathological situations when CTBs of the smooth chorion might provide a functional reserve for CTBs of the placenta proper.
STUDY FUNDING/COMPETING INTEREST(S)
Research reported in this publication was supported by the Eunice Kennedy Shriver National Institute of Child Health and Human Development of the National Institutes of Health under award P50HD055764. O.G., N.L., K.O., A.P., T.G.-G., M.K., A.B., M.G. have nothing to disclose. S.J.F. received licensing fees and royalties from SeraCare Life Sciences for trisomic TBPC lines that were derived according to the methods described in this manuscript.
TRIAL REGISTRATION NUMBER
N/A.
Keywords: smooth chorion, trophoblast, progenitor cells, self-renewal, HMGA2, GATA4
Introduction
The human placenta has many unique and interesting properties. Among them is the requirement for explosive growth. Given its critical support role, the placenta develops in advance of the embryo/fetus. With regard to transport functions, one subpopulation of villous cytotrophoblasts (CTBs) fuses to form multinucleated syncytiotrophoblasts, (STBs), which cover the surface of the placenta where they are perfused with maternal blood. Thus, these cells are perfectly positioned for the inward transport of oxygen and the myriad other substances that are required for proper growth of the offspring and the outward transport of waste products. With regard to the architecture of the maternal-fetal interface, another subpopulation of villous CTBs invades the uterine wall, occupying the interstitial compartment of the decidua and the inner third of the myometrium. Remarkably, these cells also invade the uterine vasculature, dismantling the arterio-venous anastomoses in the basal plate, which re-routes uterine blood flow to the placenta. During the process, they go on to transform the structure of the uterine spiral arteries by aggressively replacing their endothelial linings and a portion of their muscular walls. As a result, the latter vessels attain the capacity to carry the liters of blood per minute that is required to sustain growth of the offspring.
How the placenta grows is an interesting question with many dimensions (Red-Horse et al., 2004). At the most basic level, its component cells must proliferate, a process that is most active during early pregnancy. This entails the rapid expansion of the cells that form the intrinsic vasculature, the stroma and the various trophoblast (TB) elements. Beyond sheer increases in cell numbers, a complex program of branching morphogenesis greatly expands the surface area of the placenta, a process that is critical to rapidly increasing its transport capabilities. Other cells are either born in the placenta or take up residence in this location. They include hematopoietic stem cells (Bárcena et al., 2011), which may be the source of the specialized macrophage population, termed Hoffbauer cells and progenitor cells which reside within the villous stroma (Genbacev et al., 2011). There are also notable age-related changes. These include the continued development of villi that comprise the chorion frondosum and the loss of villi from the rest of the placental surface termed the chorion leave (smooth chorion), which fuses with the amnion. How the coordinated growth of the placenta occurs in all of these regions and the possible repair mechanisms that may exist remains poorly understood.
As with the growth of other organs, the mechanisms include stem and progenitor cells. Mouse TB stem cells exist transiently in the early embryo and can be maintained as cell lines in culture (Simmons et al., 2008). Additionally, the mouse placenta appears to have populations of committed TB progenitors (Tanaka, 2006). Very recently our group derived a set of human embryonic stem cells (hESCs) from single blastomeres of 8-cell stage human embryos (Zdravkovic et al., 2015). They retained the capacity to form CTB descendants in vitro from which we established human TB stem cell lines. In addition to trophoblasts, there are several reports of placental pluripotent stem cells (PSCs) (Fukuchi et al., 2004; Yen et al., 2005; Genbacev et al., 2013). Given the methods that were used in their isolation, it is likely that they originated from the villous stroma. When expanded in culture, PSCs form mesodermal, endodermal and ectodermal derivatives (Chien et al., 2006; Portmann-Lanz et al., 2006; Battula et al., 2007; Brooke et al., 2009). However, initial attempts to differentiate these cells into TB progeny failed (Yen et al., 2005).
Recently, we reported the derivation of trophoblast progenitor cells (TBPCs) from the smooth chorion of the first trimester human placenta (Genbacev et al., 2011). They were originally identified via their co-expression of hESC and TB markers. In culture, they were biased toward CTB differentiation. Global transcriptional profiling showed that they highly expressed DNA-binding proteins that are required, in certain lineages, for maintenance of a stem cell state [high-mobility group protein HMGI-C (Hmga2); Li et al., 2007] or play a role in placental/TB development [transcription factor GATA-4 (Gata4); Bai et al., 2013]. Here, we report the results of additional experiments in which we optimized the derivation protocol by exploiting their high-cell surface expression of integrin α4, which enabled the use of a fluorescence-activated cell sorter (FACS) approach for their isolation. They retained the properties of the original lines in terms of the repertoire of stage-specific antigens that they expressed in undifferentiated and differentiated states. We went on to demonstrate their functional capacity in terms of forming chorionic CTBs. We also showed that HMGA2 plays a role in their self-renewal. Both HMGA2 and GATA4 had pleiotropic effects on the cells progenitor state and TB identity, which manifested as both increases and decreases in the expression of the markers that we analyzed, including placental hormones. Thus, this work expands our knowledge of the functional capacity and nature of these cells.
Materials and Methods
Ethical approval
Written informed consents were obtained from all subjects recruited for placenta and chorionic membrane collection. The University of California, San Francisco Committee on Human Research approved this study and the samples were obtained with written informed consent (study number 11-05530).
Enzymatic digestion
TBPCs were isolated from human chorionic membranes obtained at 7, 8.2 (first trimester), 15.6, 21.6 (second trimester) and 38 (term) weeks of gestation by using a modified procedure that was based on the method we previously published (Genbacev et al., 2011). At collection, the extra-embryonic membranes were rinsed in the cold Dulbecco's Modified Eagle Medium (DMEM) /H-21 medium (GIBCO, USA) supplemented with 2.5% (v/v) fetal bovine serum (FBS, HyClone, USA), 1% Glutamine Plus (Atlanta Biologicals, USA), 1% (w/v) penicillin/streptomycin (Invitrogen, USA) and 0.1% (w/v) gentamycin (Invitrogen). For first trimester samples, the chorion was separated from floating/anchoring villi, minced into 3–4 mm pieces and centrifuged (135g) to pellet tissue fragments. After fusion of the amnion and chorion (e.g. second trimester and term samples), the two layers were separated prior to mincing. Cells were isolated from the chorion by a series of enzymatic dissociation steps. First, chorionic CTBs were removed by treatment with a mixture of collagenase [0.062% (w/v); Sigma, USA], DNase [0.040% (w/v); Sigma], hyaluronidase [0.69% (w/v); Sigma] and bovine serum albumin (BSA) [0.1% (w/v); Sigma] in sterile phosphate buffered saline (PBS) at 37°C for 6–8 min. Cold DMEM-F12 supplemented with 10% (v/v) FBS was added to stop the enzymatic reaction. The tissue pieces were allowed to settle by gravity before the CTBs and tissue debris in the liquid phase were decanted. The remaining tissue fragments were incubated with a mixture of trypsin [0.0069% (w/v); Sigma], DNAse [0.040% (w/v); Sigma] and EDTA [0.02% (w/v); Sigma] in PBS for 15 min. Dissociated cells were filtered through a cell strainer (100 µm) and the remaining tissue pieces were incubated for a second time with the same enzyme solution for 35 min. The two cell fractions were combined, washed three times in PBS (Ca++/Mg++ free) containing 0.5% BSA (Invitrogen A10008-01) and filtered through cell-strainer caps (Falcon 352235) to obtain a single-cell suspension.
Cell sorting
Single-cell suspensions obtained from enzymatic digestions of chorionic tissues were pelleted by centrifugation at 900g for 10 min at 4°C, resuspended in FACS blocking buffer [PBS supplemented with 5% (v/v) mouse serum], and incubated for 15 min on ice. Then the cells were incubated for 30 min in the dark at 4°C with fluorochrome-conjugated primary antibodies against CD45 conjugated with fluorescein isothiocyanate (clone HI30, BioLegend, USA) and CD49d (integrin α4) conjugated with anti-CD45 (APC; clone 9F10, BioLegend), following manufacturer's recommendations. Cells were washed three times in FACS washing buffer [PBS supplemented with 0.5% (w/v) BSA] and resuspended in washing buffer containing 1 μg/ml propidium iodide (Invitrogen). Cells were passed through cell-strainer caps (Falcon 352235 5 ml tube, BD Biosciences, USA) to obtain a single cell suspension before sorting by using a FACS Aria II cell sorter (BD Biosciences). A gate was set to collect live cells (propidium iodide negative) and exclude debris and non-viable cells. High-purity CD49d+CD45− cells were collected into a 5 ml tube containing 1 ml of TBPC culture medium (see below). FACS data were analyzed by using the FlowJo software (Tree Star, Inc., USA).
Progenitor cell culture
TBPCs were cultured in six-well tissue culture plates that had been incubated with 0.5% gelatin for 30 min. They were allowed to reach 80–90% confluence before passaging. Cells were maintained at 37°C, 5% CO2, 95% air, in medium containing DMEM/F12 (Life Technologies, USA; 10565042), 10% FBS (Life Technologies; 10099141), 10 ng/ml fibroblast growth factor 2 (FGF-2; R&D Systems, USA; 233-FB-025), 10 µM SB 431542 (Tocris, UK; 1614) and 1% (w/v) penicillin/streptomycin (UCSF Cell Culture Facility). For passaging, cells were detached via accutase (#07920, StemCell Technologies, BC) treatment for 3 min and counted by using a hemacytometer. They were replated at 250 000 cells/well. CTBs were cultured as described (Hunkapiller and Fisher, 2008).
Flow cytometry
Cultured cells were washed with PBS and dissociated by treating with accutase (3 min), which yielded single-cell suspensions. Then cells were resuspended in FACS blocking buffer, pelleted, resuspended in FACS washing buffer and counted. Next, they were fixed and permeablized for flow cytometry by using Life Technologies Fix & Perm kit (GAS003) in accordance with the manufacturer's instructions. Cells were analyzed by using a BD LSR flow cytometer and data analysis was performed using the FlowJo software. As for negative controls, cells were immunostained with saturating amounts of isotype matched control antibodies directly conjugated with the same fluorochrome as the experimental antibodies served. Autofluorescence, which was observed in all the channels, was accounted for by adjusting the voltage of the different photomultiplier tubes using unstained cells prior to running compensation controls and cells stained with isotype-matched antibodies. These experiments were performed at least three times.
Immunostaining
Tissue sections
Chorionic membranes were fixed in 3% paraformaldehyde (PFA) for 30 min, washed three times in PBS, infiltrated with 5–15% sucrose followed by Optimal Cutting Temperature compound (Miles Scientific, USA) and frozen in liquid nitrogen. Sections (∼15 µm) were cut on a Leica cryostat and mounted on glass slides. They were rehydrated in PBS for 20 min and non-specific reactivity was blocked by incubation in 3% BSA/0.1% Tween 20 (Fisher Scientific) at room temperature for 30 min. The sections were incubated at 37°C for 1 h with primary antibodies (see Table I for antibody concentrations) diluted in blocking buffer. Then they were washed three times with PBS before they were incubated for 30 min at 37°C with species-specific AlexaFluor-conjugated secondary antibodies diluted in blocking buffer. Finally, they were washed three times in PBS. The Vectashield mounting medium with 4′,6-diamidino-2-phenylindole (DAPI; Vector Laboratories, USA) was used to visualize nuclei. The negative control for assessing background staining was omission of the primary antibody and addition of the secondary antibody. At the secondary antibody concentration used, autofluorescence was negligible. The tissue sections were examined by using a Leica DM5000 B microscope. Images were overlaid by using Photoshop. We immunostained two first trimester (7 and 8.2 weeks of gestation), two second trimester (15.6 and 21.6 weeks of gestation) and one term (38 weeks of gestation) specimens to assess the integrin α4 expression pattern.
Table I.
Antibodies (immunocyto/histochemistry).
| Antibody | Catalog number/clone | Source | Concentration (μg/ml) |
|---|---|---|---|
| ITGA4 | NBP1-77333 | Novus Biologicals | 10 |
| CK7 | 7D3 | Damsky et al. (1992) | 26 |
| OCT4 | H-134 | Santa Cruz Biotechnology | 2 |
| SOX2 | AF2018 | R&D Systems | 2 |
| HMGA2 | AF3184 | R&D Systems | 2 |
| GATA4 | AF2606 | R&D Systems | 2 |
| NR2F2 | ab41859 | Abcam | 10 |
| EGFR | GTX10044 | Genetex | 10 |
| LIF-R | AF250 | R&D Systems | 2 |
| GCM1 | ab26137-50 | Abcam | 5 |
| ELF5 | sc-166652 | Santa Cruz Biotechnology | 2 |
| EOMES | PAB-11141 | Allele | 7 |
| ZO-1 | 339111 | Life Technologies | 10 |
| GATA3 | AF2605 | R&D Systems | 2 |
| hPL | MCA331 | Serotec | 50 |
| HLA-G | 4H84 | McMaster et al. (1998) | 20 |
| Anti-rabbit secondary Ab | A21206 | Life Technologies | 2 |
| Anti-goat secondary Ab | A11055 | Life Technologies | 2 |
| Anti-mouse secondary Ab | A21907 | Life Technologies | 2 |
| Anti-rat secondary Ab | 712-025-153 | Jackson Immuno | 15 |
ITGA4, integrin α4; CK7, keratin-7; OCT4, octamer-binding transcription factor 4; SOX2, SRY (sex-determining region Y)-box 2; HMGA2, high-mobility group protein HMGI-C; GATA4, transcription factor GATA-4; NR2F2, COUP transcription factor 2; EGFR, epidermal growth factor receptor; LIF-R, leukemia inhibitory factor receptor; GCM1, chorion-specific transcription factor CMa; ELF5, ETS-related transcription factor Elf-5; EOMES, eomesodermin homolog; ZO-1, tight junction-associated protein; GATA3, trans-acting T-cell-specific transcription factor GATA-3; hPL, human placental lactogen; HLA-G, histocompatibility antigen, class I, G.
Cultured cells
TBPCs plated on coverslips coated with 0.5% gelatin (see above) were fixed with 3% PFA for 20 min, washed with PBS, permeabilized by treatment for 5 min with cold methanol, rinsed in PBS and incubated overnight at 4°C with primary antibodies (see Table I for antibody concentrations) diluted in PBS containing 1% BSA. Then the cells were washed three times in PBS, incubated for 45 min at room temperature with species-specific AlexaFluor-conjugated secondary antibodies and washed another three times with PBS. The Vectashield mounting medium with DAPI (Vector Laboratories) was used to visualize nuclei. The cells were examined and the images were processed as described above. Experiments were done at least three times.
Invasion assay
Cell invasion was quantified by using Transwell polycarbonate inserts (6.5 mm) with 8-µm pores that were coated with 10 µl of undiluted Matrigel (growth factor-containing, Corning Corp, USA). The invasive capacity of one cell line from each trimester (8.2-, 15.6- and 38-week gestation) was tested in triplicate at passages 6, 12 and 18. Undifferentiated TBPCs were dissociated to single cells as described above. TBPCs were suspended in differentiation medium containing DMEM/F12 supplemented with 10% FBS, 10 ng/ml fibroblast growth factor 4 (FGF-4; R&D Systems; 235-F4-025/CF) and 40 ng/ml epidermal growth factor (EGF; R&D Systems; 259-HE-050/CF) and plated at a density of 10 000 cells per insert (Genbacev et al., 2011). After 12 h of culture, the inserts were washed with PBS and fixed for 20 min in 3% PFA. They were stored at 4°C in PBS or immediately immunostained as described above to detect cytokeratin 7 (CK7) expression. After staining, the membrane inserts were removed with surgical scissors and mounted on slides with the underside of the membrane facing up. They were coverslipped and imaged as described above for cultured cells. Cells that reached the underside of the membrane were enumerated. The entire experiment was repeated three times
Co-culture of TBPCs and smooth chorion explants
TBPCs that were established from a 15.6-week placenta were labeled with green fluorescent protein (GFP). Briefly, 1 million TBPCs were plated on the gelatin-coated wells of a six-well plate. Then they were transduced (300 multiplicity of infection) with a GFP-expressing adenovirus under the control of a cytomegalovirus promoter (Vector Bio Labs, USA). After 12 h, ∼85–90% of cells were GFP positive. With regard to chorionic membrane explants, 100–200 mm pieces of the smooth chorion at 16 weeks were carefully lowered on top of the TBPCs (3–5 per well) such that the mesoderm was in direct contact with the cells. The explants were fixed after 6, 16 and 24 h, sectioned and co-stained with anti-CK7 to identify CTBs. The entire experiment was repeated four times.
Down-regulation of gene expression
TBPCs were plated at a density of 250 000 cells per well of a six-well plate. Four h after plating, cells were transfected using Dharmafect I transfection reagent (Thermo Scientific) at an siRNA concentration of 50 nM according to the manufacturer's protocol. Control siRNA (D-001810-10-05), siGATA4 (L-008244-00-0010) or siHMGA2 (L-013495-00-0005) were purchased from Thermo Scientific. After 16 h, the medium was changed. The cells were harvested and protein or RNA was extracted 48 or 72 h after transfection. To determine cell numbers, cells were detached using accutase and counted using a hemacytometer. The experiment was repeated three times.
Immunoblotting
Cells were lysed using M-PER protein extraction reagent (Thermo Scientific) containing a protease inhibitor cocktail (AEBSF, aprotinin, bestatin, E-64, leupeptin and pepstatin A) (Thermo Scientific). Up to 50 μg of protein was separated on 4–12% Bis–Tris gels (Life Technologies) and transferred to nitrocellulose membranes (Bio-Rad, USA). Non-specific immunoreactivity was blocked by incubation of the membranes for 1 h at room temperature in a solution of tris-buffered saline (TBS), 0.1% (v/v) Tween 20 (TBS-T) and 5% (w/v) non-fat dry milk. The next step was overnight incubation at 4°C with a primary antibody diluted in the blocking buffer (see Table II). The membranes were washed with TBS-T and incubated for 1 h at room temperature with the appropriate species-specific horse radish peroxidase-conjugated secondary antibodies diluted in blocking buffer. Membranes were incubated in chemiluminescence substrate (Thermo Scientific) and antibody binding was detected by enhanced chemiluminescence (GE Healthcare, UK). Samples from at least three experiments were analyzed.
Table II.
Taqman primers.
| Gene | Taqman primer |
|---|---|
| HMGA2 | Hs00971725_m1 |
| GATA4 | Hs00171403_m1 |
| OCT4 | Hs00999632_g1 |
| SOX2 | Hs01053049_s1 |
| NR2F2 | Hs00819630_m1 |
| ELF5 | Hs01063022_m1 |
| GATA3 | Hs00231122_m1 |
| HCS | Hs01862611_m1 |
| CGB | Hs00361224_gH |
| GAPDH | 4333764-1007034 |
Quantitative reverse transcription–polymerase chain reaction
TBPCs were cultured for 3 days. Then RNA was purified by using an RNEasy Mini kit (Qiagen, USA, 74104) and quantified by using a NanoDrop spectrophotometer (Thermo Scientific). The quantitative reverse transcription–polymerase chain reaction (qRT–PCR) methods that we use have been published (Winn et al., 2007). RNA (500 ng) was converted to cDNA using an iScript cDNA Synthesis Kit (Bio-Rad, 170-8890). qRT–PCR was carried out in triplicates by using TaqMan 2X Universal Master Mix II (Life Technologies, 4440040) and TaqMan primers (see Table III). Gene expression levels were normalized relative to glyceraldehyde 3-phosphate dehdrogenase (GAPDH). Briefly, the GAPDH CT values obtained from three replicates were averaged and used to calculate the 2−ΔΔCT for each replicate value of gene expression in the experimental siRNA treated cells relative to gene expression in the control siRNA-treated cells. The variance was estimated as the standard deviation from three independent experiments.
Table III.
Antibodies (immunoblot).
| Antibody | Catalog number/clone | Source | Concentration (μg/ml) |
|---|---|---|---|
| HMGA2 | AF3184 | R&D Systems | 2 |
| GATA4 | AF2606 | R&D Systems | 2 |
| Cyclin A | Sc-751 | Santa Cruz Biotechnology | 2 |
| Cyclin B | 610219 | BD Biosciences | 2.5 |
| Actin | A3854 | Sigma | 0.06 |
| Cdk4 | Sc-260 | Santa Cruz Biotechnology | 2 |
| Cdk6 | Sc-177 | Santa Cruz Biotechnology | 2 |
| Anti-goat secondary Ab | 705-035-147 | Jackson Immuno | 0.16 |
| Anti-rabbit secondary Ab | 111-035-144 | Jackson Immuno | 0.16 |
| Anti-mouse secondary Ab | 111-005-003 | Jackson Immuno | 0.48 |
HMGA2, high-mobility group protein HMGI-C; GATA4, transcription factor GATA-4.
TUNEL staining
Cell death was assessed in transfected 15.6-week TBPCs. Briefly, untransfected or transfected cells 48 h post-transfection were fixed on coverslips as described above, and were assayed for apoptosis using Roche In situ Cell Death Detection Kit (12156792910, USA) according to manufacturer's protocol. DNAse I treatment of fixed untransfected cells was used as a positive control.
Brdu incorporation
Cell proliferation of TBPCs established from a 15.6-week placenta was measured by using a BrDU ELISA kit (ab126556, Abcam, UK). Briefly, at varying times following transfection, the cells were disassociated with accutase and 20 000 were plated in 96-well plates (n = 3 well per experimental condition). Cells were allowed to attach for 12 h, pulsed with BrDU for 2 h and fixed and permeabilized to denature the DNA. Samples harvested at different times were processed together according to the manufacturer's protocol. The entire experiment was repeated twice.
Statistical analyses
Data were calculated as the mean ± SD. The significance was evaluated using a paired Student's t-test and P-values ≤0.05 were considered statistically significant.
Results
TBPC isolation via integrin α4 expression
Our initial description of TBPCs compared the transcriptome of these cells with that of freshly isolated first trimester primary CTBs (Genbacev et al., 2011). As the first step in this study, we compiled the integrin data from this analysis. The results are shown in Fig. 1A. In TBPCs versus CTBs, integrin α4 was the most highly differentially expressed cell adhesion molecule of this class. To confirm this result, we immunostained tissue sections of the human smooth chorion during the first trimester with antibodies that recognize either integrin α4 or CK7, a TB marker. Adhesion molecule expression was primarily associated with CK negative cells underlying chorionic CTBs (Fig. 1B). In additional experiments, we asked whether enzyme dissociation of cells from the smooth chorion yielded an integrin α4-expressing population that lacked cell surface CD-45, which marks cells of the hematopoietic lineage. As shown in Fig. 2A, over 7% of cells isolated from a 15.6-week sample had this phenotype. The yield was 8.5% ± 1.29% and there was no correlation with gestational age. These data confirmed the results of the transcriptional profiling experiments.
Figure 1.
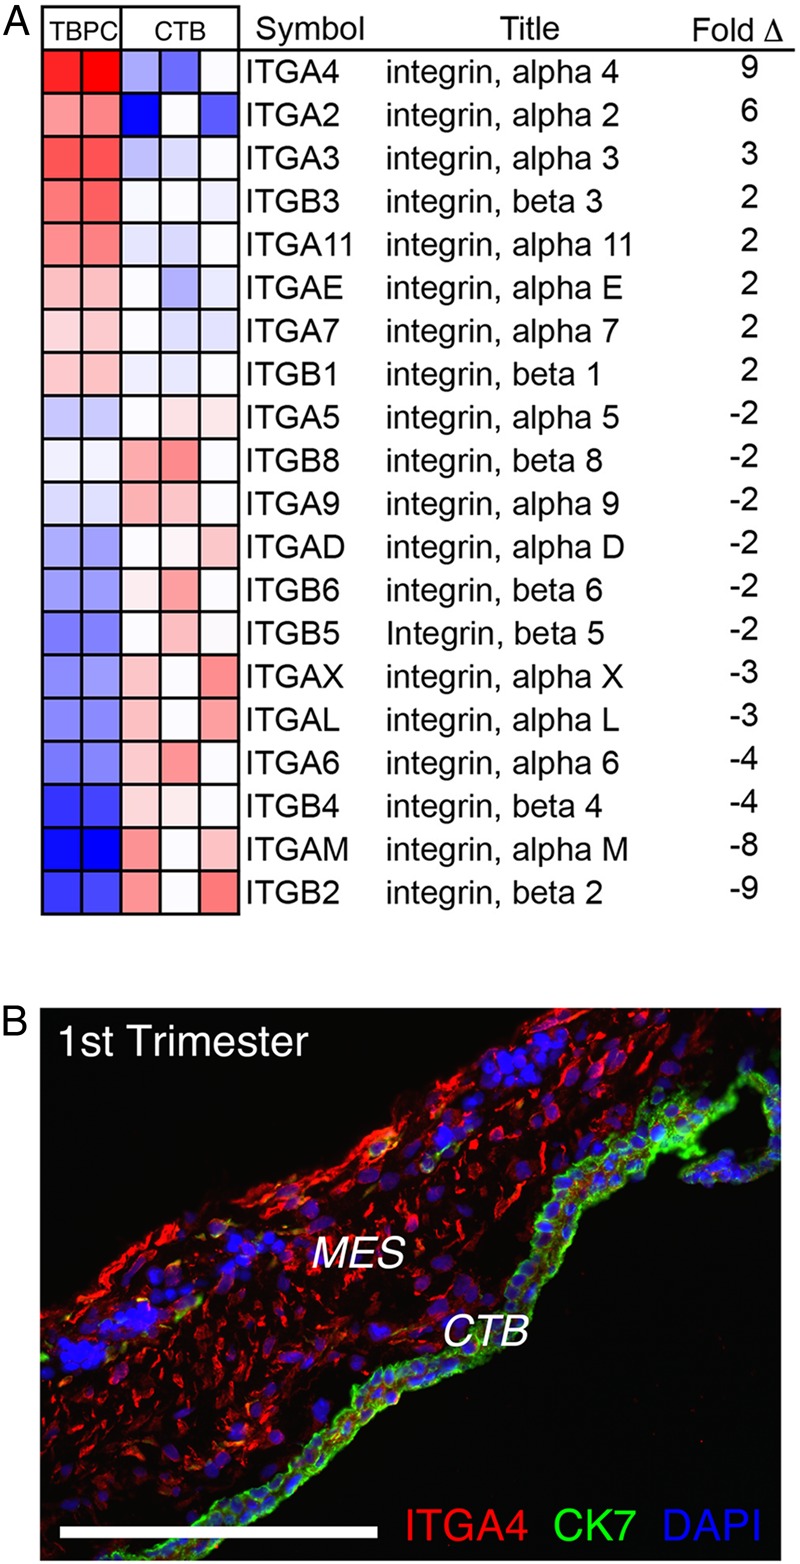
Trophoblast progenitor cells (TBPCs) highly expressed integrin α4 in vitro and in situ. (A) Microarray analyses enabled a comparison of the integrin expression profiles of TBPCs and primary cytotrophoblasts (CTBs). Integrin α4 was the most highly differentially expressed cell-extracellular matrix receptor in this class. (B) Immunostaining tissue sections of the smooth chorion during the first trimester of pregnancy (8 weeks) showed that cells expressing integrin α4 resided in the mesenchymal (MES) compartment, underlying the CTBs. Bar = 200 µm; 77 × 142 mm (300 × 300 DPI).
Figure 2.

Direct isolation of trophoblast progenitor cells (TBPCs) via their integrin α4 expression. (A) Approximately 7% of the cells disassociated from the smooth chorion at 15.6 weeks expressed integrin α4. (B) A fluorescence activated cell sorter (FACS) approach enabled the isolation of integrin α4+, CD45− cells from the first and second trimester as well as term samples. (C) Immunolocalization showed that after a minimum of 12 passages, they continued to exhibit cell surface expression of this molecule. Bar = 100 µm; 304 × 430 mm (300 × 300 DPI).
The findings also suggested that TBPCs could be directly isolated from the mixed population of cells that comprise the smooth chorion by virtue of their integrin α4 expression. To test this theory, we used FACS to enrich the integrin α4+, CD45− cells that were enzymatically released from the first and second trimester as well as term samples. The results are shown in Fig. 2B. Cells with nearly an identical α4+, CD45− expression profile were isolated from samples obtained during each trimester. After a minimum of 12 passages, immunolocalization showed that the lines retained the original α4+ phenotype of the cells from which they were established (Fig. 2C). Thus, we used an integrin-based strategy to directly isolate TBPCs from the smooth chorion.
Phenotypic analyses of the TBPCs and their invasive progeny
Next, we used an immunolocalization approach to assess the lines' expression of stem cell and TB markers, and growth factor receptors. In these experiments, we analyzed the cell lines that were established from the first and second trimester as well as term placentas (see Fig. 2C). No major gestation-related differences were observed. They expressed CK7 as do primary CTBs. Interestingly, they also immunostained, in a nuclear pattern, for the stem cell markers, octamer-binding transcription factor 4 (OCT4) and SRY (sex-determining region Y)-box 2 (SOX2; Fig. 3A). Further analyses detected nuclear expression of transcription factors that our previous work suggested were expressed by TBPCs–HMGA2, GATA4 and NR2F2, (Fig. 3B; Genbacev et al., 2011). They also immunostained for molecules that play important roles in TB identity and/or are uniquely expressed by these cells (Fig. 3C). This category included transcription factors that are required for correct placental development in mice (GCM1, ELF5, Eomes and GATA3), the hormone, hPL and ZO1, which has been implicated in human TB differentiation (Pidoux et al., 2010). Interestingly, they expressed receptors for growth factors that could play a role in self-renewal (EGFR and LIFR, Fig. 3D).
Figure 3.

An immunostaining approach enabled a phenotypic analysis of trophoblast progenitor cells (TBPCs) that were isolated from the first trimester, second trimester and term placentas. Five cell lines were analyzed: two were established from first-trimester placentas (7 and 8.2 weeks), two were from second-trimester placentas (15.6 and 21.6 weeks) and one was from a term placenta (38 weeks). The data shown are from the lines that were derived at 8.2, 15.6 and 38 weeks. (A) The TBPCs expressed CK7 and the stem cell markers, octamer-binding transcription factor 4 (OCT4) and SRY (sex-determining region Y)-box 2 (SOX2). (B) They also immunostained for high-mobility group protein HMGI-C (HMGA2), transcription factor GATA-4 (GATA4) and COUP transcription factor 2 (NR2F2), transcription factors that our previous work suggested they expressed in the progenitor state. (C) The cells also immunostained for molecules that play important roles in trophoblast identity and/or are uniquely expressed by these cells. This category included transcription factors that are required for correct placental development in mice [chorion-specific transcription factor CMa (GCM1), ETS-related transcription factor Elf-5 (ELF5), eomesodermin homolog (Eomes), trans-acting T-cell-specific transcription factor GATA-3 (GATA3)], the hormone, human chorionic somatomammotropin (HCS), and tight junction-associated protein (ZO1), which has been implicated in human TB differentiation. (D) They also expressed receptors for growth factors that could play a role in self-renewal [epidermal growth factor (EGFR) and leukemia inhibitory factor (LIFR)]. Bar = 100 μm; 423 × 423 mm (300 × 300 DPI).
Plating the cells on Matrigel-coated filters in differentiation medium triggered assumption of an invasive fate. The cells penetrated the substrate and emerged on the underside of the filters within 12 h of plating. Approximately the same percentage of plated cells exhibited this behavior regardless of the gestational age of the smooth chorion samples from which they were isolated (Fig. 4A). During this process, they up-regulated expression of the TB major histocompatibility class I molecule, HLA-G (Fig. 4B), which uniquely defines the invasive CTB subpopulation (McMaster et al., 1998).
Figure 4.

Trophoblast progenitor cells (TBPCs) primarily differentiated into invasive cytotrophoblasts (CTBs). The cells were plated on Matrigel-coated filters in differentiation medium that contained epidermal growth factor (EGF). (A) The first wave of cells penetrated the substrate and emerged on the underside of the filters within 12 h of plating, when invasion was quantified. TBPC invasiveness was not dependent on the gestational age of the sample from which the line was established. (B) By 48 h in culture, invasive cells that reached the underside of the filter immunostained for histocompatibility antigen, class I, G (HLA-G), a feature of invasive extravillous CTBs in situ. Bar = 100 μm; 67 × 13 mm (300 × 300 DPI).
TBPCs can contribute to the CTB layer of the smooth chorion
As a functional test of their potential, we were interested in the cells' interactions with the smooth chorion. For these experiments, undifferentiated TBPCs were transduced with an adenoviral vector that expressed GFP. Approximately 85–90% of the cells were labeled (Fig. 5A). Next, we separated the amniotic from the chorionic portion of the fetal membranes by bisecting the layers at the level of their shared mesenchyme. We transferred 100–200 mm pieces of the smooth chorion to TBPC monolayers with the mesenchymal side facing downward. At various intervals after plating, the co-cultures were fixed, sectioned, immunostained with anti-CK and imaged. In these experiments, the intensity of the GFP signal obliterated the TBPC CK staining pattern. By 16 h, GFP-expressing cells had entered the chorionic mesenchyme (Fig. 5B). Ultimately, they intercalated in the CTB layer (Fig. 5C). The results of these experiments suggested that TBPCs can contribute to the CTB layer of the smooth chorion.
Figure 5.

Trophoblast progenitor cells (TBPCs) contributed to the cytotrophoblast layer of the smooth chorion. (A) TBPCs were transduced with an adenoviral vector that expressed green fluorescent protein (GFP). Approximately 85–90% of the cells were labeled. (B) Monolayers of GFP-expressing TBPCs were overlaid, mesenchymal surface facing downward, with 100–200 mm pieces of the smooth chorion. By 16 h, GFP-expressing cells entered the chorionic mesenchyme. (C) By 24 h, the cells intercalated within the cytotrophoblast (CTB) layer, suggesting that TBPCs can contribute to this layer of the smooth chorion. Bar = 100 μm; 53 × 13 mm (300 × 300 DPI).
HMGA2 regulates TBPC self-renewal and their transcriptional landscape
Our previous work showed that HMGA2 was the second most highly differentially expressed mRNA in progenitors when compared with primary CTBs (Genbacev et al., 2011). Thus, we hypothesized that this protein, which plays a large role in governing DNA architecture (Reeves and Beckerbauer, 2001), has important functions in these cells. To investigate what these might be we used an siRNA approach. TBPCs were transfected with an siRNA that specifically targeted HMGA2 or, as a control, a non-targeting control siRNA. After 72 h, HMGA2 mRNA levels in experimental TBPCs decreased by ∼80% when compared with controls (Fig. 6A). To determine whether protein levels were similarly affected, lysates from the cells were immunoblotted with anti-HMGA2 at 48 and 72 h post transfection with actin abundance serving as a loading control. An even more significant down-regulation of expression was observed (Fig. 6B). Thus, we concluded that the siRNA strategy we used for down-regulating HMGA2 expression was effective.
Figure 6.

High-mobility group protein HMGI-C (HMGA2) regulates trophoblast progenitor cell (TBPC) self-renewal. (A) TBPCs were transfected with an siRNA that specifically targeted HMGA2 or, as a control, a scrambled version of this sequence. After 72 h, quantitative reverse transcription–polymerase chain reaction (qRT–PCR) showed that HMGA2 mRNA levels in experimental TBPCs decreased by ∼80% when compared with controls. (B) Immunoblotting showed that protein levels were even more dramatically affected. (C) Down-regulation of HMGA2 was associated with a >50% decrease in cell numbers (D), which was not due to apoptosis as determined by TUNEL. (E) The fact that the cultures contained fewer cells was attributable to a decrease in their replication rate as shown by highly significant reductions in their 5-bromo-2’-deoxyuridine (BrdU) incorporation from 48 h onward. (F) In the absence of HMGA2, expression of cyclins A and B was decreased, explaining, in part, the observed reduction in cell numbers and lower mitotic rate. Bar = 100 µm. *P-value ≤0.05; 190 × 190 mm (300 × 300 DPI).
During the initial phase of this study, we had the impression that the experimental cultures contained fewer cells than the controls. Thus, it seemed likely that one aspect of HMGA2 function involved TBPC self-renewal. To test this theory, we counted the number of cells in cultures that were transfected with either the control siRNA or the siRNA that down-regulated HMGA2 expression 12 h after the start of the experiment. The results suggested that the experimental cultures contained ∼60% fewer cells (Fig. 6C). This was not due to apoptosis as negligible programmed cell death, demonstrated by terminal deoxynucleotidyl transferase dUTP nick end labeling (TUNEL) staining, was observed under both conditions (Fig. 6D). To determine the impact on DNA synthesis we monitored BrdU incorporation from 24–72 h post-transfection. The results are shown in Fig. 6E. Nearly all the control cells incorporated BrdU. HMGA2 down-regulation resulted in a steady decline in incorporation, which neared zero by the end of the experiment. The same results were obtained when cell lines established from a 7- and a 20-week placenta were analyzed (Supplementary data, Fig. S1). Finally, we asked which portion of the cell cycle was affected. By 72 h, we observed marked decreases in cyclins A and B expression in the experimental cultures when compared with the controls, with no differences in the levels of Cdk6 and -4 (Fig. 6F). This finding suggested a block at S phase of the cell cycle rather than the G1/S transition as is most commonly observed in stem/progenitor populations with self-renewal defects (Venkatesan et al., 2012). Thus, one of HMGA2's functions in TBPCs is promoting proliferation in an undifferentiated state.
We were also interested in determining the effects of HMGA2 down-regulation on the expression of a subset of the stage-specific antigens that the cells expressed at the mRNA level. The results are shown in Fig. 7A. With regard to stem cell markers, expression of OCT4 slightly increased while SOX2 decreased. Likewise, expression of one of the TB progenitor markers increased (NR2F2) and the other decreased (GATA4). With regard to TB markers, ELF5 expression was the most significantly affected, decreasing to undetectable levels (at mRNA and protein levels, Fig. 7B). GATA3 and HCS mRNA expression also diminished. Conversely, CGB expression increased ∼3-fold. Despite these changes, the cells continued to uniformly express integrin α4 (Fig. 7B). Thus, we concluded that HMGA2, a DNA-binding protein, has pleitropic effects on the cells progenitor state and TB identity, which manifested as both increases and decreases in the expression of the markers that we analyzed.
Figure 7.

High-mobility group protein HMGI-C (HMGA2) regulates the trophoblast progenitor cell (TBPC) transcriptional landscape and hormone production. (A) qRT–PCR showed that siRNA mediated down-regulation of HMGA2 modulated the expression of a stemness marker [SRY (sex-determining region Y)-box 2, SOX2], TBPC stage-specific antigens [transcription factor GATA-4 (GATA4) and COUP transcription factor 2 (NR2F2)] and trophoblast markers [ETS-related transcription factor Elf-5 (ELF5), transcription factor GATA-3 (GATA3)], which included placental hormones [human chorionic somatomammotropin (HCS) and chorionic gonadotropin β (CGB)]. (B) immunolocalization confirmed a very significant down-regulation of ELF5 expression while staining for integrin α4 was unchanged. Bar = 100 µm. *P-value ≤ 0.05; 131 × 117 mm (300 × 300 DPI).
GATA4 functions overlap and complement those of HMGA2
With regard to transcription factors, we explored the role of GATA4, also highly expressed by TBPCs, by using an siRNA approach. At the mRNA level, expression was down-regulated at 72 h by ∼80% (Fig. 8A) with protein expression at or near undetectable levels at both 48 and 72 h (Fig. 8B). Unlike HMGA2, the loss of GATA4 expression did not impact proliferation as control and experimental wells contained equal numbers of cells 72 h after transfection (Fig. 8C).
Figure 8.

Transcription factor GATA-4 (GATA4) functions overlap and complement those of high-mobility group protein HMGI-C (HMGA2) (A) In trophoblast progenitor cells (TBPCs), a GATA4-specific siRNA, down-regulated the mRNA encoding this molecule by ∼80%. (B) Protein expression was at or near undetectable levels at 48 and 72 h. (C) The loss of GATA4 expression did not impact proliferation as control and experimental wells contained equal number of cells 72 h after transfection. (D) Quantitative reverse transcription–polymerase chain reaction (qRT–PCR) showed that siRNA mediated down-regulation of GATA4 modulated the expression of a stemness marker [SRY (sex-determining region Y)-box 2 (SOX2), trophoblast progenitor stage-specific antigens (HMGA2 and COUP transcription factor 2 (NR2F2)], a trophoblast marker [ETS-related transcription factor Elf-5 (ELF5)] and the cells' production of placental hormones [human chorionic somatomammotropin (HCS) and chorionic gonadotropin beta (CGB)]. (E) immunolocalization confirmed a very significant down-regulation of ELF5 expression while staining for integrin α4 was unchanged. Bar = 100 µm. *P-value ≤0.05; 170 × 197 mm (300 × 300 DPI).
Finally, we compared the effects of down-regulating GATA4 expression with the loss of HMGA2 using the same panel of stem cell and TB markers (Fig. 8D). OCT4 levels did not change. Again SOX2 was significantly reduced, but to a lesser extent than was observed with HMGA2 down-regulation. The two regulators appeared to have reciprocal interactions as the loss of GATA4 decreased HMGA2 expression, although the effects were less pronounced than those of HMGA2 on GATA4 mRNA levels. As with HMGA2 down-regulation, ELF5 expression decreased to the greatest extent (at mRNA and protein levels, Fig. 8E). In contrast, GATA3 was unaffected. With regard to the mRNAs encoding placental hormones, HCS was significantly decreased with no observed effects on CGB. Integrin α4 expression was unaffected (Fig. 8E). Thus, HMGA2 and GATA4 appeared to have sets of overlapping and distinct functions in TBPCs.
Discussion
Here, we described the results of experiments in which we optimized TBPC isolation by using a FACS approach as a one-step method for obtaining these cells (from first trimester, second trimester and term placentas) by virtue of their cell surface expression of integrin α4. Our original microarray characterization of TBPCs revealed this adhesion molecule as the most highly expressed in its class (Genbacev et al., 2011), making it a prime candidate for a cell sorting-based isolation method. Integrin α4 is unusual in its ability to mediate cell–cell interactions, via binding to vascular cell adhesion molecule-1, and cell–matrix interactions, by binding to fibronectin (Mould et al., 1994). It is postulated to play a key role in maintenance of the stem/progenitor cell state by mediating adherence within the niche (Miyake et al., 1991; Priestley et al., 2006). On the other hand, integrin α4 is expressed by highly motile cell types such as neural crest derivatives and most leukocytes (Kil et al., 1998; Hammond et al., 2014), and its up-regulation correlates with tumor cell invasiveness and metastatic potential (Bao et al., 1993). Therefore, it is not surprising that this integrin is expressed by villous and invasive CTBs (Zhou et al., 1997). Interestingly, integrin α4 is also one of the targets of Gcm1 (Schubert et al., 2008), a transcription factor that is required for STB formation (Anson-Cartwright et al., 2000). As to functions, Cartwright and Balarajah (2005) investigated adhesion of the SGHPL-4 cell line, which was derived from first-trimester extravillous trophoblasts, to endothelial cells. This interaction was inhibited by function perturbing antibodies to either VCAM-1 or integrin α4, which suggests that that these molecules play a role in TB interactions with blood vessels. Here, we used an immunolocalization approach to confirm the microarray results that suggested integrin α4 is expressed by TBPCs and showed that the first trimester smooth chorion contains a resident population of these cells (Fig. 1B).
The new TBPC isolation method has several advantages and applications. For example, this protocol, when compared with the isolation of primary cells, is relatively simple and reproducible. Additionally, the smooth chorion is a rich source of TBPCs that can be propagated and differentiated into extravillous, invasive CTBs that are difficult to obtain by other means. Thus, they can be used for various purposes such as to study factors that regulate the transition from progenitors to terminally differentiated invasive CTBs and the component steps in this process. It will also be interesting to learn more about the balance of factors in the TBPC niche that enables replication in an undifferentiated state and the eventual release of these cells, which we show can contribute to the chorionic layer of CTBs.
As we previously reported, the TBPCs expressed a combination of hESC markers of pluripotency and molecules that play important functions in trophoblasts (Fig. 3). We also verified, by using an immunolocalization approach, their expression of growth factor receptors with relevant functions that were highlighted by our microarray data (Genbacev et al., 2011). It is well established that growth factors are key regulators of stem/progenitor cell self-renewal and their differentiation into tissue-/organ-specific progeny. In this regard, we characterized the expression of the epidermal growth factor receptor (EGFR), which is also expressed by STBs and villous as well as extravillous CTBs (Bulmer et al., 1989; Ladines-Llave et al., 1991; Mühlhauser et al., 1993). Immunolocalization showed a variable pattern of plasma membrane immunoreactivity in a few cells and nuclear reactivity in most. Nuclear localization of EGFR has been reported in regenerating hepatocytes (Marti et al., 1991). High levels of EGF receptors in the nucleus were later detected in many tumors and in some normal tissues/organs (Brand et al., 2011), including the placenta (Cao et al., 1995). Nuclear translocation of EGFR and its role as a transcriptional co-activator of the important cell cycle regulatory protein, cyclin D (Lin et al., 2001), is consistent with its presence in highly proliferative cells.
We also characterized TBPC expression of the receptor for leukemia inhibiting factor (LIFR). There were several reasons for our interest in this receptor. First, LIF and LIFR are present in early-stage human embryos (Chen et al., 1999). Secondly, LIF and LIFR genes were identified as expressed by chorionic villi of first trimester and term placentas (Sharkey et al., 1999). Thirdly, LIF, produced by decidual cells and chorionic villi, has multiple effects on TB cells (Chen et al., 2004). For example, in mice, maternal LIF is required for implantation in mice (Stewart et al., 1992). Immunostaining of TBPCs revealed that LIFRs had the highest rate of uniform expression during the second trimester (Fig. 3D), a difference that was confirmed by qRT–PCR analyses (data not shown). Thus, we hypothesize that LIF could play a role in helping to coordinate the rapid growth of the smooth chorion that occurs during the second trimester of pregnancy.
Next, we asked whether the TBPC lines could differentiate into invasive CTBs. In these experiments, the cells were cultured, as previously described (Genbacev et al., 2011), on Matrigel-coated Transwell membranes in differentiation medium supplemented with EGF. TBPC expression of EGFRs suggested that its ligand might have the same effect on these cells as it does on CTBs, i.e. stimulating cell motility (LaMarca et al., 2008) and invasion (Bass et al., 1994; Qiu et al., 2004). By 12 h of culture, the initial wave of invasive CTBs, which we estimated to be 5–7% of the population (Fig. 4), had breached the underside of the filter. During this process, they down-regulated the expression of stage-specific antigens associated with the undifferentiated state (e.g. HMGA2 and GATA4) and lost immunostaining for Ki67, suggesting they exited the cell cycle (data not shown). By 48 h they up-regulated markers of the invasive CTB subpopulation, including HLA-G (Fig. 4B) and integrin αVβ3 (data not shown). We did not detect any significant differences among cell lines isolated from different gestational age samples in terms of their ability to generate invasive CTBs. Given that the cells could also invade and join the CTB layer of explants established from the smooth chorion, it may be that this process can continue throughout pregnancy.
We were very interested in the functions of factors they expressed that could play a role in maintaining their progenitors state or in the process whereby they differentiate. In this regard, we studied the effects of down-regulating HMGA2 and GATA4. HMGA2 alters transcription by binding DNA and changing its architectural landscape (Reeves and Beckerbauer, 2001). This molecule is highly expressed during the early stages of development after which it is down-regulated by the let-7 miRNA (Lee and Dutta, 2007). Previous studies showed that Hmga2 regulates neuronal stem cell self-renewal, by reducing p16Ink4a and p19Arf expression (Nishino et al., 2008). A similar function has been shown for this chromatin binding protein in hematopoietic stem cells (Pietras and Passegué, 2013) and retinal progenitors (Parameswaran et al., 2014). Our data suggested that HMGA2 also plays an important role in TBPC self-renewal, by mechanisms that included down-regulation of cyclins that are required for cell cycle progression (Fig. 6). Presumably the observed effects on the cells' expression of stage-specific antigens (Fig. 7) lie downstream from the observed mitotic effects.
In contrast, the transcription factor, GATA4, appeared to be involved in maintaining a TB identity rather than in TBPC self-renewal (Fig. 8). GATA factors play well-recognized roles in hematopoiesis, with GATA2 and -3 implicated in regulating TB gene expression and GATA4–5 playing roles in differentiation of primitive endoderm and heart development, reviewed in Roberts and Fisher (2011). Here, we add GATA4 to the factors in this family that play a role in placentation.
In summary, we developed a new method for isolating human TBPCs from the smooth chorion. As with mouse TB stem cells, they showed a strong bias for differentiating into invasive CTBs rather than fusing to form STBs, the preferred pathway taken by primary CTBs at term. The results of experiments in which they were co-cultured with explants of the smooth chorion suggested that they migrate from the associated mesenchyme to join the CTB layer. As with other progenitors, principally neuronal and hematopoietic, HMGA2 played an important role in their ability to self-new, while GATA4 (and likely GATA3) control the expression of TB antigens, including the production of hormones. These data are further evidence that this model is useful for studying aspects of human placentation that are difficult to analyze using other approaches.
Supplementary data
Supplementary data are available at http://humrep.oxfordjournals.org/.
Authors’ roles
O.G. helped to design the experiments and participated in all the work. N.L. isolated the progenitors via FACS. K.O. did the transfections and analyzed the results. A.P. performed the immunostaining. T.G.-G. helped with the co-culture experiments. M.K. enzymatically dissociated cells of the chorionic mesenchyme. A.B. helped with the FACS analyses. M.G. analyzed the microarray data. S.J.F. helped to plan the experiments and interpret the data. She also wrote the manuscript.
Funding
Research reported in this publication was supported by the Eunice Kennedy Shriver National Institute of Child Health and Human Development of the National Institutes of Health under award P50HD055764.
Conflict of interest
O.G., N.L., K.O., A.P., T.G.-G., M.K., A.B., M.G. have nothing to disclose. S.J.F. received licensing fees and royalties from SeraCare Life Sciences for trisomic TBPC lines that were derived according to the methods described in this manuscript.
Supplementary Material
References
- Anson-Cartwright L, Dawson K, Holmyard D, Fisher SJ, Lazzarini RA, Cross JC. The glial cells missing-1 protein is essential for branching morphogenesis in the chorioallantoic placenta. Nat Genet 2000;25:311–314. [DOI] [PubMed] [Google Scholar]
- Bai H, Sakurai T, Godkin JD, Imakawa K. Expression and potential role of GATA factors in trophoblast development. J Reprod Dev 2013;59:1–6. [DOI] [PMC free article] [PubMed] [Google Scholar]
- Bao L, Pigott R, Matsumura Y, Baban D, Tarin D. Correlation of VLA-4 integrin expression with metastatic potential in various human tumour cell lines. Differentiation 1993;52:239–246. [DOI] [PubMed] [Google Scholar]
- Bárcena A, Muench MO, Kapidzic M, Gormley M, Goldfien GA, Fisher SJ. Human placenta and chorion: potential additional sources of hematopoietic stem cells for transplantation. Transfusion 2011;51(Suppl. 4):94S–105S. [DOI] [PMC free article] [PubMed] [Google Scholar]
- Bass KE, Morrish D, Roth I, Bhardwaj D, Taylor R, Zhou Y, Fisher SJ. Human cytotrophoblast invasion is up-regulated by epidermal growth factor: evidence that paracrine factors modify this process. Dev Biol 1994;164:550–561. [DOI] [PubMed] [Google Scholar]
- Battula VL, Bareiss PM, Treml S, Conrad S, Albert I, Hojak S, Abele H, Schewe B, Just L, Skutella T et al. Human placenta and bone marrow derived MSC cultured in serum-free, b-FGF-containing medium express cell surface frizzled-9 and SSEA-4 and give rise to multilineage differentiation. Differentiation 2007;75:279–291. [DOI] [PubMed] [Google Scholar]
- Brand TM, Iida M, Li C, Wheeler DL. The nuclear epidermal growth factor receptor signaling network and its role in cancer. Discov Med 2011;12:419–432. [PMC free article] [PubMed] [Google Scholar]
- Brooke G, Rossetti T, Pelekanos R, Ilic N, Murray P, Hancock S, Antonenas V, Huang G, Gottlieb D, Bradstock K et al. Manufacturing of human placenta-derived mesenchymal stem cells for clinical trials. Br J Haematol 2009;144:571–579. [DOI] [PubMed] [Google Scholar]
- Bulmer JN, Thrower S, Wells M. Expression of epidermal growth factor receptor and transferrin receptor by human trophoblast populations. Am J Reprod Immunol 1989;21:87–93. [DOI] [PubMed] [Google Scholar]
- Cao H, Lei ZM, Bian L, Rao CV. Functional nuclear epidermal growth factor receptors in human choriocarcinoma JEG-3 cells and normal human placenta. Endocrinology 1995;136:3163–3172. [DOI] [PubMed] [Google Scholar]
- Cartwright JE, Balarajah G. Trophoblast interactions with endothelial cells are increased by interleukin-1beta and tumour necrosis factor alpha and involve vascular cell adhesion molecule-1 and alpha4beta1. Exp Cell Res 2005;304:328–336. [DOI] [PubMed] [Google Scholar]
- Chen HF, Shew JY, Ho HN, Hsu WL, Yang YS. Expression of leukemia inhibitory factor and its receptor in preimplantation embryos. Fertil Steril 1999;72:713–719. [DOI] [PubMed] [Google Scholar]
- Chen HF, Chao KH, Shew JY, Yang YS, Ho HN. Expression of leukemia inhibitory factor and its receptor is not altered in the decidua and chorionic villi of human anembryonic pregnancy. Hum Reprod 2004;19:1647–1654. [DOI] [PubMed] [Google Scholar]
- Chien C-C, Yen BL, Lee F-K, Lai T-H, Chen Y-C, Chan S-H, Huang H-I, Cells H-L. In vitro differentiation of human placenta-derived multipotent cells into hepatocyte-like cells. Stem Cells 2006;24:1759–1768. [DOI] [PubMed] [Google Scholar]
- Damsky CH, Fitzgerald ML, Fisher SJ. Distribution patterns of extracellular matrix components and adhesion receptors are intricately modulated during first trimester differentiation along the invasive pathway, in vivo. J Clin Invest 1992;89:210–222. [DOI] [PMC free article] [PubMed] [Google Scholar]
- Fukuchi Y, Nakajima H, Sugiyama D, Hirose I, Kitamura T, Tsuji K. Human placenta-derived cells have mesenchymal stem/progenitor cell potential. Stem Cells 2004;22:649–658. [DOI] [PubMed] [Google Scholar]
- Genbacev O, Donne M, Kapidzic M, Gormley M, Lamb J, Gilmore J, Larocque N, Goldfien G, Zdravkovic T, McMaster MT et al. Establishment of human trophoblast progenitor cell lines from the chorion. Stem Cells 2011;29:1427–1436. [DOI] [PMC free article] [PubMed] [Google Scholar]
- Genbacev O, Lamb JD, Prakobphol A, Donne M, McMaster MT, Fisher SJ. Human trophoblast progenitors: where do they reside? Semin Reprod Med 2013;31:56–61. [DOI] [PMC free article] [PubMed] [Google Scholar]
- Hammond MD, Ambler WG, Ai Y, Sansing LH. alpha4 integrin is a regulator of leukocyte recruitment after experimental intracerebral hemorrhage. Stroke 2014;45:2485–2487. [DOI] [PMC free article] [PubMed] [Google Scholar]
- Hunkapiller NM, Fisher SJ. Chapter 12. Placental remodeling of the uterine vasculature. Methods Enzymol 2008;445:281–302. [DOI] [PMC free article] [PubMed] [Google Scholar]
- Kil SH, Krull CE, Cann G, Clegg D, Bronner-Fraser M. The alpha4 subunit of integrin is important for neural crest cell migration. Dev Biol 1998;202:29–42. [DOI] [PubMed] [Google Scholar]
- Ladines-Llave C, Maruo T, Manalo A, Mochizuki M. Cytologic localization of epidermal growth factor and its receptor in developing human placenta varies over the course of pregnancy. Am J Obstet Gynecol 1991;165:1377–1382. [DOI] [PubMed] [Google Scholar]
- LaMarca HL, Dash PR, Vishnuthevan K, Harvey E, Sullivan DE, Morris CA, Whitley GSJ. Epidermal growth factor-stimulated extravillous cytotrophoblast motility is mediated by the activation of PI3-K, Akt and both p38 and p42/44 mitogen-activated protein kinases. Hum Reprod 2008;23:1733–1741. [DOI] [PMC free article] [PubMed] [Google Scholar]
- Lee YS, Dutta A. The tumor suppressor microRNA let-7 represses the HMGA2 oncogene. Genes Dev 2007;21:1025–1030. [DOI] [PMC free article] [PubMed] [Google Scholar]
- Li O, Li J, Dröge P. DNA architectural factor and proto-oncogene HMGA2 regulates key developmental genes in pluripotent human embryonic stem cells. FEBS Lett 2007;581:3533–3537. [DOI] [PubMed] [Google Scholar]
- Lin SY, Makino K, Xia W, Matin A, Wen Y, Kwong KY, Bourguignon L, Hung MC. Nuclear localization of EGF receptor and its potential new role as a transcription factor. Nat Cell Biol 2001;3:802–808. [DOI] [PubMed] [Google Scholar]
- Marti U, Burwen SJ, Wells A, Barker ME, Huling S, Feren AM, Jones AL. Localization of epidermal growth factor receptor in hepatocyte nuclei. Hepatology 1991;13:15–20. [PubMed] [Google Scholar]
- McMaster M, Zhou Y, Shorter S, Kapasi K, Geraghty D, Lim KH, Fisher S. HLA-G isoforms produced by placental cytotrophoblasts and found in amniotic fluid are due to unusual glycosylation. J Immunol 1998;160:5922–5928. [PubMed] [Google Scholar]
- Miyake K, Weissman IL, Greenberger JS, Kincade PW. Evidence for a role of the integrin VLA-4 in lympho-hemopoiesis. J Exp Biol 1991;173:599–607. [DOI] [PMC free article] [PubMed] [Google Scholar]
- Mould AP, Askari JA, Craig SE, Garratt AN, Clements J, Humphries MJ. Integrin alpha 4 beta 1-mediated melanoma cell adhesion and migration on vascular cell adhesion molecule-1 (VCAM-1) and the alternatively spliced IIICS region of fibronectin. J Biol Chem 1994;269:27224–27230. [PubMed] [Google Scholar]
- Mühlhauser J, Crescimanno C, Kaufmann P, Höfler H, Zaccheo D, Castellucci M. Differentiation and proliferation patterns in human trophoblast revealed by c-erbB-2 oncogene product and EGF-R. J Histochem Cytochem 1993;41:165–173. [DOI] [PubMed] [Google Scholar]
- Nishino J, Kim I, Chada K, Morrison SJ. Hmga2 promotes neural stem cell self-renewal in young but not old mice by reducing p16Ink4a and p19Arf expression. Cell 2008;135:227–239. [DOI] [PMC free article] [PubMed] [Google Scholar]
- Parameswaran S, Xia X, Hegde G, Ahmad I. Hmga2 regulates self-renewal of retinal progenitors. Development 2014;141:4087–4097. [DOI] [PMC free article] [PubMed] [Google Scholar]
- Pidoux G, Gerbaud P, Gnidehou S, Grynberg M, Geneau G, Guibourdenche J, Carette D, Cronier L, Evain-Brion D, Malassiné A et al. ZO-1 is involved in trophoblastic cell differentiation in human placenta. Am J Physiol Cell Physiol 2010;298:C1517–C1526. [DOI] [PubMed] [Google Scholar]
- Pietras EM, Passegué E. Linking HSCs to their youth. Nat Cell Biol 2013;15:885–887. [DOI] [PubMed] [Google Scholar]
- Portmann-Lanz CB, Schoeberlein A, Huber A, Sager R, Malek A, Holzgreve W, Surbek DV. Placental mesenchymal stem cells as potential autologous graft for pre- and perinatal neuroregeneration. Am J Obstet Gynecol 2006;194:664–673. [DOI] [PubMed] [Google Scholar]
- Priestley GV, Scott LM, Ulyanova T, Papayannopoulou T. Lack of a4 integrin expression in stem cells restricts competitive function and self-renewal activity. Blood 2006;107:2959–2967. [DOI] [PMC free article] [PubMed] [Google Scholar]
- Qiu Q, Yang M, Tsang BK, Gruslin A. EGF-induced trophoblast secretion of MMP-9 and TIMP-1 involves activation of both PI3K and MAPK signalling pathways. Reproduction 2004;128:355–363. [DOI] [PubMed] [Google Scholar]
- Red-Horse K, Zhou Y, Genbacev O, Prakobphol A, Foulk R, McMaster M, Fisher SJ. Trophoblast differentiation during embryo implantation and formation of the maternal-fetal interface. J Clin Invest 2004;114:744–754. [DOI] [PMC free article] [PubMed] [Google Scholar]
- Reeves R, Beckerbauer L. HMGI/Y proteins: flexible regulators of transcription and chromatin structure. Biochim Biophys Acta Gene Struct Expr 2001;1519:13–29. [DOI] [PubMed] [Google Scholar]
- Roberts RM, Fisher SJ. Trophoblast stem cells. Biol Reprod 2011;84:412–421. [DOI] [PMC free article] [PubMed] [Google Scholar]
- Schubert SW, Lamoureux N, Kilian K, Klein-Hitpass L, Hashemolhosseini S. Identification of integrin-alpha4, Rb1, and syncytin a as murine placental target genes of the transcription factor GCMa/Gcm1. J Biol Chem 2008;283:5460–5465. [DOI] [PubMed] [Google Scholar]
- Sharkey AM, King A, Clark DE, Burrows TD, Jokhi PP, Charnock-Jones DS, Loke YW, Smith SK. Localization of leukemia inhibitory factor and its receptor in human placenta throughout pregnancy. Biol Reprod 1999;60:355–364. [DOI] [PubMed] [Google Scholar]
- Simmons DG, Natale DRC, Begay V, Hughes M, Leutz A, Cross JC. Early patterning of the chorion leads to the trilaminar trophoblast cell structure in the placental labyrinth. Development 2008;135:2083–2091. [DOI] [PMC free article] [PubMed] [Google Scholar]
- Stewart CL, Kaspar P, Brunet LJ, Bhatt H, Gadi I, Köntgen F, Abbondanzo SJ. Blastocyst implantation depends on maternal expression of leukaemia inhibitory factor. Nature 1992;359:76–79. [DOI] [PubMed] [Google Scholar]
- Tanaka S. Derivation and culture of mouse trophoblast stem cells in vitro. Methods Mol Biol 2006;329:35–44. [DOI] [PubMed] [Google Scholar]
- Venkatesan N, Krishnakumar S, Deepa PR, Deepa M, Khetan V, Reddy MA. Molecular deregulation induced by silencing of the high mobility group protein A2 gene in retinoblastoma cells. Mol Vis 2012;18:2420–2437. [PMC free article] [PubMed] [Google Scholar]
- Winn VD, Haimov-Kochman R, Paquet AC, Yang YJ, Madhusudhan MS, Gormley M, Feng KT, Bernlohr DA, McDonagh S, Pereira L et al. Gene expression profiling of the human maternal-fetal interface reveals dramatic changes between midgestation and term. Endocrinology 2007;148:1059–1079. [DOI] [PubMed] [Google Scholar]
- Yen BL, Huang H-I, Chien C-C, Jui H-Y, Ko B-S, Yao M, Shun C-T, Yen M-L, Lee M-C, Chen Y-C. Isolation of multipotent cells from human term placenta. Stem Cells 2005;23:3–9. [DOI] [PubMed] [Google Scholar]
- Zdravkovic T, Nazor KL, Larocque N, Gormley M, Donne M, Hunkapillar N, Giritharan G, Bernstein HS, Wei G, Hebrok M et al. Human stem cells from single blastomeres reveal pathways of embryonic or trophoblast fate specification. Development 2015;142:4010–25. [DOI] [PMC free article] [PubMed] [Google Scholar]
- Zhou Y, Fisher SJ, Janatpour M, Genbacev O, Dejana E, Wheelock M, Damsky CH. Human cytotrophoblasts adopt a vascular phenotype as they differentiate: a strategy for successful endovascular invasion? J Clin Invest 1997;99:2139–2151. [DOI] [PMC free article] [PubMed] [Google Scholar]
Associated Data
This section collects any data citations, data availability statements, or supplementary materials included in this article.