

Abstract
Aims
Hypertrophic cardiomyopathy (HCM) patients are at risk of ventricular arrhythmias (VAs). We aimed to explore whether systolic function by strain echocardiography is related to VAs and to the extent of fibrosis by cardiac magnetic resonance imaging (CMR).
Methods and results
We included 150 HCM patients and 50 healthy individuals. VAs were defined as non-sustained and sustained ventricular tachycardia and aborted cardiac arrest. Left ventricular function was assessed by ejection fraction (EF) and by global longitudinal strain (GLS) assessed by speckle tracking echocardiography. Mechanical dispersion was calculated as standard deviation (SD) of time from Q/R on ECG to peak longitudinal strain in 16 left ventricular segments. Late gadolinium enhancement (LGE) was assessed by CMR. HCM patients had similar EF (61 ± 5% vs. 61 ± 8%, P = 0.77), but worse GLS (−15.7 ± 3.6% vs. −21.1 ± 1.9%, P < 0.001) and more pronounced mechanical dispersion (64 ± 22 vs. 36 ± 13 ms, P < 0.001) compared with healthy individuals. VAs were documented in 37 (25%) HCM patients. Patients with VAs had worse GLS (−14.1 ± 3.6% vs. −16.3 ± 3.4%, P < 0.01), more pronounced mechanical dispersion (79 ± 27 vs. 59 ± 16 ms, P < 0.001), and higher %LGE (6.1 ± 7.8% vs. 0.5 ± 1.4%, P < 0.001) than patients without VAs. Mechanical dispersion correlated with %LGE (R = 0.52, P < 0.001) and was independently associated with VAs (OR 1.6, 95% CI 1.1–2.3, P = 0.02) and improved risk stratification for VAs.
Conclusion
GLS, mechanical dispersion, and LGE were markers of VAs in HCM patients. Mechanical dispersion was a strong independent predictor of VAs and related to the extent of fibrosis. Strain echocardiography may improve risk stratification of VAs in HCM.
Keywords: hypertrophic cardiomyopathy, ventricular arrhythmia, strain echocardiography and cardiac magnetic resonance
Introduction
Hypertrophic cardiomyopathy (HCM) is characterized by a heterogeneous clinical expression with increased risk of sudden cardiac death (SCD) from ventricular arrhythmias (VAs).1 The selection of patients for an implantable cardioverter defibrillator (ICD) as primary prevention is challenging. Current risk scores in HCM incorporate the presence of non-sustained ventricular tachycardia (nsVT) assessed by Holter monitoring as a powerful marker of life-threatening events.2,3 According to current guidelines, 24–48 h Holter monitoring should be performed every 12–18 months or more frequently in symptomatic patients.3 However, due to the relatively short recording times, there is a risk to underestimate the occurrence of asymptomatic ventricular arrhythmias.
Myocardial fibrosis may play a role in arrhythmogenesis in HCM patients.4,5 Electrophysiological studies have shown that HCM patients with malignant arrhythmias have increased electrical dispersion and inhomogeneity of intraventricular conduction, probably related to variation in myocyte diameter, disarray, and myocardial fibrosis, forming the substrate for VAs.6,7
Strain by echocardiography is an excellent tool for assessing regional and global left ventricular (LV) function.8 Mechanical dispersion reflects heterogeneous myocardial contraction and is related to VAs in other cardiomyopathies.9–11 The relation between mechanical dispersion and myocardial fibrosis in HCM is not previously investigated. We aimed to explore the value of strain parameters in prediction of VAs and the relation to myocardial fibrosis in HCM. We hypothesized that pronounced mechanical dispersion is associated with VAs and related to myocardial fibrosis in HCM patients.
Methods
Study population
In this cross-sectional study, 150 HCM patients were consecutively recruited from our Unit of Cardiac Genetic Disease. Inclusion criteria were a definite diagnosis of HCM according to HCM guidelines.2 Exclusion criteria were prior septal reduction therapy, coronary artery disease, and myocardial hypertrophy of other causes, e.g. severe valvular disease, myocardial storage disease, and hypertension.2
All HCM patients underwent clinical examination, echocardiography, and 24–48 h Holter monitoring, and a subset was investigated with cardiac magnetic resonance (CMR).
Fifty healthy individuals matched for age, gender, heart rate, and blood pressure were recruited by invitation from hospital staff, medical school, and research laboratories and underwent clinical examination and echocardiographic examination.
All participants gave written informed consent. The study complied with the Declaration of Helsinki and was approved by the Regional Committees for Medical Research Ethics.
VAs and risk scores
The presence of VAs was defined as previous aborted cardiac arrest, documented sustained ventricular tachycardia (VT), and nsVT during Holter or ICD monitoring. NsVT was defined as runs of ventricular beats with duration between ≥3 beats and 30 s with heart rate >100 bpm.12 Risk of SCD was evaluated by using the 2011 ACCF/AHA Guideline for the diagnosis and Treatment of HCM (SCD Risk stratification score3) and the new SCD risk score calculator according to the HCM guidelines by the European Society of Cardiology [ESC 2014, 5 years SCD risk score (%)2].
Echocardiography
The echocardiographic studies were performed on Vivid 7 or Vivid E9 machines (GE Healthcare, Horten, Norway) with offline data analyses (EchoPac® version 112 GE Healthcare). Maximal wall thickness (MWT) was measured from all LV segments from the base to the apex of the LV in parasternal short-axis view.2 Asymmetric septal hypertrophy was defined as septal to posterior free wall ratio >1.3.13 LV end-diastolic diameter (LVEDD) and LV end-systolic diameter (LVESD) were measured by M-mode or 2D imaging. Ejection fraction (EF) was calculated by modified Simpson's biplane method. Diastolic function was evaluated by transmitral pulsed Doppler and average e′ from septal and lateral tissue Doppler samplings.14 Atrial diameter was determined by M-mode or 2D echocardiography in the parasternal long-axis plane,2 and atrial area was calculated as the average end-systolic area from apical four- and two-chamber views.15 We calculated left atrial volume using the area length method corrected for body surface area [left atrial volume index (LAVI)].15 Left ventricular outflow tract (LVOT) gradients were assessed only at rest, and a pressure gradient of ≥30 mmHg was defined as significant obstruction.2,3
2D strain and mechanical dispersion
Longitudinal strain by speckle tracking echocardiography was obtained from three apical views at frame rate >50/s. Segments that failed to track were manually adjusted, and segments that subsequently failed to track were excluded. Region of interest (ROI) was adjusted to fit the average of the myocardial thickness. LV global longitudinal strain (GLS) was defined as the average of peak longitudinal strains from a 16 LV segments model.16 Time to peak strain was defined as the time from onset Q/R wave on ECG to peak negative longitudinal strain during the entire cardiac cycle. Mechanical dispersion was defined as the standard deviation of time to peak negative strain in 16 LV segments.17,18
Cardiac magnetic resonance imaging
CMR was performed within 1 year from the echocardiographic recording with cine imaging with late gadolinium enhancement (LGE-CMR) in a subset of patients using 1.5 T units (Magnetom Sonata or Magnetom Avanto Siemens, Erlangen, Germany) using a phased array body coil. LGE was obtained with multiple short-axis slices covering the entire LV with a slice to slice increment of 10 mm, 10–20 min after intravenous injection of 0.2 mmol/kg gadopentetate dimeglumine. A breath-hold segmented magnetization-prepared turbo gradient echo sequence was used with an inversion time chosen to null normal myocardial signal.
Cardiac volumes and EF were calculated according to the biplane area length method from the two long-axis cine projections. For the calculation of LV mass, the endocardial and epicardial borders were manually drawn on short-axis cine images in end-diastole. The presence of LGE as a categorical value was first assessed by the radiologist blinded to patients' clinical data. LGE quantification was performed (TFH) using the freely available software Segments version 1.9.19 LGE was defined as areas with adjusted grey-scale threshold ≥5 SD above the mean of normal myocardium, and these areas were automatically traced in all slices by the software. Areas of identified LGE were summarized and quantified as proportion of total LV myocardium (%LGE).
Feasibility and variability analyses
Only patients with technically adequate echocardiograms for speckle tracking analysis were included, and 93% of the myocardial segments could be analysed. Intra- and interobserver variabilities for GLS measurements were 0.95 (95% CI 0.33–0.98) and 0.96 (95% CI 0.63–0.99), respectively, and for mechanical dispersion 0.91 (95% CI 0.13–0.99) and 0.94 (95% CI 0.40–0.99). Re-test reproducibility for mechanical dispersion was 0.93 (95% CI 0.29–0.99). CMR was performed in 96 of 150 (64%). Due to renal failure, LGE-CMR was not performed in 5 patients leaving 91 patients eligible for LGE analyses. Quantification of %LGE was feasible in 85 (57%) patients with an intra- and interobserver variability of 0.99 (95% CI 0.9–0.99) and 0.94 (95% CI 0.81–0.98), respectively.
Genetic analyses
Patients were screened for mutations in myosin-binding protein C (MYBPC3), β-myosin heavy chain (MYH7), regulatory and essential light chains of myosin (MYL2 and MYL3), and cardiac troponin T (TNNT2) and I (TNNI3), as previously described.20,21
Statistical analyses
Parametric data were presented as mean ± standard deviation and compared by unpaired Student's t-test or by χ2 or Fischer's exact test as appropriate. %LGE was not normally distributed and presented as median (min–max) and compared with non-parametric tests. Correlation between echocardiographic parameters and %LGE was assessed by linear regression analysis. Univariate logistic regression was used to identify markers for VA. Multivariate analyses were performed including age and significant (P < 0.05) variables from the univariate analyses. Collinearity was observed between mechanical dispersion and %LGE, and only mechanical dispersion was included in the multivariate analysis. Kaplan–Meier analysis was used to create arrhythmia-free outcome curves. Receiver operator characteristic (ROC) curves were created and the value closest to the upper left corner determined optimal sensitivity and specificity to discriminate between HCM patients with VAs (Analyze-it®). We used Likelihood ratios test to evaluate whether strain echocardiography improved risk stratification of VA when added to the conventional SCD Risk stratification score3 (SPSS version 21, SPSS Inc., Chicago, IL, USA). Inter- and intraobserver variabilities were expressed by intraclass correlation coefficients. Two-sided values of P≤ 0.05 were considered statistically significant.
Results
Patient characteristics and genetic analyses
We included 150 HCM patients (Table 1). Average of SCD Risk stratification score was 0.6 ± 0.7 and 5-year SCD risk score was 2.8 ± 2.0%.
Table 1.
Clinical characteristics and echocardiographic findings in 50 healthy individuals and 150 patients with hypertrophic cardiomyopathy
| Healthy individuals (n = 50) | HCM (n = 150) | P | |
|---|---|---|---|
| Age (years) | 50 ± 19 | 54 ± 14 | 0.13 |
| Women [n (%)] | 19 (38) | 59 (39) | 1.00 |
| Heart rate (bpm) | 63 ± 10 | 64 ± 12 | 0.48 |
| NYHA class (0–4) | 2.2 ± 0.9 | ||
| Systolic BP (mmHg) | 127 ± 10 | 130 ± 22 | 0.75 |
| Diastolic BP (mmHg) | 74 ± 10 | 78 ± 13 | 0.43 |
| Echocardiography | |||
| Peak LVOT gradient (mmHg) | 4 ± 1 | 35 ± 35 | <0.001 |
| LVEDD (mm) | 51 ± 5 | 47 ± 6 | <0.001 |
| LVESD (mm) | 33 ± 5 | 29 ± 6 | <0.001 |
| MWT (mm) | 9 ± 1 | 19 ± 4 | <0.001 |
| EF (%) | 61 ± 5 | 61 ± 8 | 0.77 |
| GLS (%) | −21.1 ± 1.9 | −15.7 ± 3.6 | <0.001 |
| Mechanical dispersion (ms) | 36 ± 13 | 64 ± 22 | <0.001 |
| Deceleration time (ms) | 195 ± 42 | 223 ± 77 | 0.02 |
| E (m/s) | 0.7 ± 0.2 | 0.9 ± 0.9 | 0.20 |
| E/A | 1.4 ± 0.6 | 1.4 ± 0.8 | 0.54 |
| E/e′ | 7.2 ± 2.2 | 15.5 ± 8.8 | <0.001 |
| LA area (cm2) | 17 ± 3.7 | 26 ± 12 | <0.001 |
| LA diameter (mm) | 24 ± 14 | 43 ± 8 | <0.001 |
| LAVI (mL/m2) | 28 ± 9 | 43 ± 16 | <0.001 |
Mean ± SD.
HCM, hypertrophic cardiomyopathy; NYHA class, New York Heart Association functional classification; BP, blood pressure; LVEDD, left ventricular end-diastolic diameter; LVESD, left ventricular end-systolic diameter; MWT, maximal wall thickness; EF, ejection fraction; GLS, global longitudinal strain; E, early transmitral flow velocity; A, atrial transmitral filling velocity; e′, early diastolic myocardial velocity; LA, left atrium; LAVI, left atrial volume index.
P-values from ANOVA and χ2 test.
A family history of HCM was present in 64 (43%). In all, 135 patients underwent genetic testing and 60 (44%) had confirmed HCM-related pathogenic mutations [40 (67%) MYBP3, 16 (27%) MYH7, 2 (3%) TNNI3, and 2 (3%) TNNT2]. No mutation was found in 75 (56%), and in 15 patients, genetic screening was not performed.
Imaging findings in HCM patients
MWT was thicker in HCM patients compared with healthy individuals (P < 0.001) (Table 1). Significant LVOT obstruction was measured in 64 (43%) patients, and in these, mean resting peak gradient was 70 ± 25 mmHg.
Systolic function by EF was similar in HCM patients and healthy individuals, whereas GLS was worse in the HCM patients (P < 0.001) (Table 1). Mechanical dispersion was more pronounced in HCM compared with healthy individuals (P < 0.001) (Table 1, Figures 1 and 2). HCM patients had increased deceleration time, E/e′, and LAVI compared with healthy (all P < 0.05) (Table 1).
Figure 1.

Box plots of imaging parameters in 50 healthy individuals, 113 HCM patients without, and 37 HCM patients with ventricular arrhythmias. Mechanical dispersion was more pronounced, and GLS was worse in HCM patients compared with healthy individuals. Mechanical dispersion was more pronounced (P < 0.01) and GLS worse (P < 0.001) in HCM with VAs compared with those without VAs, and the amount of fibrosis by LGE-CMR was increased (P < 0.001). *P < 0.01 vs. healthy, †P < 0.01 vs. HCM without VA.
Figure 2.
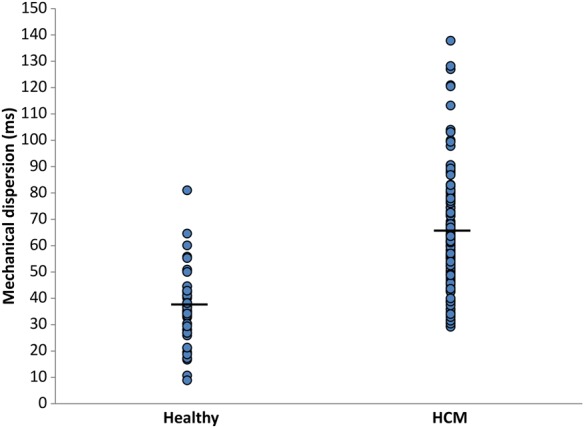
Mechanical dispersion in 50 healthy individuals and in 150 HCM patients. Mechanical dispersion was more pronounced in HCM patients than in healthy controls (36 ± 13 vs. 64 ± 22 ms, P < 0.001).
Cardiac magnetic resonance findings
By visual assessment, 53 (58%) patients had LGE present. Patients with LGE had thicker MWT (23.6 ± 7.5 vs. 18.9 ± 5.3 mm, P = 0.03) and more pronounced mechanical dispersion (66 ± 22 vs. 56 ± 17 ms, P = 0.02) compared with those without fibrosis (Figure 3). There was a tendency towards worse GLS in patients with fibrosis (−15.3 ± 3.3% vs. −16.6 ± 2.9%, P = 0.06). Mechanical dispersion and %LGE correlated moderately (r = 0.52, P < 0.001). Mechanical dispersion >64 ms optimally detected fibrosis with a C-statistics of 0.61 (95% CI 0.49–0.72).
Figure 3.
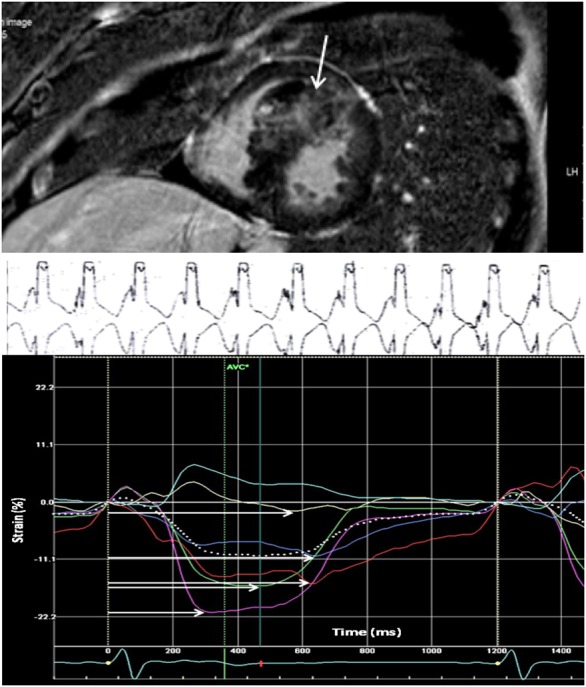
HCM patient with fibrosis in the interventricular septum, pronounced mechanical dispersion by strain echocardiography and ventricular arrhythmia. This HCM study patient was hospitalized because of heart failure symptoms. LGE-CMR detected fibrosis in the interventricular septum (white vertical arrow) with 23% LGE (upper panel). ECG monitoring showed nsVT with rate 150 bpm (mid panel). Mechanical dispersion was pronounced at 100 ms (lower panel). Mechanical dispersion was calculated as SD of time from Q/R on ECG to peak negative longitudinal strain in 16 LV segments. Grey scale ≥5 SD above normal myocardium was defined as LGE by CMR.
There was a weak, but significant correlation between GLS and %LGE (r = 0.27, P = 0.01). GLS worse than −14.9% optimally detected the presence of fibrosis with C-statistics of 0.60 (95% CI 0.49–0.73). No correlation was found between the echocardiographic diastolic parameters and fibrosis by CMR.
VAs in relation to imaging findings in HCM patients
VAs were documented in 37 (25%) patients. Of these, 1 (3%) died of documented ventricular fibrillation (VF), 2 (5%) had VF with aborted cardiac arrest, 1 (3%) had sustained VT, and 33 (89%) had nsVT. In addition, 17 (11%) patients had cardiac syncopes. HCM patients with VAs had thicker MWT, more pronounced mechanical dispersion, and worse GLS compared with patients without arrhythmias (all P < 0.01) (Table 2, Figures 1 and 4), while EF did not differ (P = 0.15) (Table 2). Furthermore, fibrosis by LGE-CMR (P < 0.01) (Table 2 and Figure 1) and higher %LGE (P < 0.001) were markers of VAs (Table 2).
Table 2.
Clinical characteristics and echocardiographic findings in 37 HCM patients with and 113 HCM patients without documented ventricular arrhythmia
| HCM without ventricular arrhythmia (n = 113) | HCM with ventricular arrhythmia (n = 37) | P | |
|---|---|---|---|
| Age (years) | 54 ± 14 | 54 ± 15 | 0.93 |
| Women [n (%)] | 41 (36) | 18 (49) | 0.24 |
| Heart rate (bpm) | 65 ± 13 | 61 ± 8 | 0.07 |
| HCM mutation [n (%)] | 41 (40) | 19 (53) | 0.24 |
| SCD risk stratification score | 0.35 ± 0.5 | 1.5 ± 0.7 | <0.001 |
| 0 risk factors | 76 (67%) | 4 (11%) | <0.001 |
| 1 risk factors | 31 (27%) | 14 (38%) | 0.30 |
| 2 risk factors | 4 (4%) | 17 (46%) | <0.001 |
| 3 risk factors | 0 | 2 (5%) | 0.60 |
| ESC 2014, 5-year SCD risk score (%) | 2.3 ± 1.3 | 4.3 ± 2.9 | <0.001 |
| β-blocker (n) | 96 (85%) | 32 (87%) | 0.53 |
| Calcium blocker (n) | 24 (21%) | 6 (16%) | 0.34 |
| ACE inhibitor (n) | 9 (8%) | 2 (5%) | 0.46 |
| AT II-antagonist (n) | 12 (11%) | 6 (16%) | 0.26 |
| Echocardiography | |||
| LVOT gradient ≥30 mmHg (yes vs. no) [n (%)] | 54 (46) | 12 (32) | 0.10 |
| LVEDD (mm) | 47 ± 6 | 47 ± 7 | 0.54 |
| LVESD (mm) | 28 ± 6 | 29 ± 5 | 0.45 |
| MWT (mm) | 19 ± 3 | 21 ± 5 | <0.01 |
| EF (%) | 61 ± 8 | 59 ± 6 | 0.15 |
| GLS (%) | −16.3 ± 3.4 | −14.1 ± 3.6 | <0.01 |
| Mechanical dispersion (ms) | 59 ± 16 | 79 ± 27 | <0.001 |
| Deceleration time (ms) | 232 ± 80 | 184 ± 60 | 0.01 |
| E (m/s) | 0.9 ± 1.0 | 0.7 ± 0.2 | 0.28 |
| E/A | 1.4 ± 0.8 | 1.4 ± 0.8 | 0.65 |
| E/e′ | 15.4 ± 9.4 | 15.8 ± 6.9 | 0.82 |
| LA area (cm2) | 25 ± 6 | 27 ± 21 | 0.27 |
| LA diameter (mm) | 44 ± 7 | 42 ± 8 | 0.09 |
| LAVI (mL/m2) | 44 ± 17 | 40 ± 15 | 0.16 |
| CMR | n = 75 | n = 21 | |
| MWT (mm) | 21 ± 6 | 24 ± 8 | 0.06 |
| EF (%) | 70 ± 8 | 73 ± 8 | 0.12 |
| LV mass (g) | 214 ± 89 | 243 ± 115 | 0.32 |
| LGE-CMR | n = 72 | n = 192 | |
| LGE present [n (%)] | 36 (50) | 17 (90) | 0.03 |
| % Fibrosis | n = 66 | n = 19 | |
| %LGE | 0 (0–8) | 2 (0–23) | <0.001 |
Mean ± SD and median (min–max).
HCM, hypertrophic cardiomyopathy; ACE, angiotensin-converting enzyme; AT II, angiotensin II-receptor; SCD, sudden cardiac death; ESC, European Society of Cardiology; LVOT, left ventricular outlet tract; LVEDD, left ventricular end-diastolic diameter; LVESD, left ventricular end-systolic diameter; MWT, maximal wall thickness; EF, ejection fraction; GLS, global longitudinal strain; E, early transmitral flow velocity; A, atrial transmitral filling velocity; e′, early diastolic myocardial velocity; LA, left atrium; LAVI, left atrial volume index; EF, ejection fraction; GLS, global longitudinal strain; CMR, cardiac magnetic resonance; LV, left ventricle; LGE-CMR, late gadolinium enhancement–cardiac magnetic resonance.
P-values from ANOVA, χ2, and Mann–Whitney U test.
Figure 4.

Mechanical dispersion by strain echocardiography in two patients with hypertrophic cardiomyopathy. Left panel displays longitudinal strain curves and mechanical dispersion in an HCM patient without ventricular arrhythmias. Horizontal white arrows indicate time to peak strain defined as the time from onset of Q/R to peak negative strain in each segment. Right panel shows more pronounced mechanical dispersion in a HCM patient with ventricular arrhythmias
C-statistics of mechanical dispersion and of %LGE to detect HCM patients with VAs were equal [0.74 (95% CI 0.59–0.89) vs. 0.72 (95% CI 0.58–0.86), P = 0.70]. The 2014 ESC risk score had a C-statistics of 0.75 (95% CI 0.66–0.86) for predicting VAs (P = 0.82 vs. mechanical dispersion) (Figure 5). Using optimal cut-off values from ROC analyses, patients with GLS worse than −15.0% (log-rank P = 0.04), mechanical dispersion >67 ms (log-rank P = 0.02), and with >2%LGE on CMR (log-rank P < 0.001), more frequently had VAs (Figure 6).
Figure 5.
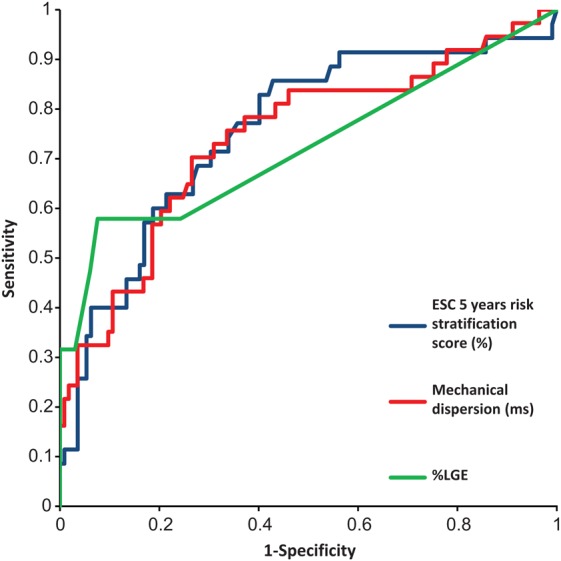
Receiver operating curves for the ability of parameters to predict ventricular arrhythmia in HCM patients. Blue curve represents the 2014 ESC risk score with a C-statistics of 0.75 (95% CI 0.66–0.86), green curve represents % LGE with a C-statistics of 0.72 (95% CI 0.58–0.86), and the red curve represents the ability of mechanical dispersion to discriminate between patients with and without ventricular arrhythmias 0.74 (95% CI 0.59–0.89) (P = 0.82 vs. 2014 ESC risk score and P = 0.70 vs. %LGE).
Figure 6.

Kaplan–Meier plots showing arrhythmia-free outcome in 150 HCM patients. Patients with mechanical dispersion >67 ms by echocardiography and >2% LGE by CMR more frequently had arrhythmic events.
Mechanical dispersion was a strong and independent risk predictor of VAs in multivariate analyses including the presence of LGE-CMR (P = 0.02) (Table 3) and significantly improved risk stratification for VA when added to the conventional SCD Risk stratification score (P = 0.01) (Figure 7).
Table 3.
Univariate and multivariate logistic regression analyses for predictors of ventricular arrhythmias (n = 37) in 150 patients with HCM
| Univariate logistic regression |
Multivariate logistic regression |
|||
|---|---|---|---|---|
| OR, 95% CI | P | OR, 95% CI | P | |
| Age (years) | 1.00 (0.98–1.03) | 0.93 | 0.95 (0.96–1.00) | 0.07 |
| MWT (mm) | 1.14 (1.04–1.26) | <0.01 | 0.90 (0.73–1.12) | 0.34 |
| Family history of SCD (yes vs. no) | 1.47 (0.52–4.20) | 0.52 | ||
| Syncope (yes vs. no) | 1.32 (0.49–3.48) | 0.58 | ||
| Attenuated BP response during exercise (yes vs. no) | 0.43 (0.05–3.61) | 0.43 | ||
| LA diameter (mm) | 0.95 (0.91–1.01) | 0.10 | ||
| LVOT gradient (mmHg) | 0.98 (0.97–1.0) | 0.21 | ||
| LVOT gradient ≥30 mmHg (yes vs. no) | 0.6 (0.3–1.2) | 0.15 | ||
| EF (%) | 0.96 (0.92–1.01) | 0.96 | ||
| GLS (%) | 1.19 (1.07–1.34) | <0.01 | 1.22 (0.95–1.57) | 0.12 |
| Mechanical dispersion (per 10 ms increase) | 1.59 (1.29–1.96) | <0.001 | 1.57 (1.09–2.28) | 0.02 |
| LGE present by CMR (n = 85)(yes vs. no) | 8.50 (1.83–40.50) | <0.01 | 5.59 (0.93–33.5) | 0.06 |
MWT, maximal wall thickness; SCD, sudden cardiac death; LVOT, left ventricular outlet tract; LA, left atrium; EF, ejection fraction; BT, blood pressure; GLS, global longitudinal strain; LGE, late gadolinium enhancement; CMR, cardiac magnetic resonance; OR, odds ratio.
Figure 7.

Incremental value of strain echocardiography over the conventional SCD risk stratification score. GLS did not significantly improve risk stratification of ventricular arrhythmias when added to SCD risk stratification score ≥1 in a likelihood ratio test as opposed to mechanical dispersion which improved the risk stratification significantly.
Discussion
Our results showed a relationship between mechanical dispersion and myocardial fibrosis by LGE-CMR in HCM patients, linking LV dyssynchrony to myocardial fibrosis in HCM patients. Importantly, mechanical dispersion was a strong and independent marker of arrhythmic events and equal to myocardial fibrosis by CMR to identify high-risk individuals. Mechanical dispersion may reflect fibrosis and improve risk stratification of malignant VAs. Reduced longitudinal function was also a marker of arrhythmic events, although inferior to mechanical dispersion.
VAs and mechanical dispersion
More than a quarter of our HCM patients had VAs. The parameters MWT, mechanical dispersion, GLS, and %LGE were all markers of VAs. We have recently reported mechanical dispersion as a marker of arrhythmic risk in other cardiomyopathies.9–11 Mechanical dispersion was higher in HCM patients than in healthy individuals and an independent predictor of arrhythmias in HCM patients, indicating a continuum of risk assessed by this parameter. We demonstrated a relationship between mechanical dispersion and myocardial fibrosis detected by LGE-CMR.
Fibrosis detected by LGE-CMR in HCM patients has previously been related to VAs and SCD,4,22,23 although results diverge for the role of LGE in HCM risk stratification.24 Our study showed higher %LGE in HCM patients with arrhythmic events, and fibrosis was a predictor of VAs in univariate analyses. However, the amount of fibrosis and the optimal cut-off value of %LGE in prediction of VAs were low in our study. %LGE below 5% is normally considered not clinically significant. A possible explanation for the modest association between myocardial fibrosis by LGE and occurrence of VAs in our and in previous studies may be the predominant presence of interstitial fibrosis in HCM compared with replacement fibrosis. Interstitial fibrosis seems to be closer related to arrhythmias in HCM and also less detectable by LGE-CMR compared with replacement fibrosis.20,21,25 Worse longitudinal strain and increased mechanical dispersion in the HCM patients in our study may not be explained by the presence of fibrosis alone, but may have several other pathophysiological explanations. Hypertrophy, disarray, macro and micro vascular ischaemia, as well as intraventricular obstruction, even in the absence of fibrosis, may contribute to abnormal longitudinal strain and increased mechanical dispersion. In our study, mechanical dispersion was equal to LGE-CMR and to the ESC 2014, 5-year SCD risk score (%)2 in identifying patients with arrhythmias. Mechanical dispersion by echocardiography is an easily available method and improved arrhythmic risk estimation in HCM patients in a statistical model based on the SCD Risk stratification score3 and may provide additional information in particular when LGE-CMR is not available or contraindicated.
Other studies have included LVOT gradient as a marker of SCD.2 Our study did not show an association between VAs and LVOT gradient, but this may have several explanations. LVOT gradients were assessed only at rest without bedside manoeuvres as recommended,2 and LVOT gradients may therefore have been underestimated.
LV function in HCM
This study demonstrated reduced systolic function by GLS in HCM patients compared with healthy individuals despite similar EF, in line with previous studies.26 Systolic function assessed by EF typically remains normal during the initial disease progression in HCM. EF is therefore considered inadequate for evaluation of, e.g. indication for cardiac transplantation in HCM.2 Interestingly, in our study, GLS was a marker of VAs in HCM and was weakly related to the presence of fibrosis detected by LGE-CMR. GLS seems to be a more appropriate parameter for evaluating systolic function than EF in patients with HCM and is recommended in echocardiographic evaluation of HCM patients.6
Clinical implications
NsVT is an important risk factor of SCD in large HCM studies and is most frequently assessed by Holter monitoring, with risk of missing and underestimating events inherent to short registration time. This study showed that mechanical dispersion and GLS add important information about arrhythmic risk in HCM and may help to detect high-risk individuals. We propose that mechanical dispersion may be used as a marker of arrhythmias in addition to current risk scores and, in particular, when CMR is not available.
Limitations
This study had a cross-sectional design. The sample size and number of severe arrhythmic events were relatively small and nsVT on Holter monitoring accounted for most of the arrhythmic events. However, nsVT has previously been shown to be an independent predictor of SCD27 and is included in the HCM risk scores.2,3 We need larger cohorts with outcome including sustained VT and SCD in prospective studies to confirm our findings.
Strain measurements are dependent on good image quality. ROI of the speckle tracking software can be challenging to fit for strain analyses in HCM patients due to variable wall thickness and may have influenced our data. We performed CMR within 1 year of echo in only a subset of our patients. This limits the interpretation and may explain the moderate correlation between fibrosis and VAs. Furthermore, the LGE technique may underestimate the amount of fibrosis, and future studies may explore whether post-contrast myocardial relaxation time (T1) mapping CMR or measurements of dispersion by CMR may be more appropriate techniques.25 The distribution of fibrosis may also affect outcome and may be investigated in future studies.
Conclusions
Mechanical dispersion, GLS, wall thickness, and fibrosis by LGE-CMR were markers of VAs in 150 HCM patients. Mechanical dispersion was a strong and independent predictor of arrhythmic events and was related to amount of fibrosis. GLS was related to VAs and the presence of fibrosis despite normal EF. Mechanical dispersion and GLS may help to identify HCM patients with high risk of VAs and SCD.
Funding
This work was supported by the Center for Cardiological Innovation, funded by the Research Council of Norway, Simon Fougner Hartmann's family foundation, and the National Association for Public Health, Norway. Funding to pay the Open Access publication charges for this article was provided by Center for Cardiological Innovation, funded by the Research Council of Norway.
Acknowledgements
We thank Richard Massey for echocardiographic recordings.
Conflict of interest: none declared.
References
- 1.Maron BJ. Contemporary insights and strategies for risk stratification and prevention of sudden death in hypertrophic cardiomyopathy. Circulation 2010;121:445–56. [DOI] [PubMed] [Google Scholar]
- 2.Elliott PM, Anastasakis A, Borger MA, Borggrefe M, Cecchi F, Charron P et al. 2014 ESC guidelines on diagnosis and management of hypertrophic cardiomyopathy: the task force for the diagnosis and management of hypertrophic cardiomyopathy of the European Society of Cardiology (ESC). Eur Heart J 2014;35:2733–79. [DOI] [PubMed] [Google Scholar]
- 3.Members WC, Gersh BJ, Maron BJ, Bonow RO, Dearani JA, Fifer MA et al. 2011 ACCF/AHA guideline for the diagnosis and treatment of hypertrophic cardiomyopathy: a report of the American College of Cardiology Foundation/American Heart Association Task Force on Practice Guidelines. Circulation 2011;124:e783–31. [DOI] [PubMed] [Google Scholar]
- 4.Chan RH, Maron BJ, Olivotto I, Pencina MJ, Assenza GE, Haas T et al. Prognostic value of quantitative contrast-enhanced cardiovascular magnetic resonance for the evaluation of sudden death risk in patients with hypertrophic cardiomyopathy. Circulation 2014;130:484–95. [DOI] [PubMed] [Google Scholar]
- 5.Rubinshtein R, Glockner JF, Ommen SR, Araoz PA, Ackerman MJ, Sorajja P et al. Characteristics and clinical significance of late gadolinium enhancement by contrast-enhanced magnetic resonance imaging in patients with hypertrophic cardiomyopathy. Circ Heart Fail 2010;3:51–8. [DOI] [PubMed] [Google Scholar]
- 6.Cardim N, Galderisi M, Edvardsen T, Plein S, Popescu BA, D'Andrea A et al. Role of multimodality cardiac imaging in the management of patients with hypertrophic cardiomyopathy: an expert consensus of the european association of cardiovascular imaging endorsed by the saudi heart association. Eur Heart J Cardiovasc Imaging 2015;16:280. [DOI] [PubMed] [Google Scholar]
- 7.Saumarez RC, Camm AJ, Panagos A, Gill JS, Stewart JT, de Belder MA et al. Ventricular fibrillation in hypertrophic cardiomyopathy is associated with increased fractionation of paced right ventricular electrograms. Circulation 1992;86:467–74. [DOI] [PubMed] [Google Scholar]
- 8.Edvardsen T. Quantitative assessment of intrinsic regional myocardial deformation by doppler strain rate echocardiography in humans: validation against three-dimensional tagged magnetic resonance imaging. Circulation 2002;106:50–6. [DOI] [PubMed] [Google Scholar]
- 9.Haugaa KH, Smedsrud MK, Steen T, Kongsgaard E, Loennechen JP, Skjaerpe T et al. Mechanical dispersion assessed by myocardial strain in patients after myocardial infarction for risk prediction of ventricular arrhythmia. JACC Cardiovasc Imaging 2010;3:247–56. [DOI] [PubMed] [Google Scholar]
- 10.Sarvari SI, Haugaa KH, Anfinsen OG, Leren TP, Smiseth OA, Kongsgaard E et al. Right ventricular mechanical dispersion is related to malignant arrhythmias: A study of patients with arrhythmogenic right ventricular cardiomyopathy and subclinical right ventricular dysfunction. Eur Heart J 2011;32:1089–96. [DOI] [PubMed] [Google Scholar]
- 11.Haugaa KH, Hasselberg NE, Edvardsen T. Mechanical dispersion by strain echocardiography: A predictor of ventricular arrhythmias in subjects with lamin a/c mutations. JACC Cardiovasc Imaging 2015;8:104–6. [DOI] [PubMed] [Google Scholar]
- 12.Pedersen CT, Kay GN, Kalman J, Borggrefe M, Della-Bella P, Dickfeld T et al. EHRA/HRS/APHRS expert consensus on ventricular arrhythmias. Europace 2014;16:1257–83. [DOI] [PubMed] [Google Scholar]
- 13.Afonso LC, Bernal J, Bax JJ, Abraham TP. Echocardiography in hypertrophic cardiomyopathy: the role of conventional and emerging technologies. JACC Cardiovasc Imaging 2008;1:787–800. [DOI] [PubMed] [Google Scholar]
- 14.Nagueh SF, Appleton CP, Gillebert TC, Marino PN, Oh JK, Smiseth OA et al. Recommendations for the evaluation of left ventricular diastolic function by echocardiography. J Am Soc Echocardiogr 2009;22:107–33. [DOI] [PubMed] [Google Scholar]
- 15.Lang RM, Badano LP, Mor-Avi V, Afilalo J, Armstrong A, Ernande L et al. Recommendations for cardiac chamber quantification by echocardiography in adults: an update from the American Society of Echocardiography and the European Association of Cardiovascular Imaging. J Am Soc Echocardiogr 2015;28:1–39. e14. [DOI] [PubMed] [Google Scholar]
- 16.Cerqueira MD. Standardized myocardial segmentation and nomenclature for tomographic imaging of the heart: a statement for healthcare professionals from the cardiac imaging committee of the council on clinical cardiology of the American Heart Association. Circulation 2002;105:539–42. [DOI] [PubMed] [Google Scholar]
- 17.Haugaa KH, Amlie JP, Berge KE, Leren TP, Smiseth OA, Edvardsen T. Transmural differences in myocardial contraction in long-qt syndrome: mechanical consequences of ion channel dysfunction. Circulation 2010;122:1355–63. [DOI] [PubMed] [Google Scholar]
- 18.Haugaa KH, Edvardsen T, Leren TP, Gran JM, Smiseth OA, Amlie JP. Left ventricular mechanical dispersion by tissue doppler imaging: a novel approach for identifying high-risk individuals with long qt syndrome. Eur Heart J 2009;30:330–7. [DOI] [PMC free article] [PubMed] [Google Scholar]
- 19.Heiberg E, Sjogren J, Ugander M, Carlsson M, Engblom H, Arheden H. Design and validation of segment—freely available software for cardiovascular image analysis. BMC Med Imaging 2010;10:1. [DOI] [PMC free article] [PubMed] [Google Scholar]
- 20.Almaas VM, Haugaa KH, Strom EH, Scott H, Smith HJ, Dahl CP et al. Noninvasive assessment of myocardial fibrosis in patients with obstructive hypertrophic cardiomyopathy. Heart 2014;100:631–8. [DOI] [PubMed] [Google Scholar]
- 21.Almaas VM, Haugaa KH, Strom EH, Scott H, Dahl CP, Leren TP et al. Increased amount of interstitial fibrosis predicts ventricular arrhythmias, and is associated with reduced myocardial septal function in patients with obstructive hypertrophic cardiomyopathy. Europace 2013;15:1319–27. [DOI] [PubMed] [Google Scholar]
- 22.Fluechter S, Kuschyk J, Wolpert C, Doesch C, Veltmann C, Haghi D et al. Extent of late gadolinium enhancement detected by cardiovascular magnetic resonance correlates with the inducibility of ventricular tachyarrhythmia in hypertrophic cardiomyopathy. J Cardiovasc Magn Reson 2010;12:30. [DOI] [PMC free article] [PubMed] [Google Scholar]
- 23.O'Hanlon R, Grasso A, Roughton M, Moon JC, Clark S, Wage R et al. Prognostic significance of myocardial fibrosis in hypertrophic cardiomyopathy. J Am Coll Cardiol 2010;56:867–74. [DOI] [PubMed] [Google Scholar]
- 24.Maron MS, Appelbaum E, Harrigan CJ, Buros J, Gibson CM, Hanna C et al. Clinical profile and significance of delayed enhancement in hypertrophic cardiomyopathy. Circ Heart Fail 2008;1:184–91. [DOI] [PubMed] [Google Scholar]
- 25.Ellims AH, Iles LM, Ling LH, Hare JL, Kaye DM, Taylor AJ. Diffuse myocardial fibrosis in hypertrophic cardiomyopathy can be identified by cardiovascular magnetic resonance, and is associated with left ventricular diastolic dysfunction. J Cardiovasc Magn Reson 2012;14:76. [DOI] [PMC free article] [PubMed] [Google Scholar]
- 26.Afonso L, Kondur A, Simegn M, Niraj A, Hari P, Kaur R et al. Two-dimensional strain profiles in patients with physiological and pathological hypertrophy and preserved left ventricular systolic function: a comparative analyses. BMJ Open 2012;2:e001390. [DOI] [PMC free article] [PubMed] [Google Scholar]
- 27.Monserrat L, Elliott PM, Gimeno JR, Sharma S, Penas-Lado M, McKenna WJ. Non-sustained ventricular tachycardia in hypertrophic cardiomyopathy: an independent marker of sudden death risk in young patients. J Am Coll Cardiol 2003;42:873–9. [DOI] [PubMed] [Google Scholar]