

Abstract
Background
One of the hallmarks of acute colitis is loss of epithelial transport. For unknown reasons, many patients still suffer from GI symptoms during remission, indicating a sustained imbalance between absorption and secretion. We hypothesize that the colonic epithelium becomes more reactive to secretagogues to compensate for a failing barrier.
Methods
Biopsies from ascending colon and sigmoid colon of UC patients in remission and controls were mounted in Ussing chambers. Membrane current (Im) and epithelial capacitance (Cp) were used as markers for anion secretion and mucus exocytosis. Carbachol (1 mmol L−1) and forskolin (10 μmol L−1) were used to study Ca2+ and cAMP-mediated secretion.
Key Results
Baseline values showed segmental patterns with higher Im in ascending colon and higher Cp in sigmoid colon of both UC patients and controls, but the patterns did not differ between the groups. The Im response to forskolin was increased (+35%) in the ascending colon of UC patients and the Im response to carbachol was decreased (−40%) in the same segment. No group differences were seen in the distal colon for either the forskolin or carbachol-induced Im responses. The Cp response to carbachol was instead up-regulated in the distal colon of UC patients, but remainedunaffectedintheproximal colon.
Conclusions & Inferences
The proximal colonic mucosa of UC patients in remission seems to shift its reactivity to secretagogues, becoming more sensitive to cAMP-dependent secretion and less sensitive to Ca2+-dependent secretion. This phenomenon may contribute to residual diarrhea in this patient group, despite resolution of inflammation.
Keywords: carbachol, forskolin, mucus, ussing chamber
INTRODUCTION
Ulcerative colitis is a chronic relapsing disease characterized by a distal to proximal progression. During the acute phase of disease, the colonic mucosa is severely distorted with massive infiltration of immune cells, mucin depletion, and altered crypt architecture.1 During remission most of the histological features of the epithelium are restored, but for unknown reasons, as many as 30% of patients still suffer from gastrointestinal symptoms, such as abdominal pain and diarrhea, despite no signs of ongoing inflammation.2,3 Mechanisms behind these sustained symptoms are not known, but the altered bowel habits point to either motility defects and/or altered absorptive or secretory capacity. Similar symptoms are present in patient groups with low-grade inflammation such as collagenous and microscopic colitis and in patients with diarrhea-dominated irritable bowel syndrome.4,5 Although the pathogenesis of these diseases varies, it is possible that low-grade inflammation is a common denominator.
In colon, both motility and secretion are regulated mainly by the enteric nervous system via cholinergic and VIPergic neurons. Activation of the cholinergic system induces muscle contractions and secretion of ions and mucus which increase transit, creates a driving force for fluid secretion, and ensures protection of the epithelial surface by forming the adherent mucus layer.6–8 At the cellular level, acetylcholine binds muscarinic receptors on the epithelial cells and induces a rapid transient secretory response mediated via increased levels of intracellular Ca2+.9 In contrast, VIP-induced secretion acts via increased levels of intracellular cAMP and subsequent activation of the apical CFTR channel.10,11
Due to the implications of altered ion transport and mucus properties in the pathophysiology of UC and the importance of these systems in regulation of the colonic barrier, we studied the secretory capacity of the colonic epithelium in UC patients in remission. Due to the segmental pattern of disease and known regional differences in ion transport, we studied the response in both the proximal colon and the distal colon. Carbachol and forskolin were used to induce Ca2+ and cAMP-mediated secretion, respectively. Membrane current was used to quantify anion secretion and epithelial capacitance was used to monitor exocytosis e.g., mucus secretion.12,13
MATERIALS AND METHODS
Patient material
Study subjects were recruited among patients referred for colonoscopy at Sahlgrenska University Hospital, Gothenburg, Sweden. Three biopsies from the ascending colon and the sigmoid colon, respectively, were assessed from 24 patients with UC, all with previous pancolitis (7 women; mean age 51 ± 6 years and 17 men; mean age 47 ± 4 years). In the present study, we only included patients in endoscopic remission, for example, with an endoscopic Mayo score of 0.1 Additional clinical information regarding the UC patients is given in Table 1. Biopsies from the ascending colon and the sigmoid colon were also assessed from 32 patients referred for colonoscopy for other reasons (i.e., anemia of unknown origin, previous diverticulitis, polyp surveillance, etc.), in which the colonic mucosa was macroscopically normal. This material was from 17 women (mean age 61 ± 5 years) and 15 men; (mean age 58 ± 3 years) who were used as a control group. Approval was granted by the Human Research Ethical Committee of the Medical Faculty, University of Gothenburg, and written informed consent was obtained from all study subjects.
Table 1.
Clinical information of the analyzed UC patients
| Gender* | Age | Mayo Score
|
Histological assessment†
|
Medication‡ | Relapse/year | ||
|---|---|---|---|---|---|---|---|
| Ascending | Sigmoid | Ascending | Sigmoid | ||||
| F | 45 | 0 | 0 | NAD | NAD | 5-ASA | <1 |
| F | 69 | 0 | 0 | NAD | NAD | 5-ASA | <1 |
| M | 46 | 0 | 0 | A | A | 5-ASA | <1 |
| M | 58 | 0 | 0 | A, L | L | 5-ASA | <1 |
| M | 45 | 0 | 0 | NAD | NAD | 5-ASA | <1 |
| F | 46 | 0 | 0 | NAD | NAD | 5-ASA | <1 |
| M | 56 | 0 | 0 | NAD | NAD | 5-ASA | <1 |
| M | 54 | 0 | 0 | A | A | 5-ASA | <1 |
| F | 44 | 0 | 0 | A | A, P | None | <1 |
| M | 21 | 0 | 0 | L | NAD | 5-ASA, Azathioprine | <1 |
| M | 75 | 0 | 0 | NAD | E, L, P | 5-ASA, Azathioprine | <1 |
| M | 26 | 0 | 0 | NAD | NAD | None | <1 |
| M | 61 | 0 | 0 | NAD | NAD | None | <1 |
| F | 33 | 0 | 0 | NAD | NAD | 5-ASA | <1 |
| M | 51 | 0 | 0 | A, E, L, P | A, E, L, P | 5-ASA | <1 |
| M | 48 | 0 | 0 | NAD | NAD | 5-ASA | ≥1 |
| F | 77 | 0 | 0 | A | A | 5-ASA | <1 |
| M | 37 | 0 | 0 | NAD | NAD | 5-ASA, Azathioprine | <1 |
| M | 54 | 0 | 0 | NAD | NAD | 5-ASA | <1 |
| F | 64 | 0 | 0 | N/A | N/A | None | <1 |
| M | 22 | 0 | 0 | A, E, L, P | A, E, L, P | 5-ASA | <1 |
| M | 53 | 0 | 0 | NAD | NAD | 5-ASA | >1 |
| M | 29 | 0 | 0 | NAD | A, E, L, P | 5-ASA | <1 |
| M | 33 | 0 | 0 | NAD | NAD | None | <1 |
M, male; F, female.
A, alterations in crypt architecture; E, eosinophils; L, lymphocytes; P, plasma cells; NAD, nothing abnormal detected; N/A, not available.
5-ASA: 5-aminosalicylic acid.
Colonoscopy
In the evening preceding colonoscopy, the bowel was cleaned by ingestion of 4 L of an osmotic laxative (Laxabon®, BioPhausia, Stockholm, Sweden). When the patient arrived at the endoscopy unit, he/she was given full information according to the ethical permit, and signed informed consent was taken. The patient was then given premedication consisting of Midazolam (1–2 mg) (Dormicum®, Roche, Basel, Switzerland) and Petidin (50 mg) (Petidin, Meda, Solna, Sweden) intravenously. Heart rate and peripheral oxygenation were monitored by pulse oximetry. If necessary, the patient received additional sedation during the procedure. In addition to biopsies for research purposes, up to 16 biopsies were taken segmentally from cecum to rectum according to our surveillance program. These biopsies were evaluated by a trained pathologist and the histological appearance of the tissue is presented in Table 1.
Mouse tissue
All animal studies were approved by the animal ethics committee, University of Gothenburg. The experiments were performed using male and female wild type C57/Bl6 mice, Muc2−/− and CftrΔF508 mice, both on C57/Bl6 background and 8–12 weeks old.14,15 To increase the survival of the CftrΔF508 mice, the mice were treated with an oral laxative (PEG4000 18 mmol L−1, KCl 10 mmol L−1, Na2SO4 40 mmol L−1, NaHCO3 84 mmol L−1, and NaCl 25 mmol L−1) in the drinking water. The mice were transferred to normal tap water 2 days prior to the experiments. All animals had free access to water and chow. The mice were anesthetized with isoflurane and euthanized by cervical dislocation. The proximal and distal colon (approximately 2 cm) were dissected and flushed with ice-cold oxygenized (95% O2, 5% CO2) Krebs buffer with the following composition (in mmol L−1) NaCl 115.8, CaCl2 1.3, KCl 3.6, KH2PO4 1.4, NaHCO3 23.1, and MgSO4 1.2 (Merck, Darmstadt, Germany) to remove colonic contents.
Ussing chamber experiments
Colonic biopsies from the ascending colon and sigmoid colon were obtained one at a time using a single-use large capacity forceps (Olympus, Tokyo, Japan) and instantly put into oxygenated (95% O2, 5% CO2) ice-cold Krebs buffer with the following composition (in mmol L−1) NaCl 116, CaCl2 1.3, KCl 3.6, KH2PO4 1.4, NaHCO3 23, and MgSO4 1.2 (Merck). Biopsies were mounted in modified Ussing chambers (exposed area 0.03 cm2) within 30 min of collection. Both sides of the epithelium were bathed in 2 mL Krebs buffer that was constantly gassed with 95% O2 and 5% CO2 at a temperature of 37°C, pH 7.4 throughout the whole experiment. The mucosal solution also contained Na-Pyruvate (5.7 mmol L−1) (Sigma-Aldrich, Steinheim, Germany), Na-L-glutamate (5.13 mmol L−1) (Merck), and D-Mannitol (10 mmol L−1) (Sigma-Aldrich). In the serosal solution, D-Mannitol was replaced by D-Glucose (10 mmol L−1) (Sigma-Aldrich). In the mouse experiments, the dissected tissue was incubated on ice for 30 min followed by mounting in the Ussing chamber (exposed area:0.45 cm2). The chamber volume was 10 mL and the buffer composition was the same as described for the human experiments.
Transepithelial electrophysiological measurements
Transepithelial potential difference (PD) was measured once every minute during the whole experiment with a pair of matched Ag/Ag calomel electrodes (Radiometer, Denmark) placed in saturated KCl and connected to the mucosal and serosal sides via a pair of agar bridges (0.9% NaCl/4% agar) (Marine Bioproducts, Canada). After mounting the tissue, PD was allowed to stabilize for 20 min to achieve steady-state conditions. Net membrane current (Im), epithelial resistance (Rp), and epithelial capacitance (Cp) were measured using square-pulse analysis.16 The membrane model used in this analysis was one where the epithelium consists of a current generator (Im) in parallel with a resistor (Rp) and a capacitor (Cp), and all three are in series with a subepithelial resistance (Rs). When a square-pulse is fed through this equivalent circuit, the resulting voltage change will be characterized by an instantaneous increase due to charging of Rs, and a delayed phase that is due to charging of the Rp-Cp element. Likewise, on termination of the current pulse, the voltage reduction will be delayed with an approximately monoexponential decay that represents the discharge of the Rp-Cp element. By plotting the voltage reduction logarithmically vs time, one can generate a linear fit that can be extrapolated back to time zero (V0), i.e., the end of the current pulse. By following the linear part of the discharge event, one can selectively analyze the Rp-Cp element, i.e., the epithelium while excluding Rs from the analysis. The epithelial resistance (Rp) can be calculated from Ohm’s law by dividing the voltage response at time zero (V0) by the applied current, and the epithelial capacitance can be calculated from the time constant of the Rp-Cp element. The formulas used were as follows:
where V (t) is the voltage by time, V0 the starting voltage, t is time after end of the current pulse, Rp is the epithelial resistance, and Cp is the epithelial capacitance. Plotting the voltage logarithmically vs time will generate a linear fit that can be extrapolated back to time zero, i.e., the end of the current pulse. Epithelial resistance can then be calculated from the generated voltage and the applied current by using Ohm’s law:
at time zero t = 0 and V(0) = V0 × e−0/(R × C) giving V(0) = V0 × 1 and R = V0/I where I is the current of the applied pulse.
The capacitance is also calculated from the time course of the voltage curve using the same formula:
where V1 and V2 are the voltages at two selected times t1 and t2 of the mono exponential discharge event.
By measuring the transepithelial voltage (PD) after each pulse, the net membrane current (Im) can be calculated from the recorded PD (in the absence of current pulse) and the Rp value, also by using Ohm’s law
Experimental groups and interventions
Two to four biopsies from each patient were analyzed in the Ussing chamber. The experimental set up included a 20-min equilibration period followed by 40-min baseline recordings and 30-min exposure to either carbachol or forskolin. The same experimental set up was used in the mice experiments, but in these experiments, only two specimens per animal were tested, one proximal and one distal. Carbachol (Sigma-Aldrich) was dissolved in water and forskolin (Sigma-Aldrich) was dissolved in ethyl alcohol. Both substances were added to the serosal chamber at a dilution of 1: 1000.
Data analysis
Due to the biphasic shape of the Im response to carbachol, the response was divided into peak response and sustained response. The peak response was calculated by subtracting the baseline values from the maximum response. The baseline value represents the mean of the last 15 min of the 40-min baseline recording. In human colon, the sustained carbachol response was calculated by subtracting the baseline value from the mean of the response during the time points 20, 25, and 30 min after stimulation. In mouse colon, the sustained response was calculated by subtracting the baseline value from the mean of the response during the time points 10 and 15 min after carbachol stimulation. The Cp response to carbachol followed a transient pattern and is expressed as delta increase in μF cm−2. The baseline value (mean of the last 15 min of the 40-min baseline recording) was subtracted from the values obtained after stimulation. The Im response to forskolin was calculated by subtracting the baseline values from the maximum Im value. The Cp response to forskolin followed a similar pattern as the Im response with a gradual increase over time. The delta response was therefore calculated in the same way as for the Im response, for example, the baseline values were subtracted from the peak response.
Statistics
Data are presented as mean ± standard error of the mean (SEM). For the human data, comparisons between groups were made using a two-tailed Students’ t-test with Welche’s corrections in case of differences in variation. Due to the small sample groups in the mouse experiments, data were analyzed using the Mann–Whitney U-test or a Kruskall–Wallis test followed by Dunnet’s post-test. A P-value <0.05 was considered statistically significant.
RESULTS
Basal electrical properties differed between proximal and distal colon, but not between controls and UC patients in remission
To determine whether baseline epithelial transport was altered in UC patients in remission, baseline values of Im, Rp, and Cp were recorded for 40 min. In both the controls and UC patients, basal Im was significantly higher in the ascending (asc) colon than in sigmoid (sig) colon (Ctrl: asc: 275 ± 28 μA cm−2, sig: 154 ± 16 μA cm−2, P < 0.01; UC: asc: 245 ± 20 μA cm−2, sig: 175 ± 20 μA cm−2, P < 0.05). A similar difference was observed for epithelial resistance, which also was significantly higher in the ascending colon than in the sigmoid colon (Ctrl: asc: 14.0 ± 0.8 ohm cm2, sig: 9.1 ± 0.5 ohm cm2, P < 0.001; UC: asc: 14.1 ± 1.1 ohm cm2, sig: 9.7 ± 0.7 ohm cm2, P <0.001). In contrast, epithelial capacitance was significantly higher in the sigmoid colon than in the ascending colon (Ctrl: asc: 35.0 ± 2.1 μF cm−2, sig: 54.1 ± 2.6 μF cm−2, P < 0.001; UC: asc: 33.4 ± 2.2 μF cm−2, sig: 54.0 ± 4.4 μF cm−2, P < 0.001). No significant differences were observed between the controls and UC patients for any of the three parameters in either segment (Fig. 1A–C).
Figure 1.
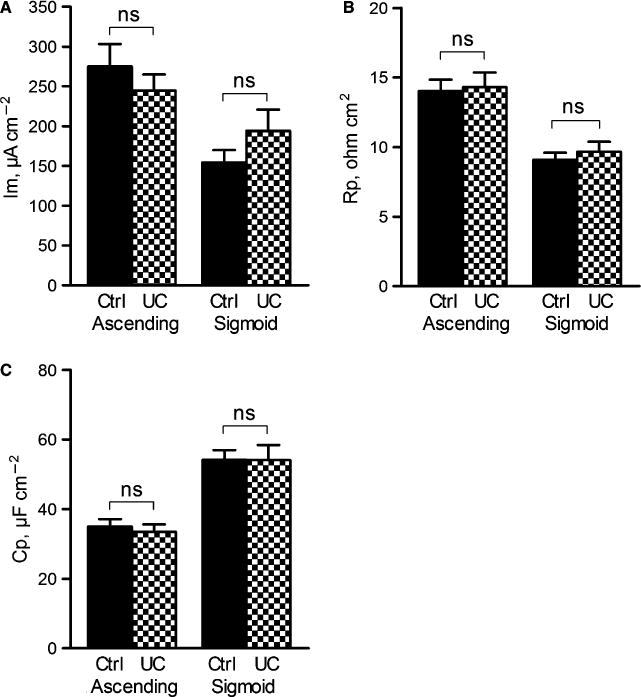
Basal electrophysiological parameters in the ascending colon and sigmoid colon of controls (n = 32) and UC patients (n = 24). (A) Membrane current (Im), (B) Epithelial resistance (Rp) (C) Epithelial capacitance (Cp). Data are presented as mean ± SEM, ns = non significant.
The forskolin-stimulated current response was up-regulated in the ascending colon of UC patients in remission
Forskolin has been widely used to study CFTR-mediated anion secretion in the colonic epithelium of various species.17,18 To determine whether the reactivity of CFTR-mediated anion secretion was altered despite normal baseline values, forskolin (10 μmol L−1) was administered to the serosal side of the epithelium and the effect on Im and Cp was recorded for 30 min. In both the ascending colon and sigmoid colon, forskolin induced a gradual and sustained increase in Im and Cp in both groups. In the control patients, the Im response was larger in the sigmoid colon than in the ascending colon (asc: Δ150 ± 10 μA cm−2, sig: Δ320 ± 40 μA cm−2, P < 0.001), but the Cp response was similar in the two segments (asc: Δ26 ± 4 μF cm−2, sig: Δ32 ± 5 μF cm−2, P = ns). In the UC patients, on the other hand, no segmental difference in the magnitude of the Im response to forskolin was observed (asc: Δ240 ± 30 μA cm−2, sig: Δ230 ± 30 μA cm−2, P = ns). This loss of segmental differences was due to an up-regulation of the forskolin response in the ascending colon (Fig. 2A,B), while the response was not significantly altered in the sigmoid colon (Fig. 2C,D). The enhanced Im response in the ascending colon was not accompanied by an increased Cp response (ctrl: Δ26 ± 4 μF cm−2, UC: Δ30 ± 4 μF cm−2, P = ns) and likewise, the response in the sigmoid colon did not differ from the controls (ctrl: Δ32 ± 5 μF cm−2, UC: Δ25 ± 5 μF cm−2, P = ns). The Im response to forskolin was thus consequently up-regulated in the proximal colon of UC patients in remission.
Figure 2.
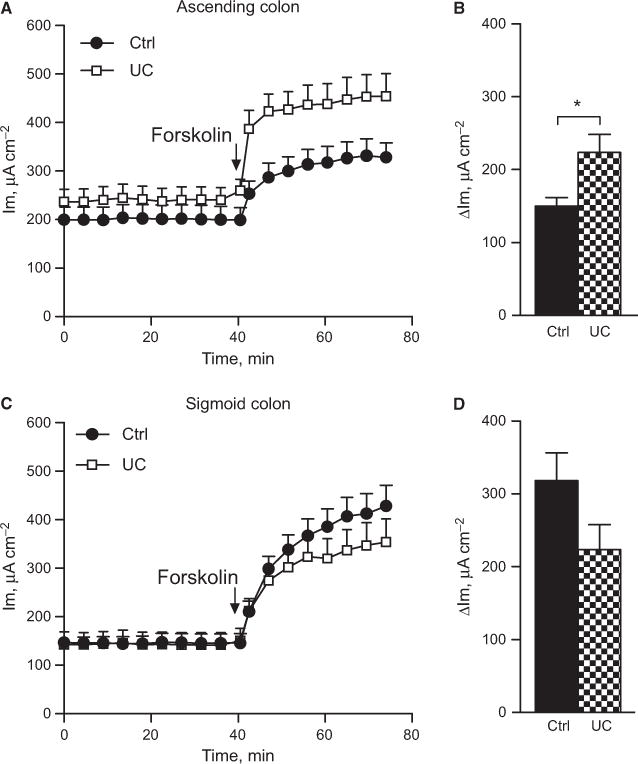
Forskolin effect on membrane current in human colon. (A) Total response over time in the ascending colon of control n = 12) and UC (n = 15) patients. (B) Delta max response in the ascending colon during 30 min incubation. (C) Total response over time in the sigmoid colon of control (n = 10) and UC (n = 13) patients. (D) Delta max response in the sigmoid colon during 30-min incubation. Data are presented as mean ± SEM, *P < 0.05.
Carbachol-stimulated current was downregulated in the ascending colon of UC patients in remission
Carbachol is a well-characterized secretagogue known to induce anion secretion in various species.19,20 Serosal administration of carbachol induced a biphasic increase in Im with a rapid initial peak response followed by a sustained plateau phase. In the control patients, both the peak response and the plateau phase were significantly larger in the ascending colon than in sigmoid colon (peak response: asc: Δ730 ± 100 μA cm−2, sig: Δ440 ± 60 μA cm−2, P < 0.05; sustained response: asc: Δ200 ± 40 μA cm−2, sig: Δ70 ± 10 μA cm−2, P < 0.01). In the UC patients, the segmental difference in the Im response was not observed either for the peak response or for the sustained response (peak: asc: Δ460 ± 70 μA cm−2; sig: Δ 480 ± 80 μA cm−2, P = ns; sustained: asc: Δ70 ± 20 μA cm−2, sig: Δ70 ± 30 μA cm−2, P = ns). Loss of segmental differentiation was mainly due to significantly reduced Im response to carbachol in the ascending colon (Fig. 3A,B), while the response in the sigmoid colon did not differ from the controls (Fig. 3C,D).
Figure 3.
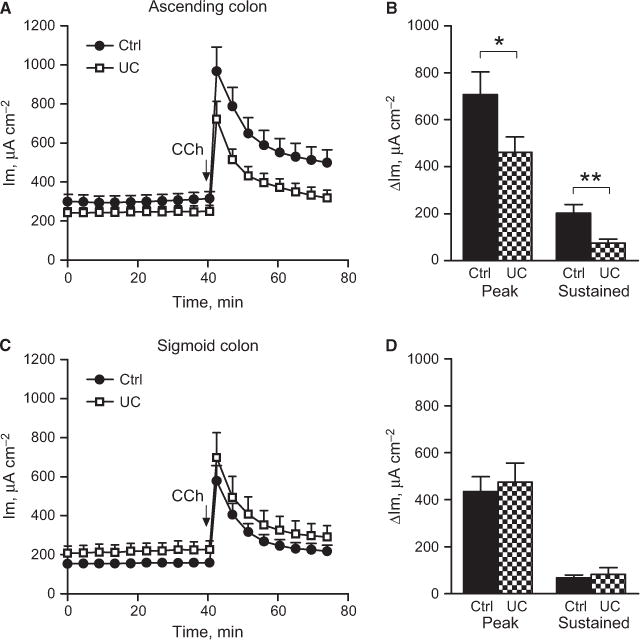
Carbachol effect on membrane current in human colon. (A) Total response over time in the ascending colon of control (n = 21) and UC patients (n = 18). (B) Delta response to carbachol divided into the peak response (max value - baseline) and sustained response (average of three last recordings) baseline). (C) Total response over time in the sigmoid colon of control (n = 17) and UC patients (n = 19). (D) Delta response to carbachol divided into peak response (max value – baseline) and sustained response (average of three last recordings) baseline). Data are presented as mean ± SEM, *P < 0.05, **P < 0.01.
The carbachol-stimulated increase in capacitance was up-regulated in the sigmoid colon of UC patients in remission
Several aspects of mucosal function, like trafficking of membrane transporters and mucin exocytosis, are reflected by changes in membrane capacitance (Cp).12,13 Serosal administration of carbachol induced a transient increase in Cp in both the ascending colon and sigmoid colon. In the control patients, the time course, but not the total magnitude of the response, differed between the ascending colon and sigmoid colon. In the ascending colon, the response reached its maximum after 6 ± 1 min compared to 11 ± 1 min in the sigmoid colon, P < 0.001. Again, this segmental difference was not observed in the UC patients (asc: 7 ± 1 min, sig: 8 ± 1 min, P = ns). The loss of segmental differences in UC patients was due to an up-regulated Cp response to carbachol in the sigmoid colon, whereas the response in the ascending colon remained unchanged (Fig. 4A,B).
Figure 4.
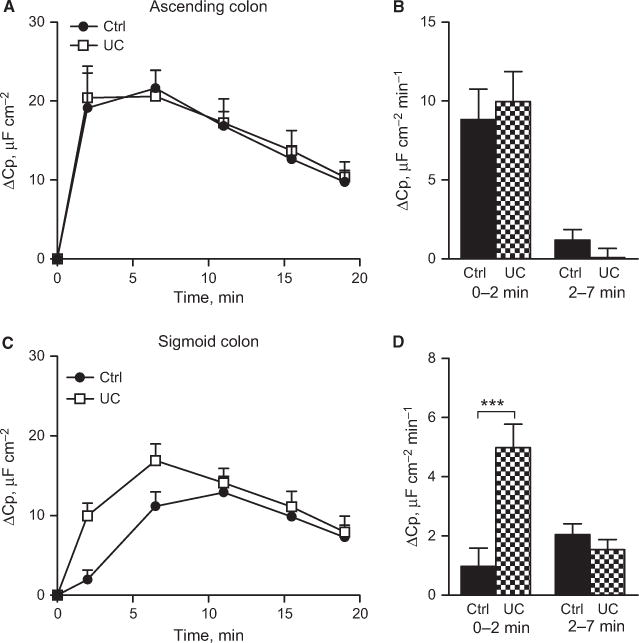
Carbachol effect on epithelial capacitance in human colon. (A) Delta increase in capacitance in the ascending colon of control (n = 21) and UC patients (n = 18). (B) Secretion rate during the first (0–2 min) and second (2–7 min) time points in the ascending colon. (C) Delta increase in capacitance in the sigmoid colon of control (n = 17) and UC patients (n = 19). (D) Secretion rate during the first (0–2 min) and second (2–7 min) time points in the sigmoid colon. Data are presented as mean ± SEM, ***P < 0.001.
No significant differences were observed for either the forskolin or carbachol responses when comparing UC patients who received medical treatment and those who did not.
The Im responses to both forskolin and carbachol were dependent on a functional CFTR channel
To verify that the forskolin and carbachol-induced effects on membrane current reflect anion secretion through the CFTR channel, colonic specimens from CftrΔF508 (CF) mice were stimulated with secretagogues and the membrane current was recorded. In WT mice, serosal addition of forskolin induced a sustained increase in Im in both the proximal and distal colon (proximal: 380 ± 43 μA cm−2, distal: 323 ± 28 μA cm2, P = ns). In the CF mice, the forskolin response was reduced by 90% in both the proximal (WT: 380 ± 43 μA cm−2, CF: 43 ± 45 μA cm−, P < 0.05) and distal colon (WT: 320 ± 28 μA cm2, CF: 31 ± 3 μA cm−2, P < 0.001) (Fig. S1A,B). In WT mice, stimulation with CCh induced a monophasic Im response in the proximal colon and a biphasic response in the distal colon. The Im response to CCh was significantly larger in the distal colon than in the proximal colon (proximal: 131 ± 23 μA cm−2, distal: 260 ± 26 μA cm−2, P < 0.05). In the CF mice, the peak response to CCh was reduced by 70% in the proximal colon (WT: 131 ± 23 μA cm−2, CF: 49 ± 7 μA cm−2, P < 0.05) and 95% in the distal colon (WT: 260 ± 26 μA cm−2, CF: 10 ± 9 μA cm−2, P < 0.001). In addition, the sustained response in the distal colon was also reduced in the CF mice (WT: 92 ± 27 μA cm−2, CF: 17 ± 9 μA cm−2, P < 0.05) (Fig. S2A,B). Accordingly, both the forskolin and carbachol effect on Im seems to require a functioning CFTR channel.
The carbachol-induced effect on capacitance was not observed in mice that lack the main component of the mucus layer
The two most likely mechanisms behind carbacholinduced changes in Cp are insertion of CFTR into the plasma membrane and mucin exocytosis. To test the involvement of these mechanisms, we studied the Cp response in mice that lack intestinal mucus the Muc2−/− mice and CF mice lacking a functional CFTR channel in the plasma membrane. Stimulation with CCh induced a transient increase in Cp in both the proximal and distal colon of WT mice. Similar to the human tissue, the response was larger in the proximal colon than in distal colon, but the time frame of the response did not differ between segments (Fig. 5A–D). The CF mice responded to CCh with an increase in Cp that was similar in magnitude to that seen in the WT mice, but the time course of the response was delayed in the distal colon compared with WT mice (Fig. 5A–D). In contrast, CCh stimulation did not induce an increase in Cp in Muc2−/− mice either in the proximal or in the distal colon (Fig. 5A–D). Thus, Muc2 production is essential for a normal Cp response, whereas a dysfunctional CFTR only affects the time course of the Cp response.
Figure 5.
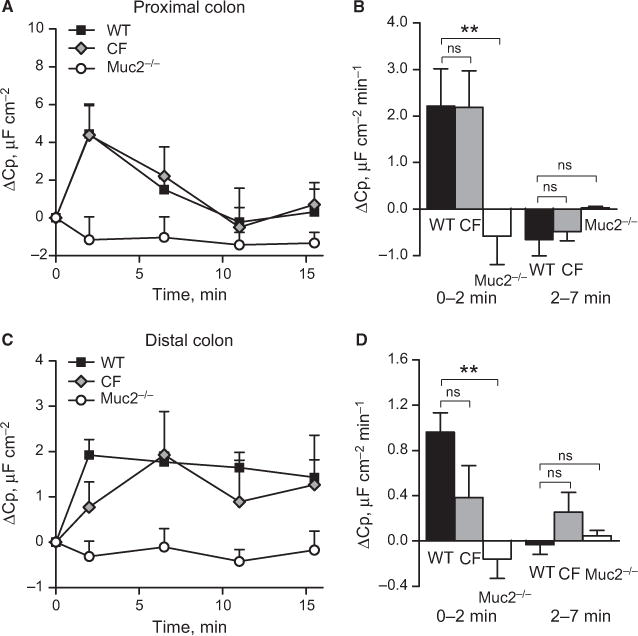
Carbachol-induced effect on epithelial capacitance in mouse colon. (A) Delta increase in capacitance in the proximal colon of WT (n = 6), CF (n = 9) and Muc2−/− (n = 3) mice. (B) Secretion rate during the first (0–2 min) and second (2–7 min) time points in the proximal colon. (C) Delta increase in capacitance in the distal colon of WT (n = 9), CF (n = 9) and Muc2−/− mice (n = 6). (D) Secretion rate during the first (0–2 min) and second (2–7 min) time points in distal colon. Data are presented as mean ± SEM, **P < 0.01, ns = non significant.
DISCUSSION
The key observation in the present study is that despite a macroscopically normal mucosa with normal basal electrical parameters, UC patients in remission showed an altered responsiveness to induced secretion. The Im response to forskolin was up-regulated in the proximal colon and the Im response to carbachol was down-regulated in the same segment. In the distal colon, the Im responses to both forskolin and carbachol remained unaffected, whereas the Cp response to carbachol was up-regulated. The ascending colon of UC patients behaved more like the normal sigmoid colon when it comes to ion secretion, and the distal colon of UC patients behaved like the normal proximal colon in regard to exocytosis, resulting in loss of segmental differentiation.
To verify that the Im response to forskolin and carbachol reflects CFTR-mediated secretion, we tested the responses in mice which lack a functional Cftr channel. In these mice, the Im response to both forskolin and carbachol was significantly reduced in both the proximal and distal colon, making it reasonable to conclude that we measured anion secretion directly or indirectly via the Cftr channel. The CFTR conducts both Cl− and HCO3−, but as the Cl− conductance is higher than the HCO3− conductance, chloride will be preferentially transported.21 However, this method does not allow us to differentiate between the contribution of Cl− and HCO3− to the Im response.
The mechanism behind the Cp response to carbachol is more difficult to delineate. However, studies in cultured epithelial cells have shown that the presence of mucus producing goblet cells was required for a Cp response to carbachol and the time frame and magnitude of the response correlated with mucus secretion.22 To confirm that changes in epithelial capacitance can be used to monitor mucus secretion also in our system, we measured the carbachol-induced effect on Cp in mice that lack the intestinal Muc2 mucin. Our results showed that the Cp response was absent in both the proximal and distal colon of the Muc2-deficient mice. Furthermore, the response was not related to CFTR trafficking, which is known to occur in response to carbachol.23 The magnitude of the carbachol-induced increase in capacitance in human colon suggests that the surface area is increased by 55% in the proximal colon and by 35% in the distal colon following carbachol treatment. These values are compatible with previous studies in human colonic cell lines where the capacitance increased by 35% following carbachol stimulation.24 Studies in rabbit colon have shown that the exposed membrane area of a goblet cell can increase as much as five times during acetylcholine-induced compound exocytosis.6 In the human colonic crypts, 25% of the cells are goblet cells and if all these cells increase their surface area five times, the total tissue area could theoretically increase by 100%.25 As it is not likely that every single goblet cell responds to carbachol stimulation and that the degree of emptying likely differs between cells, an increase in surface area in the range of 35–55% seems realistic.
Surprisingly, little is known regarding the secretory capacity of the colonic epithelium during UC in remission. Studies in animal models of colitis show that acute inflammation is associated with an impaired secretory response that can be attributed to down-regulation of the Na+/K+-ATPase, resulting in a loss of the electrochemical gradient required for anion secretion.26 Although not studied in detail, a severe reduction in the responsiveness to induced secretion can be expected also in the human colon during acute inflammation, as a 70% reduction in the Na+/K+−ATPase activity has been observed in patients with acute inflammation.27,28 Our observation of normal baseline electrical parameters during remission implies that this down-regulation is reversed during remission, as also baseline membrane current depends on a functional Na+/K+-ATPase.29 Normal absorptive functions have also been observed in patients in remission and a single dose of steroids normalizes sodium absorption during acute colitis.30 Thus, the impaired absorption appears to be more related to active inflammation than remission.
Clinicians and researcher have been puzzled for a long time why up to 30% of patients still suffer from GI symptoms despite no signs of inflammation.2,3 Our results show that despite normal macroscopical morphology, the responsiveness of the colonic mucosa to induced secretion was different from that in control patients. In proximal colon, there was an up-regulated response to forskolin and a down-regulation of the carbachol response. Our results from the CftrΔF508 mice and other studies in patients with cystic fibrosis show that loss of a functional CFTR reduces both the forskolin and the carbachol response, suggesting that the altered responsiveness observed in the UC patients is not directly linked to the activity of the CFTR channel, as this should have similar effects on both the forskolin and CCh responses.31,32 Furthermore, as the altered responsiveness was restricted to the proximal colon, this cannot be general consequence of previous inflammation. On the contrary, the capacitance response to carbachol was up-regulated, suggesting that the epithelium is hyperresponsive to induced mucus secretion. This means that despite morphological recovery, the mucosa of UC patients in remission retains a “functional scar” making the proximal colon hyperreactive to agonists of the cAMP system and hyporeactive to agonist of the Ca2+ system, and the goblet cells of the distal colon hyperreactive to muscarinic mucus secretion.
The finding of an up-regulated electrogenic secretion is not unique to our study. Increased anion secretion had been reported to occur in microscopic and collagenous colitis, conditions associated with a low-grade inflammation.4,5 Also, chronic exposure to mast cells has been shown to induce a hyperreactive response to secretagogues in cultured epithelial cells.33
The most likely functional consequence of the hyperreactivity of the CFTR system in the proximal colon is an increased fluid load in the distal colon. Depending on the magnitude of this increased fluid load, this might in fact account for the observation that a substantial proportion of UC patients in remission still have diarrheal problems. It has been shown that the colonic epithelium has the ability to absorb up to 4 L of fluid before normal subjects notice diarrhea symptoms, but for predisposed persons with a mild chronic inflammation in the distal colon, increased secretion from the proximal colon will cause additional problems.2 One of the pathophysiological models for UC is that there is an underlying increased reactivity of the mucosal immune system toward the commensal flora. If this is true, an up-regulation of the secretory system could be functional by flushing the epithelium and reducing the bacterial–epithelial interaction.
Functional implications for an up-regulated mucin secretory response are more difficult to understand as less is known about the connection between colonic anion and mucus secretion. It is well established that CFTR-mediated secretion is important for formation of a normal mucus layer in the small intestine and that loss of CFTR-mediated secretion results in mucus accumulation in the airways, thus the balance between anion and mucus secretion can affect mucus properties.34,35 However, there are no results supporting that an excessive chloride or bicarbonate secretion further improves the quality of the formed mucus layer. The down-regulated secretory response to carbachol in the proximal colon would suggest that the coordinated secretion of fluid ion and mucus is shifted toward reduced ion secretion in relation to mucus secretion. This could possibly affect mucus properties, but the role of carbachol-mediated secretion in regulating colonic mucus properties remains to be explored.
The observation of an up-regulation of the capacitance response to carbachol points to a similar shift toward more mucus secretion. In colon, the mucus layer has a clear protective effect by limiting contact between the luminal bacteria and the epithelium.36 Therefore, a faster response could have a protective role by preventing harmful agents to come in contact with the epithelial surface. However, if the system is pushed to secrete more than the synthesis machinery allows, this might result in mucus depletion and compromise the protective functions of the mucus layer.
In conclusion, our data imply that despite normal basal electrical parameters, the colonic mucosa from UC patients in remission appears to have an increased reactivity of the CFTR system in the proximal colon and increased goblet cells exocytosis in distal colon. Both these phenomena may represent adaptive changes to minimize the risk for bacterial – epithelial interactions, but, if driven too far, might cause diarrhea.
Supplementary Material
Figure S1. Forskolin effect on membrane current in mouse colon. (A) Total response over time in the proximal colon of WT (n = 5) and CF (n = 3) mice. (B) Delta max response in mouse proximal colon. (C) Total response over time in the distal colon of WT (n = 5) and CF (n = 4) mice. (D) Delta max response in mouse distal colon. Data are presented as mean ± SEM, *P < 0.05, ***P < 0.001.
Figure S2. Carbachol effect on membrane current in mouse colon. (A) Total response over time in the proximal colon of WT (n = 6) and CF (n = 9) mice. (B) Delta max response to CCh in mouse proximal colon. (C) Total response over time in the distal colon of WT (n = 9) and CF (n = 9) mice. (D) Delta response to CCh divided into peak response and sustained response. Peak response: Max value – baseline; sustained response: average of two last recordings – baseline. Data are presented as mean ± SEM, *P < 0.05, ***P < 0.001.
Acknowledgments
We acknowledge Drs. Anna Velcich and Bob J. Scholte for the Muc2−/− and CftrΔF508 animals, respectively.
FUNDING
This work was supported by the Swedish Research Council (no. 7461, 8288, 21027, and 342-2004-4434), The Knut and Alice Wallenberg Foundation (KAW2007.0118), IngaBritt and Arne Lundberg Foundation, Sahlgren’s University Hospital (LUA-ALF), Wilhelm and Martina Lundgren’s Foundation, Torsten and Ragnar Sö derbergs Foundations, The Swedish Foundation for Strategic Research – The Mucosal Immunobiology and Vaccine Center (MIVAC) and the Mucus-Bacteria-Colitis Center (MBC) of the Innate Immunity Program (2010–2014).
Abbreviations
- CCh
carbachol
- CF
Cftr ΔF508
- CFTR
cystic fibrosis transmembrane conductance regulator
- Cp
epithelial capacitance
- Im
net membrane current
- Muc2
mucin 2
- Rp
epithelial resistance
- UC
ulcerative colitis
Footnotes
DISCLOSURES
The authors have no conflicts of interest to disclose.
AUTHOR CONTRIBUTION
JKG collected the data. JKG and HS designed the study, analyzed and interpreted the data, and wrote the manuscript. GCH provided the CftrΔF508 and Muc2−/− mice, and GCH revised the manuscript critically for intellectual content.
SUPPORTING INFORMATION
Additional Supporting Information may be found in the online version of this article:
Please note: Wiley-Blackwell are not responsible for the content or functionality of any supporting materials supplied by the authors. Any queries (other than missing material) should be directed to the corresponding author for the article.
References
- 1.Lewis JD, Chuai S, Nessel L, Lichtenstein GR, Aberra FN, Ellenberg JH. Use of the noninvasive components of the Mayo score to assess clinical response in ulcerative colitis. Inflamm Bowel Dis. 2008;14:1660–6. doi: 10.1002/ibd.20520. [DOI] [PMC free article] [PubMed] [Google Scholar]
- 2.Simren M, Axelsson J, Gillberg R, Abrahamsson H, Svedlund J, Bjornsson ES. Quality of life in inflammatory bowel disease in remission: the impact of IBS-like symptoms and associated psychological factors. Am J Gastroenterol. 2002;97:389–96. doi: 10.1111/j.1572-0241.2002.05475.x. [DOI] [PubMed] [Google Scholar]
- 3.Isgar B, Harman M, Kaye MD, Whorwell PJ. Symptoms of irritable bowel syndrome in ulcerative colitis in remission. Gut. 1983;24:190–2. doi: 10.1136/gut.24.3.190. [DOI] [PMC free article] [PubMed] [Google Scholar]
- 4.Burgel N, Bojarski C, Mankertz J, Zeitz M, Fromm M, Schulzke JD. Mechanisms of diarrhea in collagenous colitis. Gastroenterology. 2002;123:433–43. doi: 10.1053/gast.2002.34784. [DOI] [PubMed] [Google Scholar]
- 5.Protic M, Jojic N, Bojic D, et al. Mechanism of diarrhea in microscopic colitis. World J Gastroenterol. 2005;11:5535–9. doi: 10.3748/wjg.v11.i35.5535. [DOI] [PMC free article] [PubMed] [Google Scholar]
- 6.Specian RD, Neutra MR. Mechanism of rapid mucus secretion in goblet cells stimulated by acetylcholine. J Cell Biol. 1980;85:626–40. doi: 10.1083/jcb.85.3.626. [DOI] [PMC free article] [PubMed] [Google Scholar]
- 7.Welsh MJ, Smith PL, Fromm M, Frizzell RA. Crypts are the site of intestinal fluid and electrolyte secretion. Science. 1982;218:1219–21. doi: 10.1126/science.6293054. [DOI] [PubMed] [Google Scholar]
- 8.Bennett A. Pharmacology of colonic muscle. Gut. 1975;16:307–11. doi: 10.1136/gut.16.4.307. [DOI] [PMC free article] [PubMed] [Google Scholar]
- 9.Dharmsathaphorn K, Pandol SJ. Mechanism of chloride secretion induced by carbachol in a colonic epithelial cell line. J Clin Invest. 1986;77:348–54. doi: 10.1172/JCI112311. [DOI] [PMC free article] [PubMed] [Google Scholar]
- 10.Dharmsathaphorn K, Mandel KG, Masui H, McRoberts JA. Vasoactive intestinal polypeptide-induced chloride secretion by a colonic epithelial cell line. Direct participation of a basolaterally localized Na+, K+, Cl-cotransport system. J Clin Invest. 1985;75:462–71. doi: 10.1172/JCI111721. [DOI] [PMC free article] [PubMed] [Google Scholar]
- 11.Qu F, Liu HJ, Xiang Y, et al. Activation of CFTR trafficking and gating by vasoactive intestinal peptide in human bronchial epithelial cells. J Cell Biochem. 2011;112:902–8. doi: 10.1002/jcb.22999. [DOI] [PubMed] [Google Scholar]
- 12.Bertrand CA, Danahay H, Poll CT, Laboisse C, Hopfer U, Bridges RJ. Niflumic acid inhibits ATP-stimulated exocytosis in a mucin-secreting epithelial cell line. Am J Physiol Cell Physiol. 2004;286:C247–55. doi: 10.1152/ajpcell.00593.2002. [DOI] [PubMed] [Google Scholar]
- 13.Danahay H, Atherton HC, Jackson AD, Kreindler JL, Poll CT, Bridges RJ. Membrane capacitance and conductance changes parallel mucin secretion in the human airway epithelium. Am J Physiol Lung Cell Mol Physiol. 2006;290:L558–69. doi: 10.1152/ajplung.00351.2005. [DOI] [PubMed] [Google Scholar]
- 14.Velcich A, Yang W, Heyer J, et al. Colorectal cancer in mice genetically deficient in the mucin Muc2. Science. 2002;295:1726–9. doi: 10.1126/science.1069094. [DOI] [PubMed] [Google Scholar]
- 15.van Doorninck JH, French PJ, Verbeek E, et al. A mouse model for the cystic fibrosis delta F508 mutation. EMBO J. 1995;14:4403–11. doi: 10.1002/j.1460-2075.1995.tb00119.x. [DOI] [PMC free article] [PubMed] [Google Scholar]
- 16.Hemlin M, Jodal M, Lundgren O, Sjovall H, Stage L. The importance of the subepithelial resistance for the electrical properties of the rat jejunum in vitro. Acta Physiol Scand. 1988;134:79–88. doi: 10.1111/j.1748-1716.1988.tb08462.x. [DOI] [PubMed] [Google Scholar]
- 17.Clarke LL, Grubb BR, Gabriel SE, Smithies O, Koller BH, Boucher RC. Defective epithelial chloride transport in a gene-targeted mouse model of cystic fibrosis. Science. 1992;257:1125–8. doi: 10.1126/science.257.5073.1125. [DOI] [PubMed] [Google Scholar]
- 18.Mall M, Bleich M, Schurlein M, et al. Cholinergic ion secretion in human colon requires coactivation by cAMP. Am J Physiol. 1998;275(6 Pt 1):G1274–81. doi: 10.1152/ajpgi.1998.275.6.G1274. [DOI] [PubMed] [Google Scholar]
- 19.Matos JE, Sausbier M, Beranek G, Sausbier U, Ruth P, Leipziger J. Role of cholinergic-activated KCa1.1 (BK), KCa3.1 (SK4) and KV7.1 (KCNQ1) channels in mouse colonic Cl- secretion. Acta Physiol (Oxf) 2007;189:251–8. doi: 10.1111/j.1748-1716.2006.01646.x. [DOI] [PubMed] [Google Scholar]
- 20.Mall M, Wissner A, Seydewitz HH, et al. Defective cholinergic Cl(−) secretion and detection of K(+) secretion in rectal biopsies from cystic fibrosis patients. Am J Physiol Gastrointest Liver Physiol. 2000;278:G617–24. doi: 10.1152/ajpgi.2000.278.4.G617. [DOI] [PubMed] [Google Scholar]
- 21.Poulsen JH, Fischer H, Illek B, Machen TE. Bicarbonate conductance and pH regulatory capability of cystic fibrosis transmembrane conductance regulator. Proc Natl Acad Sci USA. 1994;91:5340–4. doi: 10.1073/pnas.91.12.5340. [DOI] [PMC free article] [PubMed] [Google Scholar]
- 22.Bertrand CA, Durand DM, Saidel GM, Laboisse C, Hopfer U. System for dynamic measurements of membrane capacitance in intact epithelial monolayers. Biophys J. 1998;75:2743–56. doi: 10.1016/S0006-3495(98)77718-5. [DOI] [PMC free article] [PubMed] [Google Scholar]
- 23.Jakab RL, Collaco AM, Ameen NA. Physiological relevance of cell-specific distribution patterns of CFTR, NKCC1, NBCe1, and NHE3 along the crypt-villus axis in the intestine. Am J Physiol Gastrointest Liver Physiol. 2011;300:G82–98. doi: 10.1152/ajpgi.00245.2010. [DOI] [PMC free article] [PubMed] [Google Scholar]
- 24.Bertrand CA, Laboisse CL, Hopfer U. Purinergic and cholinergic agonists induce exocytosis from the same granule pool in HT29-Cl.16E monolayers. Am J Physiol. 1999;276(4 Pt 1):C907–14. doi: 10.1152/ajpcell.1999.276.4.C907. [DOI] [PubMed] [Google Scholar]
- 25.Arai T, Kino I. Morphometrical and cell kinetic studies of normal human colorectal mucosa. Comparison between the proximal and the distal large intestine. Acta Pathol Jpn. 1989;39:725–30. doi: 10.1111/j.1440-1827.1989.tb02421.x. [DOI] [PubMed] [Google Scholar]
- 26.Hirota CL, McKay DM. Loss of Ca-mediated ion transport during colitis correlates with reduced ion transport responses to a Ca-activated K channel opener. Br J Pharmacol. 2009;156:1085–97. doi: 10.1111/j.1476-5381.2009.00122.x. [DOI] [PMC free article] [PubMed] [Google Scholar]
- 27.Greig ER, Boot-Handford RP, Mani V, Sandle GI. Decreased expression of apical Na+ channels and basolateral Na+, K+-ATPase in ulcerative colitis. J Pathol. 2004;204:84–92. doi: 10.1002/path.1613. [DOI] [PubMed] [Google Scholar]
- 28.Sandle GI, Higgs N, Crowe P, Marsh MN, Venkatesan S, Peters TJ. Cellular basis for defective electrolyte transport in inflamed human colon. Gastroenterology. 1990;99:97–105. doi: 10.1016/0016-5085(90)91235-x. [DOI] [PubMed] [Google Scholar]
- 29.Silva P, Stoff J, Field M, Fine L, Forrest JN, Epstein FH. Mechanism of active chloride secretion by shark rectal gland: role of Na-K-ATPase in chloride transport. Am J Physiol. 1977;233:F298–306. doi: 10.1152/ajprenal.1977.233.4.F298. [DOI] [PubMed] [Google Scholar]
- 30.Sandle GI, Hayslett JP, Binder HJ. Effect of glucocorticoids on rectal transport in normal subjects and patients with ulcerative colitis. Gut. 1986;27:309–16. doi: 10.1136/gut.27.3.309. [DOI] [PMC free article] [PubMed] [Google Scholar]
- 31.Hirtz S, Gonska T, Seydewitz HH, et al. CFTR Cl- channel function in native human colon correlates with the genotype and phenotype in cystic fibrosis. Gastroenterology. 2004;127:1085–95. doi: 10.1053/j.gastro.2004.07.006. [DOI] [PubMed] [Google Scholar]
- 32.Bronsveld I, Mekus F, Bijman J, et al. Chloride conductance and genetic background modulate the cystic fibrosis phenotype of Delta F508 homozygous twins and siblings. J Clin Invest. 2001;108:1705–15. doi: 10.1172/JCI12108. [DOI] [PMC free article] [PubMed] [Google Scholar]
- 33.Barrett KE. Immune-related intestinal chloride secretion. III. Acute and chronic effects of mast cell mediators on chloride secretion by a human colonic epithelial cell line. J Immunol. 1991;147:959–64. [PubMed] [Google Scholar]
- 34.Garcia MA, Yang N, Quinton PM. Normal mouse intestinal mucus release requires cystic fibrosis transmembrane regulator-dependent bicarbonate secretion. J Clin Invest. 2009;119:2613–22. doi: 10.1172/JCI38662. [DOI] [PMC free article] [PubMed] [Google Scholar]
- 35.Grubb BR, Gabriel SE. Intestinal physiology and pathology in genetargeted mouse models of cystic fibrosis. Am J Physiol. 1997;273(2 Pt 1):G258–66. doi: 10.1152/ajpgi.1997.273.2.G258. [DOI] [PubMed] [Google Scholar]
- 36.Johansson ME, Phillipson M, Petersson J, Velcich A, Holm L, Hansson GC. The inner of the two Muc2 mucin-dependent mucus layers in colon is devoid of bacteria. Proc Natl Acad Sci USA. 2008;105:15064–9. doi: 10.1073/pnas.0803124105. [DOI] [PMC free article] [PubMed] [Google Scholar]
Associated Data
This section collects any data citations, data availability statements, or supplementary materials included in this article.
Supplementary Materials
Figure S1. Forskolin effect on membrane current in mouse colon. (A) Total response over time in the proximal colon of WT (n = 5) and CF (n = 3) mice. (B) Delta max response in mouse proximal colon. (C) Total response over time in the distal colon of WT (n = 5) and CF (n = 4) mice. (D) Delta max response in mouse distal colon. Data are presented as mean ± SEM, *P < 0.05, ***P < 0.001.
Figure S2. Carbachol effect on membrane current in mouse colon. (A) Total response over time in the proximal colon of WT (n = 6) and CF (n = 9) mice. (B) Delta max response to CCh in mouse proximal colon. (C) Total response over time in the distal colon of WT (n = 9) and CF (n = 9) mice. (D) Delta response to CCh divided into peak response and sustained response. Peak response: Max value – baseline; sustained response: average of two last recordings – baseline. Data are presented as mean ± SEM, *P < 0.05, ***P < 0.001.