

Abstract
A series of tetranuclear iron complexes displaying a site-differentiated metal center were synthesized. Three of the metal centers are coordinated to our previously reported ligand, based on a 1,3,5-triarylbenzene motif with nitrogen and oxygen donors. The fourth (apical) iron center is coordinatively unsaturated and appended to the trinuclear core through three bridging pyrazolates and an interstitial μ4-oxide moiety. Electrochemical studies of complex [LFe3(PhPz)3OFe][OTf]2 revealed three reversible redox events assigned to the FeII4/FeII3FeIII (−1.733 V), FeII3FeIII/FeII2FeIII2 (−0.727 V), and FeII2FeIII2/FeIIFeIII3 (0.018 V) redox-couples. Complexes in all redox states were isolated, and three were characterized structurally by single crystal X-ray diffraction. Combined Mössbauer spectroscopic and crystallographic studies indicate that the change in oxidation state is exclusively localized at the triiron core, without changing the oxidation state of the apical metal center. This phenomenon is assigned to differences in the coordination environment of the two metal sites in the cluster, and provides a strategy for storing electron and hole equivalents without affecting the oxidation state of the coordinatively unsaturated metal. The presence of an additional single ligand-binding site allowed for study of the effect of redox modulation on nitric oxide activation by an FeII metal center. Treatment of the clusters with nitric oxide resulted in binding of NO to the apical iron center generating a {FeNO}7 moiety. As with the NO-free precursors, three reversible redox events are observed electrochemically and are localized at the iron centers distal from the NO ligand. Altering the redox state of the triiron core resulted in significant change in the NO stretching frequency, by as much as 100 cm−1, indicative of NO activation modulated by remote metal centers. The increased activation of NO is attributed to structural changes within the clusters, in particular related to the interaction of the metal centers with the interstitial atom. The differences in NO activation were further shown to lead to differential reactivity, with NO disproportionation with N2O formation performed by the more electron rich cluster.
I. Introduction
Challenging chemical transformations involving the transfer of multiple electrons and protons are commonly catalyzed in living organisms by proteins that display multiple metals in the active site.1 One such example is the oxidation of H2O to O2 by the oxygen-evolving complex (OEC) in photosystem II (PSII).2 The active site consists of a mixed manganese-calcium cubane [Mn4CaOn],1d,3 which cycles through five oxidation states upon photo-excitation (S-states).4 These successive oxidations culminate in the oxidation of water with subsequent release of dioxygen.1d,2-4 Other proteins that feature multinuclear active sites include hydrogenase,5 CO dehydrogenase,6 laccases,1c,7 acetyl-CoA synthase,8 Cytochrome c oxidase,9 and nitrogenase.1-2,10 Although Mn features preeminently as a example of biological multi-electron catalysis, Fe is encountered in most other multinuclear active sites mentioned above for the reduction of H2O to H2, of CO2 to CO, of N2 to NH3, and of O2 to H2O. The nitrogenase enzyme family is notable for the number of electrons (six) required for the transformation of N2 to NH3 and for the number of metals centers (eight) present in the active site, with seven of them being iron in all isoforms.1a,10e,11 The presence of multi-metallic active sites has inspired mechanistic proposals that invoke metal-metal cooperativity in substrate activation5-8 or product formation2-4. The ability to store multiple redox equivalents and to tune reduction potentials have also been explored for multimetallic active sites.12 When the proposed site of substrate binding consists of a single metal within a multimetallic assembly, the other non-coordinating metals have – in some cases – been speculated to alter the geometry of the bridging ligands or influence the electronics of the multimetallic assembly in order to affect substrate conversion.1g,8a
Despite a wealth of studies, the respective mechanisms of several multimetallic active sites remain under debate.
Investigating the roles that these metals play in multimetallic active sites, is important for understanding their contribution to (i) substrate binding and activation, (ii) redox tuning, (iii) storage of redox equivalents, or (iv) electron shuttling. Furthermore, such an investigation is instrumental for obtaining a detailed mechanistic picture and/or for designing artificial catalysts. Modeling chemistry has been challenging due to the complexity of multimetallic targets.
Our group and others have targeted (multi-nuclear) metal complexes that – conceptually – help understanding the various aspects involved in the functioning of the active sites of a wide variety of enzymes.13 We have studied the effects of redox-inactive metals as part of redox-active transition metal clusters, a topic of interest in the context of the role of calcium in the OEC.12,14 Access to hetero- and homonuclear clusters was achieved rationally via a stepwise route starting from trinuclear precursors.15 It was demonstrated that the redox potential of these metal cluster correlates linearly with the Lewis acidity of the fourth redox-inactive or redox-active metal, providing a strategy for redox tuning of the cluster.12 A related question concerns the effect of redox-active metals on reactivity, and in particular; the effect of oxidation state changes on small molecule activation at a remote positions in the cluster. To address this question, we designed a new class of metal clusters that display multiple, reversible redox events and that are site-differentiated to allow for separation of the location of redox changes and small molecule binding (Figure 1).
Figure 1.
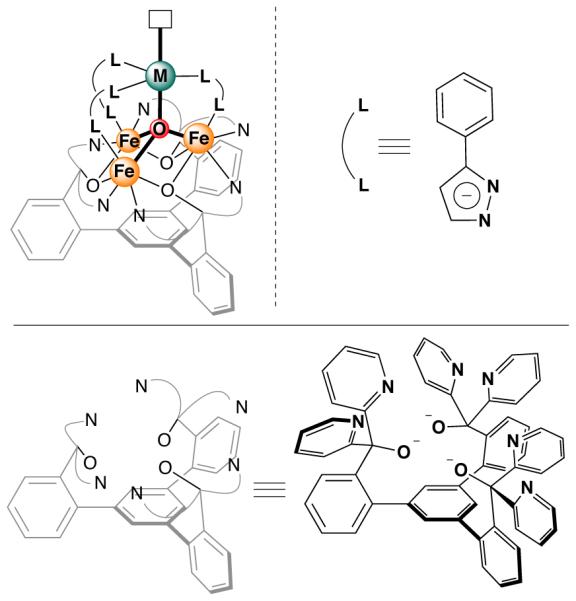
General molecular structure of tetranuclear clusters (top left) reported here, supported by pyrazolates (top right) and a 1,3,5-triarylbenzene-based ligand (bottom).
Herein, we present the synthesis of site-differentiated tetranuclear iron clusters. The apical metal site (green) is four-coordinate, with a trigonal pyramidal geometry prone to bind a variety of small molecules.16 The “bottom” metal sites (orange) are coordinatively saturated, and are known to undergo redox changes in related clusters.12b The four-coordinate apical iron center is sufficiently different that electron transfer processes exclusively limited to the triiron core. Exposing the metal clusters to nitric oxide (NO) results in coordination of NO the apical iron center in three of the four redox states of the cluster. With the apical metal maintaining the same oxidation state, the effect of distal redox changes on NO activation was investigated based on variation of the NO stretching frequency. The changes in νNO, as high as 100 cm−1, demonstrate that remote redox changes can have a significant influence on small molecules bound to the cluster. The mechanism of redox modulation is discussed, and their effect on chemical reactivity is investigated.
II. Results and Discussion
Given the precedent for small molecule activation at metal centers supported by equatorial nitrogen donors,16 we sought to synthesize tetranuclear iron clusters – with pyrazolates as bridging ligands – to generate a trigonal pyramidal environment around the apical metal. Starting from the recently reported triiron precursor LFe3(OAc)3 (1),15 one-pot procedures proved unsuccessful to install all three pyrazolate donors, most likely due to the strong binding of the three acetates to the triiron core. Less coordinating anions were envisioned to result in a more reactive precursor. Treatment of 1 with excess MeOTf (OTf = trifluoromethanesulfonate) leads to the formation of a new species according to the 1H NMR spectrum (Figure S3). Even though an excess of MeOTf was used, subsequent reactivity suggests the presence of some acetate anion. This species was thus assigned as having a stoichiometry of LFe3(OTf)2(OAc), although elemental analysis is indicative of complete substitution of acetate with triflates.
Addition of a slight excess of sodium phenylpyrazolate (3.3 equiv.) to LFe3(OTf)2(OAc) followed by treatment with iodosobenzene (PhIO, 1.0 equiv.) resulted in the formation of a new species with 1H NMR spectrum that is paramagnetically shifted over 100 ppm (Figure S4). Electrospray ionization mass spectrometry (ESI-MS) analysis of an aliquot taken from the crude reaction mixture shows a peak at m/z = 1491.0, consistent with the in situ formation of [LFe3(PhPz)3ONa][OTf] (Figure S5; m/z = 1491.3, PhPz = 3-phenylpyrazolate). Addition of Fe(OTf)2 (2.0 equiv.) to this reaction mixture yielded the tetranuclear complex [LFe3(PhPz)2OFe][OTf]2 (4) in ~50% isolated yield. Although these – and subsequent reported complexes – are paramagnetic, the 1H NMR spectra display characteristic resonances that allow facile identification of the parent complexes (Figures S6–S8 and S17–S19).
Crystals of 4 – suitable for single crystal X-ray diffraction (XRD) – were grown by vapor diffusion of diethyl ether into a concentrated solution of 4 in acetonitrile. Complex 4 features a single dication in the asymmetric unit, with two outer-sphere triflates (Figure 2). The coordination environment around the apical iron metal center (Fe4) is trigonal pyramidal, with the three pyrazolate nitrogen donors (N14, N24, and N34) forming a trigonal plane (Figure 2 and 4A). The Fe4–Npz bond distances range from 2.065(4) – 2.095(4) Å, with near identical Fe–N–N angles (Table 1). The apical iron center is connected to the triiron core through a μ4-oxide moiety (O1), resulting in a [Fe4(μ4-O)] core. The Fe1– O1, Fe2–O1, and Fe3–O1 bond distances of 2.069(2), 1.998(2), and 1.932(2) Å, are indicative of a [FeIIFeIII2] triiron core (Table 1). These observations are consistent with other tetrametallic complexes, where reduction of a triiron core (FeIII3 → FeIIFeIII2) resulted in the lengthening of one of the Fe–O1 bond distances.12b Together with the presence of two outer sphere triflates, the formal oxidation state of the complex is thus assigned as [LFeIIFeIII2 (PhPz)3OFeII]2+. The presence of a μ4-oxido is a common bridging motif in variety of reported clusters,17 and presence of a [Fe4(μ4-O)] core has been described in the literature as a part of numerous polynuclear complexes (M > 4).17-18 In contrast, to the best of our knowledge the presence of a discrete of [Fe4(μ4-O)] core is quite rare. To date only a handful of complexes have been reported that feature such a moiety.17c,18-19
Figure 2.

Synthesis (top) and crystal structure (bottom) of tetranuclear complex [LFe3(PhPz)3OFe][OTf]2 (4). Solvents, outersphere counter ions, and hydrogen atoms are omitted for clarity. Thermal ellipsoids are shown at the 50% probability level.
Figure 4.

(A) Truncated molecular structure of [LFe3(PhPz)3OFe][OTf]2, with thermal ellipsoids at the 50% probability level. Portions of the ligand (L), hydrogen atoms, outer sphere counter ions, and solvents molecules are not shown for clarity. (B-C) X-ray structural parameters of the [Fe4(μ4-O)] core in complexes 3–5. (E-G) Zero-field 57Fe Mössbauer spectra at 80 K of (E) [LFe3(PhPz)3OFe][OTf] (black dots) with simulated parameters; (i) δ = 0.472 mm/s, |ΔEQ|= 1.188 mm/s (solid orange trace); (ii) δ = 1.121 mm/s, |ΔEQ|= 3.172 mm/s (dashed blue trace); (iii) δ = 1.128 mm/s, |ΔEQ|= 3.569 mm/s (solid blue trace); and (iv) δ = 0.953 mm/s, |ΔEQ|= 2.074 mm/s (solid green trace). (F) [LFe3(PhPz)3OFe][OTf]2 (black dots) with simulated parameters; i) δ = 0.431 mm/s, |ΔEQ|= 0.413 mm/s (dashed orange trace); (ii) δ = 0.475 mm/s, |ΔEQ|= 0.927 mm/s (solid orange trace); (iii) δ = 1.138 mm/s, |ΔEQ|= 3.190 mm/s (solid blue trace); and (iv) δ = 0.859 mm/s, |ΔEQ|= 1.563 mm/s (solid green trace), and (G) [LFe3(PhPz)3OFe][OTf]3 (black dots) with simulated parameters; i) δ = 0.394 mm/s, |ΔEQ|= 0.667 mm/s (dashed orange trace); (ii) δ = 0.442 mm/s, |ΔEQ|= 0.966 mm/s (dotted orange trace); (iii) δ = 0.501 mm/s, |ΔEQ|= 0.662 mm/s (solid orange trace); and (iv) δ = 0.811 mm/s, |ΔEQ|= 1.089 mm/s (solid green trace). The grey line is a spectral fit of the data.
Table 1.
Selected bond angles and distances for complexes 3-8.
| Bond Distance (Å) | Complex | |||||
|---|---|---|---|---|---|---|
|
| ||||||
| 3 | 4 | 5 | 6 | 7 | 8 | |
|
|
||||||
| Fe1–O1 | 2.073(3) | 2.069(2) | 1.984(2) | 2.113(2) | 2.184(3) | 1.979(5) |
| Fe2–O1 | 2.088(3) | 1.998(2) | 1.966(2) | 2.070(2) | 1.928(3) | 1.995(5) |
| Fe3–O1 | 1.894(3) | 1.932(2) | 1.976(2) | 1.952(2) | 1.944(3) | 2.004(5) |
| Fe4–O1 | 1.908(3) | 1.971(2) | 2.031(2) | 1.968(2) | 2.035(3) | 2.087(5) |
| Fe1–N13 | 2.146(4) | 2.120(2) | 2.057(2) | 2.134(3) | 2.103(3) | 2.065(6) |
| Fe2–N23 | 2.161(3) | 2.111(3) | 2.060(3) | 2.117(3) | 2.091(3) | 2.033(6) |
| Fe3–N33 | 2.130(4) | 2.083(3) | 2.054(3) | 2.129(3) | 2.073(3) | 2.040(7) |
| Fe4–N14 | 2.065(4) | 2.046(3) | 2.048(3) | 2.124(3) | 2.054(3) | 2.068(6) |
| Fe4–N24 | 2.067(4) | 2.065(3) | 2.061(3) | 2.068(3) | 2.098(3) | 2.082(7) |
| Fe4–N34 | 2.095(4) | 2.064(3) | 2.054(3) | 2.108(3) | 2.081(3) | 2.062(7) |
| N13–N14 | 1.387(5) | 1.387(4) | 1.388(3) | 1.382(3) | 1.378(5) | 1.358(9) |
| N23–N24 | 1.387(5) | 1.392(4) | 1.380(4) | 1.381(3) | 1.276(5) | 1.387(9) |
| N33–N34 | 1.390(5) | 1.390(4) | 1.383(3) | 1.384(2) | 1.380(5) | 1.38(1) |
| Fe4–N40 | - | - | - | 1.774(3) | 1.772(4) | 1.763(7) |
| N40–O40 | - | - | - | 1.157(3) | 1.144(5) | 1.144(8) |
|
|
||||||
| Bond Angles (°) | ||||||
|
|
||||||
| N14–Fe4–N24 | 119.92(15) | 119.12(11) | 119.35(10) | 118.1(1) | 117.4(1) | 119.1(3) |
| N24–Fe4–N34 | 119.06(14) | 120.13(11) | 118.00(10) | 115.7(1) | 126.0(1) | 120.3(3) |
| N34–Fe4–N14 | 120.27(14) | 120.66(11) | 122.37(10) | 124.5(1) | 114.3(1) | 115.9(3) |
| O1–Fe4–N40 | - | - | - | 175.6(1) | 175.9(1) | 177.8(3) |
| Fe4–N40–O40 | - | - | - | 169.6(3) | 171.4(4) | 171.9(7) |
|
|
||||||
| Torsion Angles (°) | ||||||
|
|
||||||
| Fe1–N13–N14–Fe4 | −2.1(4) | 3.8(3) | 1.5(3) | 15.4(3) | −20.4(4) | 31.9(6) |
| Fe2–N23–N24–Fe4 | −3.2(4) | −1.4(3) | −2.7(3) | 17.6(3) | 12.9(4) | 21.5(7) |
| Fe3–N33–N34–Fe4 | −1.6(4) | −1.1(3) | 1.1(3) | 28.9(3) | 27.8(4) | 20.1(9) |
|
|
||||||
| Centroid Distances (Å) | ||||||
|
|
||||||
| Fe1|Fe2|Fe3 – N14|N24|N34 | 2.973 | 2.947 | 2.870 | 2.862 | 2.811 | 2.750 |
| Fe1|Fe2|Fe3 – O11|O21|O31 | 1.069 | 1.086 | 1.083 | 1.092 | 1.085 | 1.058 |
| Fe1|Fe2|Fe3 – O1 | 0.969 | 0.943 | 0.888 | 1.057 | 0.999 | 0.921 |
| N14|N24|N34 – Fe4 | 0.105 | 0.037 | 0.059 | 0.166 | 0.222 | 0.260 |
In order to test the accessibility of other redox states of this cluster, the electrochemical properties of 4 were investigated by cyclic voltammetry (CV). The CV of complex 4 (Figure 3) displays three reversible one-electron redox-events at −1.733, −0.727, and 0.018 V (vs. Fc/Fc+). These oxidation/reduction waves are assigned to the FeII4/FeII3FeIII (−1.733 V), FeII3FeIII/FeII2FeIII2 (−0.727 V), and FeII2FeIII2/FeIIFeIII3 (0.018 V) redox-couples respectively. Interestingly, the oxidation from FeII to FeIII of the fourth iron center is not observed, even at a potential of + 1.0 V vs. Fc/Fc+. The large number of accessible redox states in 4 is nonetheless notable for tetranuclear clusters.
Figure 3.
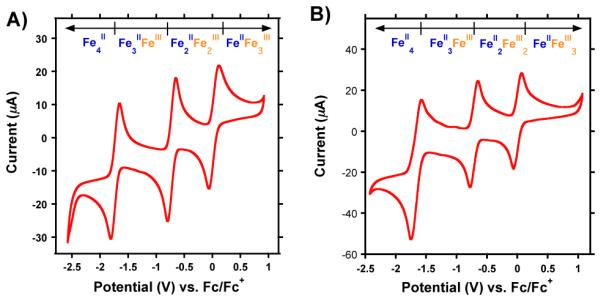
Cyclic voltammograms (CVs) of [LFe3(PhPz)3OFe][OTf]2 (A) and [LFe3(PhPz)3OFeNO][OTf]2 (B) at a scan rate of 100 mV s−1. CV’s were recorded in CH2Cl2 at a concentration of 2 mM, with glassy carbon, Pt-wire, and Ag-wire as working, counter, and reference electrode, respectively. nBu4NPF6 (0.1 M) was used as supporting electrolyte. The measured open circuit potential (OCP) was ca. 0.0 V for both complexes.
Until now, a discrete [Fe4(μ4-O)] core capable of supporting four oxidation states has not yet been reported. Even in biology, while iron-sulfur clusters can exist in several oxidation states, they usually utilize only a single redox-couple as shown by ferredoxins and high potential iron-sulfur proteins.20 Synthetic iron-sulfur clusters are known to access multiple oxidation states.20-21 Hexanuclear complexes with multiple reversible metal-based redox-events (≥ 3) have been reported as well.22 For example, a hexanuclear iron cluster has been shown to support up to five redox events spanning a potential window of only 1.3 V.22b Recently reported bimetallic complexes of first-row transition metals exhibited multiple redox-events as well, in contrast to their monometallic counterparts.23 Other notable examples include mononuclear complexes of the type [M(bpy)3]n (n = 3+, 2+, 1+, 1−, 2−, and 3−), although in these cases many of the redox-events are ligand based.24
Having established the electrochemical properties, attempts were made to chemically oxidize/reduce complex 4 in order to isolate the putative complexes [LFe3(PhPz)3OFe] (2), [LFe3(PhPz)3OFe][OTf] (3) and [LFe3(PhPz)3OFe][OTf]3 (5). Reduction of complex 4 with 1.0 equiv. of cobaltocene (CoCp2) in CH2Cl2 for 2h, resulted in a color change from yellow-brown to red-purple. The 1H NMR spectrum changes significantly and is indicative of the formation of a new paramagnetic species (Figure S7). This species was identified as the one-electron reduced [LFe3(PhPz)3OFe][OTf] (3, PhPz = 3-phenylpyrazolate) by XRD (Scheme 1, Figure S33). Conversely, treatment of complex 4 with 1.0 equiv. of silver triflate (AgOTf) in CH2Cl2 for 2h, resulted in a paramagnetic species different from 3 or 4 (Figure S8). This new complex 5 was identified by XRD as the one-electron oxidized LFe3(PhPz)3OFe][OTf]3 (Scheme 1, Figure S34)). Based on our electrochemical studies, further reduction of complex 3 should be possible; (FeII4/FeII3FeIII at −1.733 V). Indeed, treating 3 with 1.0 equiv. of decamethylcobaltocene (CoCp*2) in THF, resulted in the formation of a blue precipitate that is insoluble in common organic solvents including DMF, MeCN, THF, DME, toluene, ether, and hexanes amongst others. The insolubility precluded us from obtaining a solution 1H NMR spectrum and X-ray quality crystals. However, further reactivity studies are consistent with retention of the same cluster core leading to an assignment of [LFe3(PhPz)3OFe] (Scheme 1, Figure S9–S11).
Scheme 1. Synthesis of Tetrairon Complexes 2-8.a.

aThe oxidation states of the iron metal centers are highlighted in blue (FeII) and orange (FeIII). The apical metal center is highlighted in green.
Definite structural assignments for complexes 3 and 5 were made on the basis of XRD. For crystallographic purposes, complex 3 was crystallized as the corresponding tetrafluoroborate (BF4−) salt (Figure S11 and S33). In complexes 3 and 5, the coordination environment around the apical iron metal center (Fe4) is trigonal pyramidal analogous to complex 4. The three pyrazolate nitrogen donors (N14, N24, and N34) form a trigonal plane with nearly identical Fe4–Npz bond distances irrespective of oxidation state (Figure S32-S34 and Table 1). The apical iron center is appended to the triiron core through a μ4-oxido (O1), as in complex 4. Analysis of the structural parameters indicates that sequential oxidation of complex 3 to 4 and 5 leads to significant elongation of the Fe4– O1 bond distances: 3, 1.908(3) Å; 4, 1.971(2) Å; 5, 2.0316(19) Å (Firgure 4A–D). This trend is correlated with a decrease in the [Fe1|Fe2|Fe3] centroid–O1 distance from 0.969 Å in 3 to 0.888 Å in 5 (Table 1). These changes are assigned to the increase in Lewis acid character of the triiron core upon oxidation, which leads to a stronger interaction with O1. In agreement, oxidation results in contraction of the Fe1–N13, Fe2–N23, and Fe3–N33 bond distances.
Other structural changes are found in the [Fe4(μ4-O)] core, which are dependent on the oxidation state of the metal centers (Figure 4A–D; Table 1).12b,12c For instance, in complex 3, the Fe1–O1 and Fe2–O1 distances (2.073(3) and 2.088(3) Å, respectively) are longer than Fe3–O1 (1.894(3) Å) indicative of FeII centers at the Fe1 and Fe2 positions and FeIII for Fe3. These bond distances are consistent with an [FeII2FeIII] oxidation state of the triiron core,12b and in line with our electrochemical and spectroscopic studies (vide supra). The one-electron oxidation of complex 3 leads to a considerable contraction of the Fe2–O1 distance from 2.088(3) Å in complex 3 to 1.998(2) in complex 4 (Figure 4C). Similarly, in complex 5, the Fe1–O1, Fe2–O1, and Fe3–O1 distances are nearly identical, consistent with a [FeIII3] core in complex 5 (Figure 4D). The change in bond-distances thus indicates that the triiron core shuttles between the oxidation states: [FeII3] ⇆ [FeII2FeIII] ⇆ [FeIIIFeIII2] ⇆ [FeIII3]. Consequently, the redox waves at-1.733, −0.727, and 0.018 V are assigned to redox events localized at the triiron core
The changes in redox-state of the iron metal centers were further investigated using zero-field 57Fe Mössbauer spectroscopy (Figures 4E-G; Table 2). The Mössbauer spectrum of complex 3 displays broad features that are best modeled as four quadrupole doublets in a 1:1:1:1 ratio, consistent with the presence for four4 inequivalent iron metal centers (Figure 4E). The nearly identical quadrupole doublets with isomer shifts of δ = 1.121 (dashed blue trace) and 1.128 (solid blue trace) mm/s, with quadrupole splitting of |ΔEQ| = 3.172 and 3.569 mm/s, respectively, are indicative of the presence of two high-spin ferrous ions.25 The assignment of the redox states in the triiron core as [FeII2FeIII] is completed by assigning the isomer shift at δ = 0.452 mm/s (solid orange trace) with a quadrupole splitting of |ΔEQ| = 1.188 mm/s as a high-spin ferric center.25 Metal clusters featuring a nearly identical [Fe4(μ4-O)] core, exhibit similar Mössbauer parameters for high-spin Fe centers.18,19b,25 Overall the observed Mössbauer parameters are in-line with other six-coordinate FeII/FeIII centers bearing N- and O-donor atoms.26 and nearly identical to those observed for the [FeII2FeIII] triiron core in our previously reported oxido/hydroxido scandium complex.12b The remaining quadrupole doublet at δ = 0.953 (solid green trace) with a quadrupole splitting of |ΔEQ| = 2.074 mm/s is indicative of a high-spin FeII metal center in a four-coordinate geometry, and is assigned to the apical Fe center.27
Table 2.
Mössbauer parameters for complexes 3-5.
| # | Complex | Parameters | ||
|---|---|---|---|---|
|
δ
(mm/s) |
| Δ Eq | (mm/s) |
% | ||
| 0.472 | 1.188 | 32 | ||
| 3 | [LFe3(PhPz)3OFe][OTf] | 1.121 | 3.172 | 25 |
| 1.128 | 3.569 | 21 | ||
| 0.953 | 2.074 | 32 | ||
| 0.431 | 0.413 | 26 | ||
| 4 | [LFe3(PhPz)3OFe][OTf]2 | 0.475 | 0.927 | 26 |
| 1.136 | 3.190 | 26 | ||
| 0.869 | 1.563 | 26 | ||
| 0.394 | 0.667 | 27 | ||
| 5 | [LFe3(PhPz)3OFe][OTf]3 | 0.442 | 0.966 | 27 |
| 0.501 | 0.662 | 27 | ||
| 0.811 | 1.089 | 27 | ||
With the Mössbauer spectrum of 3 assigned as [LFeII2FeIII(PhPz)3OFeII], the elucidation of oxidation states in complexes 4 and 5 is facile, given the similarities in the Mössbauer parameters (Figures 4F and G; Table 2). The Mössbauer spectrum of complex 4 is nearly identical to that of complex 3. The major difference is the shift of the quadrupole doublet at δ = 1.121 mm/s (Figure 4E; dashed blue trace) to δ = 0.431 mm/s, with a splitting of |ΔEQ| of 0.413 mm/s (Figure 2F; dashed orange trace). This shift is consistent with the oxidation from FeII to FeIII.12b An analogous shift is observed when oxidizing complex 4 to 5 with5 AgOTf, where now three nearly identical quadrupole doublets at δ = 0.394, 0.442, and 0.501 mm/s are present (Figure 2F, orange traces). Note that throughout the different oxidation states of the metal cluster, the quadruple double at ~ δ = 0.859 mm/s (green trace) remains virtually unchanged, indicating that electron transfer exclusively occurs at the triiron core. Such localized redox modulation is notable, with the apical metal maintaining the same oxidation state (FeII) between −2.5 and 1.0 V (vs. Fc/Fc+). This behavior is attributed to a greater propensity of the core Fe centers to be oxidized, due to the presence of electron rich alkoxide donors and higher coordination number. This localization of the electron transfer provides a conduit for storing electrons or holes without changing the oxidation state of the metal center that has a coordination site available for substrate binding.
However, the localized oxidation states of the metal clusters might be the results of XRD and Mössbauer measurements being performed at low temperatures (100 and 80 K). In order to determine if the oxidation states remain localized at higher temperatures, we have performed additional variable temperature (VT) XRD (100 and 298 K), Mössbauer (80, 100, 200, and 298 K), and NMR (203-293 K) studies, with complex 3 as representative example (Figure S12-S16, Table S1-S3). The X-ray structure at 298 K is very similar to that at 100 K (Figure S12). The Fe1–O1, Fe2–O1, and Fe3–O1 distances change from 2.082(3), 2.102(3), and 1.889(3) at 100 K, to 2.048(2), 2.068(2), and 1.954(3) at room temperature, while the Fe4–O1 bond distance remains virtually unchanged (Table S2). These results indicate that even at room temperature the oxidation states remain localized to the triiron core. However, some delocalization cannot be excluded, as some variations in the bond distances are present.
The VT zero-field 57Fe Mössbauer recorded at 80, 100, 200 K support these findings (Figure S13, S14, and Table S3). The Mössbauer spectrum of 3 collected at 80 K is similar to that of the analogous triflate salt, and shows four quadrupole doublets consistent with three high-spin FeII centers and a and a single high-spin FeIII center.25 Increasing the temperature from 80-293 K shows the expected loss of signal intensity due to the temperature dependence of the Lamb-Mossbauer factor.25 Simulating each dataset in the same fashion as the 80 K spectrum reveals only minor changes in isomer shift and quadrupole splitting for each isolated Fe center (Figure S14). The observed temperature dependence of the isomer shifts – which tend to decrease with increasing temperature – is consistent with the magnitude of the second order Doppler shift expected for metal complexes (~ 0.1 mm/s).25 A visual inspection of the data shows that the simulated quadrupole splitting narrows as the temperature increases. The observed temperature dependence of quadrupole splitting is typical for paramagnetic iron complexes, and can be attributed to Boltzmann population of nearly degenerate electronic states.25 Nevertheless, the room temperature Mössbauer data features four well-resolved resonances, consistent with the localization of FeII and FeIII character in the triiron core (Table S3).
The VT-NMR spectra recorded between 203 and 293 K demonstrate a linear correlation between the chemical shifts and the inverse temperature (Figure S15 and S16). The linear correlations in complex 3 exhibit Curie and antiCurie type behavior between 120 and −20 ppm, which is frequently observed for multimetallic paramagnetic complexes.28 We believe that the linear dependence is indicative for the absence of abrupt electronic transitions, which would otherwise alter the exchange-interactions between the Fe metal centers, and hence, show a significant deviation from linearity. Consequently our variable temperature XRD, Mössbauer and NMR studies all support that oxidation states in complex 3 remain localized throughout the experimental temperature range.
Utilizing the localized electron transfer in complexes 3–5, we sought to investigate the effect of redox changes on small molecule activation. Nitric oxide (NO) was selected since the νNO stretch at 1875 cm−1 (gas phase) in the Infrared (IR) spectrum is a useful spectroscopic handle29 that is sensitive towards local changes in the electronic environment. NO binding to iron clusters is also of biological significance,30 and the chemistry of NO with synthetic iron-sulfur clusters has been investigated.31 Furthermore, the chemistry of NO with various other metal centers is well established.29,32 Notwithstanding, only a handful of iron-nitrosyl complexes that feature a trigonal bipyramidal geometry (TBP; Table S4) have been reported.16a,16d,16j,33 A detailed study of the electronic structure of NO adducts of iron dithiolene complexes upon oxidation/reduction of the dithiolene ligand has been reported.34 However, to the best of our knowledge, the effect of redox changes at distal metal centers on the activation of nitric oxide has not been described.
Iron nitrosyl complexes were targeted by treating solutions of 3–5 with NO (Scheme 1). Upon exposure to NO, significant changes are observed in the 1H NMR spectrum of complexes 3–5 (Scheme 1 and Figures S17–19). These new species were identified by X-ray diffraction studies as the corresponding nitrosyl complexes: [LFe3(PhPz)3OFe(NO)][OTf] (6), [LFe3(PhPz)3OFe(NO)][OTf]2 (7) and [LFe3(PhPz)3OFe(NO)][OTf]3 (8) (Figure 5A; Figures S35-S37; vide infra). Alternatively, complexes 7 and 8 can be readily synthesized from 6 upon oxidation with 1.0 or 2.0 equiv. of AgOTf (Scheme 1).
Figure 5.

(A) Truncated molecular structure of [LFe3(PhPz)3OFeNO][OTf]2, with thermal ellipsoids at the 50% probability level. Portions of the ligand (L), hydrogen atoms, outer sphere counter ions, and solvents molecules are not shown for clarity. (B-C) X-ray structural parameters of the [Fe4(μ4-O)NO] core in complexes 6–8. (E-G) Zero-field 57Fe Mössbauer spectra at 80 K of (E) [LFe3(PhPz)3OFeNO][OTf] (black dots) with simulated parameters; (i) δ = 0.506 mm/s, |ΔEQ|= 0.956 mm/s (solid orange trace); (ii) δ = 1.094 mm/s, |ΔEQ|= 3.549 mm/s solid blue trace); (iii) δ = 1.132 mm/s, |ΔEQ|= 3.171 mm/s (dashed blue trace); and (iv) δ = 0.592 mm/s, |ΔEQ|= 2.381 mm/s (solid green trace). (F) [LFe3(PhPz)3OFeNO][OTf]2 (black dots) with simulated parameters; i) δ = 0.454 mm/s, |ΔEQ|= 0.504 mm/s (dashed orange trace); (ii) δ = 0.470 mm/s, |ΔEQ|= 0.945 mm/s (solid orange trace); (iii) δ = 1.177 mm/s, |ΔEQ|= 3.286 mm/s (solid blue trace); and (iv) δ = 0.550 mm/s, |ΔEQ|= 2.271 mm/s (solid green trace), and (G) [LFe3(PhPz)3OFeNO][OTf]3 (black dots) with simulated parameters; i) δ = 0.445 mm/s, |ΔEQ|= 0.509 mm/s (solid orange trace); (ii) δ = 0.445 mm/s, |ΔEQ|= 0.765 mm/s (dashed orange trace); (iii) δ = 0.445 mm/s, |ΔEQ|= 1.052 mm/s (dotted orange trace); and (iv) δ = 0.617 mm/s, |ΔEQ|= 1.937 mm/s (solid green trace). The grey line is a spectral fit of the data
The electrochemical properties of complex 7 are very similar to those of complex 4. For complex 7 three quasi-reversible redox waves are observed at −1.662, −0.717, and 0.005 V (vs. Fc/Fc+). These oxidation/reduction waves are assigned to the FeII4/FeII3FeIII (−1.662 V), FeII3FeIII/FeII2FeIII2 (−0.717 V), and FeII2FeIII2/FeIIFeIII3 (0.005 V) redox-couples, respectively.
X-ray diffraction studies on complexes 6–8 (Figure 5A; Figures S35-S37) showed that the coordination environment around the apical iron metal center (Fe4) is trigonal bipyramidal (τ5= 0.83-0.99).35 The NO and the μ4-oxido (O1) are axial with respect to the pyrazolate N14|N24|N34 plane and complete the trigonal bipyramid. For complex 7, the apical iron center is located slightly above the plane formed by the pyrazolate nitrogen donors N14, N24, and N34 (Figure 5A). Upon oxidation, a slight increase in distance is observed between the equatorial plane and Fe4 (6 ; 0.166 Å vs. 8 ; 0.260 Å). Compared to complexes 3 – 5, an increase in the (Fe1– N13– N14– Fe4), (Fe2– N23– N24– Fe4), and (Fe3– N33– N34– Fe4) torsion angles is observed in order to facilitate binding of NO (Table 1). The increase in angular torsion results in an average decrease of ~0.12 Å between the Fe1|Fe2|Fe3 and N14|N24|N34 centroids (Table 1). Furthermore, such an increase leads to a decrease in steric crowding around the apical metal center. NO is coordinated in a linear fashion (∠Fe–N–O = 170.9 ± 1.0º), consistent with other TBP iron nitrosyl complexes (Table S4). It must be noted that Fe–N–O angle is dependent on the steric crowding around the apical metal center.16j,33d
Similar to complexes 3–5, the μ4-oxido (O1) is connected to all four iron centers and forms a rare [Fe4(μ4-O)NO] core (Figure 5B–D).18 Oxidation of 6 to 8 results in an increase in the Lewis acidity of the triiron core, which in turn leads to a decrease in the Fe1|Fe2|Fe3 centroid–O1 distance from 1.057 Å (6) to 0.921 Å (8). Furthermore, oxidation also results in contraction of the Fe1– N13, Fe2–N23, and Fe3–N33 bond distances (Table 1). Other structural changes are found in the [Fe4(μ4-O)NO] core, and are dependent on the oxidation state of the iron centers (Table 1). As mentioned above, oxidation from FeII to FeIII is accompanied by a reduction in bond lengths. For instance, the Fe2–O1 distance changes from 2.070(2) Å in complex 6, to 1.928(3) Å in complex 7 (Figure 5 C and D). An even more substantial change is observed for the Fe1–O1 distance upon oxidation from 7 to 8 (7 ; 2.183(3) Å vs. 8 ; 1.979(5) Å). Correspondingly, in complexes 6–8 electron transfer exclusively occurs from the triiron core as well. The apical iron center can be best described as a {FeNO}7 moiety in the Enemark-Feltham notation.36
Complexes that resemble the coordination environment around the apical iron center have been published.16a,16d,16j,33 For instance, Lehnert and co-workers recently published the monometallic complex [Fe(TMGtren)3NO][OTf]2 (TMGtren = 1,1,1- tris{2-[N(2)-(1,1,3,3-tetramethyl-guanidino)]ethyl}-amine), which features a similar {FeNO}7 metal center.16d The average Fe– Nguan bond distances (spanning the trigonal plane) of 2.037 Å are nearly identical to those observed in complexes 6 −8 (2.077 Å; Table 1). A major difference is the distance between the axial Fe– Namine (2.251 Å) and Fe–O1 (2.035 Å), reflecting the anionic character of the μ4-oxido (O1). The Fe-N-O angle of 171.4 is similar to that in [Fe(TMGtren)3NO][OTf]2 (168.0) and is common for sterically encumbered nitrosyl complexes.16j Similar to their structural parameters, the electrochemical properties of [Fe(TMGtren)3NO][OTf]2 and complexes 6 −8 are comparable as well, both show a reversible reduction between −1.2 and −1.8 volt (vs. Fc/Fc+). However, chemically they are totally different. Whereas treating [Fe(TMGtren)3NO][OTf]2 with CoCp*2 results in a clean reduction to a {FeNO}8 type complex, treating complex 6 with CoCp*2 (1.0 equiv), resulted in the formation of complex 3 with concomitant loss of NO (Figure S20 and S21). This process possibly accounts for the asymmetry of the most negative redox wave (−1.662 V, vs. Fc/Fc+) in the CV of complex 6. This is most likely caused by reduction of complex 6 and additional electron transfer to form NO− which is feasible at such low potentials.29
The zero-field 57Fe Mössbauer spectra of complexes 6–8 are nearly identical to those of complexes 3–5 (Figure 5E–G). The change in oxidation state from FeII to FeIII is readily monitored by a shift of the quadrupole doublets at δ ≈ 1.1 mm/s (blue traces) to a value of δ ≈ 0.4-0.5 mm/s (orange traces). Coordination of NO to the apical iron center lowers the isomer shift to δ ≈ 0.6 mm/s in 6 – 8 (green trace; Figure 5E–F, and Table 3) compared to δ ≈ 0.8-0.9 mm/s in 3–5 (green trace, Figure 4E–F, Table 2). Mössbauer data for other trigonal bipyramidal iron nitrosyl complexes are summarized in Table S1. The fact that the isomer shift for Fe4 remains relatively unchanged for complexes 6–8 is consistent with XRD data indicating that the oxidation state of the apical metal center does not change during the redox transformations of the iron metal cluster, even upon coordination of NO.
Table 3.
Mössbauer parameters for complexes 6-8.
| # | Complex | Parameters | ||
|---|---|---|---|---|
|
δ
(mm/s) |
| Δ Eq | (mm/s) |
% | ||
| 6 | [LFe3(PhPz)3OFeNO][OTf] | 0.506 | 0.956 | 25 |
| 1.094 | 3.549 | 25 | ||
| 1.132 | 3.171 | 25 | ||
| 0.592 | 2.381 | 25 | ||
| 7 | [LFe3(PhPz)3OFeNO][OTf]2 | 0.470 | 0.945 | 25 |
| 0.545 | 0.504 | 25 | ||
| 1.177 | 3.286 | 25 | ||
| 0.550 | 2.271 | 25 | ||
| 8 | [LFe3(PhPz)3OFeNO][OTf]3 | 0.445 | 0.509 | 27 |
| 0.445 | 1.052 | 27 | ||
| 0.445 | 0.765 | 27 | ||
| 0.617 | 1.937 | 27 | ||
With iron-nitrosyl complexes 6–8 in hand, we used infrared (IR) spectroscopy to investigate the effect of distal metal oxidation state changes on the bound NO ligand. The solid-state infrared spectra of complexes 2−8 are shown in Figure S9, S22–25 and Figure 6. Complex 6 exhibits two peaks at 1715 and 1759 cm−1 assigned to the NO stretching modes. The presence of two NO bands are unexpected, and might be due to Fermi resonances. To investigate further, we prepared the 15NO labeled analog of complex 6. Isotopic labeling should discern whether the two νNO stretches are attributed to Fermi resonances or due to the presence of two isomers of complex 6. In the latter case, two νNO stretches should persist upon isotopic labeling, albeit downshifted. The IR spectrum of the 15NO labeled analog clearly shows two downshifted νNO stretches at 1688 and 1726 cm−1 (Figure S26, calc 1683 and 1727 cm−1, respectively). These studies thus indicated that – most likely – two different geometries of complex 6 are present in the solid state, giving rise to the two observed νNO stretches in complex 6. However, XRD studies did not unequivocally demonstrate the presence of multiple conformations. Nonetheless, multiple peaks assigned to NO stretches have been observed in other complexes, bearing a single NO ligand.16j,33d In contrast, complexes 7 and 8, exhibit single IR bands at 1799 and 1823 cm−1 (Figure 6). The observed NO stretching frequencies are in line with other reported iron nitrosyl complexes in trigonal bipyramidal geometry.16a,16d,16j,33 On average – for complexes 6–8 – the νNO changes by ~30 cm−1 per one-electron oxidation. Similar changes in the ν (35 cm−1/e−) are observed for a series NO adducts of monoiron dithiolene complexes upon oxidation/reduction.34b In that case, the nature of the ligands coordinated to Fe is significantly affected due to modifications in the redox state of the dithiolene moiety. The significant νNO shift in the current system is notable, given that neither the oxidation state of the metal binding NO nor the direct donors to the apical Fe are changing. Although purely electrostatic effects on the νNO stretching frequency cannot be ruled out, analysis of the structural parameters of the clusters provides an alternate explanation for the observed trend.
Figure 6.
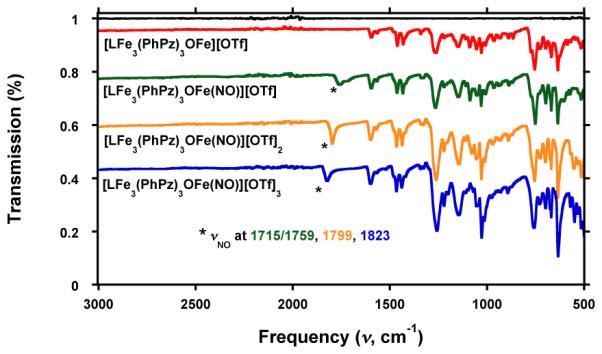
Infrared (IR) spectrum of [LFe3(PhPz)3OFe][OTf] (3 ; red line), [LFe3(PhPz)3OFeNO][OTf] (6 ; green line), [LFe3(PhPz)3OFeNO][OTf]2 (7 ; orange line), and [LFe3(PhPz)3OFeNO][OTf]3 (8 ; blue line). The black line is the baseline.
The most notable and significant change in the bond distance occurs between the apical metal and the interstitial oxygen (O1). Successive oxidation from 6 to 8 leads to an increase of Fe4–O1 bond length from 1.968(2) Å in 6 to 2.087(5) Å in 8 (Δ Fe4–O1 = 0.119 Å). The decreased interaction between O1 and Fe4 upon oxidation of the triiron core results in lower electron donation to Fe4, and consequently a more electron-deficient metal center. For complexes 6–8, the following trend is thus observed: the more electron positive the apical metal center, the higher the νNO stretching frequency. Such a trend was also demonstrated in monometallic complexes of the type [Fe(BMPA-pr)][X] (BMPA = N-propanoate-N,N-bis(2-pyridylmethyl)amine; X = Cl−, ClO4, I−, and CF3SO3). In these complexes, a notable shift of 84 cm−1 was observed as a function of the coordinating ability of the counter ions. Less coordinating counter ions – and hence more electron-deficient metal centers − showed higher νNO stretching frequencies. The large shift of the νNO frequency was attributed to an increase in π-donation from the NO ligand upon increasing the electron-deficiency of the iron metal center as demonstrated by a linear correlation between the ν(Fe–NO) and ν(N–O) stretching frequencies. These results were corroborated by computational studies, describing the Fe–NO interactions as Fe(III) with NO and indicated π-donation from NO into the iron β-dxz and β-dyz orbitals upon increasing the electropositive character of the iron metal center
Given that the observed trends in complexes 6–8 are similar to and that our results fit the above-mentioned report, a mechanism akin to that proposed by Lehnert and co-workers might be operating. Consequently, we attribute the change in νNO to the flexibility of the axial interstitial oxygen ion (O1), which moves closer to the metal centers that are being oxidized and away from the apical metal that binds the diatomic molecule. The resulting increase in electron-deficiency of the apical metal center (Fe4) results in an increase in the π-donation from NO and hence an increase in νNO, which was observed experimentally. Furthermore, the importance of axial ligand flexibility has also been invoked in mononuclear iron models of the FeMoco cluster of nitrogenase, where the degree of elongation between the axial atom (Si, B, C) of tripodal supporting ligands was speculated to affect the degree of N2 and CO activation.37
To exploit the different degrees of NO activation we investigated the reactivity of the most oxidized and most reduced nitrosyl complexes 6 and 8. The addition of complex 6 in dichloromethane to a solution of complex 8, results in the formation of complex 7 upon mixing, as judged by 1H NMR (Figure S27), while no dimerization was observed. To further test the chemical reactivity of nitrosyl complexes 6 and 8, we investigated their reaction with O2. Metal-nitrosyl complexes are known to react with O2 to form NO2–38 The addition of 1 atm. O2 to complex 6 in dichloromethane (J-Young NMR tube) resulted in clean oxidation 6 within 2 hours, to give a 1H NMR spectrum that is identical to that of complex 7. After 24 hours, some decomposition was observed (Figure S28). In contrast, no oxidation events were observed for complex 8 upon addition of 1 atm. O2 (J-Young NMR tube). In both cases the nitrosyl moieties remained intact (Figure S28 and S29). These studies thus indicate that electron transfer is the predominant observed reactivity pathway.
In our attempts to utilize the reducing power of complex 6 we investigated the disproportionation of NO. Others have investigated the disproportionation of NO by various metal-nitrosyl complexes as well.29,39 Addition of 6 equiv. NO to complex 6 in acetonitrile resulted in a color change from red/brown to dark green during the course of 28 h. All the volatiles of the reaction mixture were vacuum transferred and subsequently trapped by a series of traps at −78 °C (CH3CN) and −196 ºC (all other gasses) to allow for analysis of the gaseous products. Fourier transform infrared (FTIR) spectroscopy of the trapped gasses, revealed clear formation of N2O, while some NO remained present (Figure 7; blue trace). In addition 1H NMR analysis of the remaining solid revealed quantitative conversion of complex 6 to a species with an 1H-NMR identical to that of complex 7 (Figure S30). However, the fate of the generated NO2−, could not be determined. In contrast, addition of 6 equiv. NO to complex 8 did not lead to any oxidation (Figure S31), and only small N2O peak was observed in the IR spectrum (Figure 7; red trace), which might be due to the small N2O impurity in the used NO gas (Figure 7; green trace). The green and red traces in Figure 7 are nearly identical, supporting the fact that the observed N2O is from the N2O impurity of the NO gas.
Figure 7.
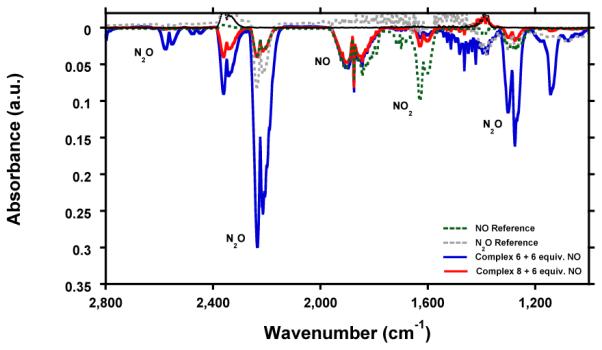
Fourier transform Infrared (FTIR) spectrum of NO gas (green trace), N2O gas (gray trace) and the gaseous volatiles of the reaction of complex 6 (blue trace) and complex 8 (red trace) with 6 equiv. NO.
These experiments clearly demonstrate the differences in reactivity amongst complex 6 and 8. It is interesting that the electrons stored in the triiron core of complex 6, can be used to facilitate NO disproportionation at a distal metal center. With the electron reservoir depleted, disproportion of NO to N2O is not observed in complex 8. These results are in-line with previous work, where NO disproportionation is favored by electron-rich metal centers.39b Overall, the present studies demonstrate that within a cluster with an interstitial oxygen atom, the apical Fe–O interaction is flexible, and is significantly affected by remote redox changes, which, in turn, affects the activation of the coordinated NO; aspects all relevant to small molecule activation by metal clusters.
III. Summary
A new class of tetranuclear iron clusters of the general formula [LFe3(PhPz)3OFe][OTf]x (x = 0, 1, 2, or 3) has been synthesized. These clusters feature a discrete [Fe4(μ4-O)] core, which is rare. Additionally, these clusters are site differentiated, with a triiron core consisting of six-coordinate metal centers and one four-coordinate apical metal. Electrochemical, spectroscopic, and crystallographic studies have demonstrated that upon redox chemistry the triiron core shuttles between the oxidation states: [FeII3] ⇆ [FeII2FeIII] ⇆ [FeIIFeIII2] ⇆ [FeIII3]. During these redox processes spanning a large potential window, the oxidation state of the apical iron center (Fe4) does not change. The site-specific redox chemistry is due to differences in coordination numbers and type of ligands. This localization of the redox processes offers a conduit for storing electrons or holes away from the site of substrate binding. Exposure of redox series 3–5 to nitric oxide (NO) yielded the corresponding nitrosyl complexes 6–8. We found that the NO stretching frequency varies as much as 100 cm−1 over three oxidation states of the triiron core. The degree of NO activation was linked to the flexibility of the interstitial oxygen atom (O1), whose ability to donate electron density to the apical iron center is affected by the oxidation state of the triiron moiety. This study shows that the redox changes of metal centers can influence the degree of activation of small molecules on a distal site. These effects occur even in the absence of any redox events at the metal center that directly binds the substrate.
IV. Experimental Section
General Procedures
All reactions were performed at room temperature in an N2-filled M. Braun Glovebox or by using standard Schlenk techniques unless otherwise specified. Glassware was oven dried at 140° C for at least 2h prior to use, and allowed to cool under vacuum. All reagents were used as received unless otherwise stated. Iodosobenzene (PhIO), and LFe3(OAc)3 were synthesized according to published procedures.12b,40 Caution! Iodosobenzene is potentially explosive and should be used only in small quantities. Nitric oxide (NO), Phenyl-1H-pyrazole, Na(N(SiMe3)2), AgOTf, and Fe(OTf)2 were purchased from Sigma Aldrich and Strem Chemicals. Cobaltocene (CoCp2) and decamethyl cobaltocene (CoCp*2) were purchased from Strem Chemicals and sublimed before use. Anhydrous tet-rahydrofuran (THF) was purchased from Aldrich in 18 L Pure-9 Pac™ containers. Anhydrous CH2Cl2, diethyl ether, hexane and THF were purified by sparging with nitrogen for 15 minutes and then passing under nitrogen pressure through a column of activated A2 alumina. Anhydrous 1,2-dimethoxyethane (DME) was dried over sodium/benzophenone and vacuum-transferred onto molecular sieves. The 1H, 19F, and 13C{1H} NMR spectra were recorded at 400.13 and 100.62 MHz on a Bruker Ascend™ 400 MHz spectrometer equipped with prodigy cryoprobe, or at 300.13, 282.36, and 75.47 MHz, respectively, on a Varian 300 MHz spectrometer. All chemical shifts (δ) are reported in ppm, and coupling constants (J) are in Hz. The 1H and 13C{1H} NMR spectra were referenced using residual H-impurity in deuterated solvent, whereas the 19F chemical shifts are reported relative to the internal lock signal. CD2Cl2, and CD3CN, and 15N labeled nitric oxide (15NO) were purchased from Cambridge Isotope Laboratories. Deuterated solvents were dried over calcium hydride, degassed by three freeze-pump-thaw cycles and vacuum-transferred prior to use. The UV-vis spectra were recorded on a Varian Cary Bio 50 spectrophotometer. Infrared (ATR-IR) spectra of complexes 3–8 were recorded on a Bruker APLHA ATR-IR spectrometer at 2 cm−1 resolution. Fourier transform infrared (FTIR) spectra of gases were in a sealed IR-Cell using a Bio-Rad Excalibur FTS 3000 spectrometer. Elemental analyses were performed by Robertson Microlit Laboratories, NJ.
Physical Methods
Mössbauermeasure ments
Zero-field 57Fe Mössbauer spectra were recorded at 80, 100, 200 or 298 K in the constant acceleration mode on a spectrometer from See Co (Edina, MN) equipped with an SVT-400 cryostat (Janis, Wilmington, WA). The quoted isomer shifts are relative to the centroid of the spectrum of a α-Fe foil at room temperature. Samples were prepared by grinding polycrystal-line material (20 mg) into a fine powder and pressed into a homogeneous pellet with boron nitride in a cup fitted with a screw cap. The data were fitted to Lorentzian lineshapes using the program WMOSS (www.wmoss.org).
Electrochemical measurements
CVs were recorded with a Pine Instrument Company AFCBP1 bipotentiostat using the AfterMath software package. All measurements were performed in a three-electrode cell configuration that consisted of 1) a glassycarbon (ø = 3.0 mm) working electrode, 2) a Pt wire as the counter electrode, and 3) an Ag wire as the reference electrode. All electro-chemical measurements were performed at RT in an M. Braun N2-filled glovebox with O2 and H2O levels <2 ppm. Dry dichloromethane that contained 0.1M nBu4NPF6 was used as the electrolyte solution. The ferrocene/ferrocenium (Fc/Fc+) redox couple was used as an internal standard for all measurements.
X-raycrystallography
Low temperature (100 K) and room temperature (298 K) X-ray data were obtained on a Bruker PHOTON100 CMOS based diffractometer (microfocus sealed X-ray tube, Mo Kα (λ) = 0.71073 Å or with Cu Kα (λ) = 1.54178). All diffractometer manipulations, including data collection, integration, and scaling were carried out using the Bruker APEXII software.41 Absorption corrections were applied using SADABS.42 Structures were solved by direct methods using XS43 (incorporated into SHELXTL), and refined by full-matrix least squares on F2. All non-hydrogen atoms were refined using anisotropic displacement parameters. Hydrogen atoms were placed in the idealized positions and refined using a riding model. The structures were refined (weighed least squares refinement on F2) to convergence.
Due to the size of compounds (3–8), most crystals included solvent accessible voids, which tended to contain disordered solvent. In most cases, this disorder could be modeled satisfactorily. However, for complexes 5 and 8 significant amount of disorder was found for the solvent and the triflate counter ions. The total amount of triflates was fixed at 3 in accordance with the observed bond-distances in 5 and 8, and in accordance with other spectroscopic observations. Furthermore, the long-range order of these crystals and amount of high angle data was in some cases not ideal, due to desolvation of the crystals and/or solvent disorder. These disordered solvent molecules were largely responsible for the alerts generated by the checkCIF protocol.
Synthetic Procedures
Sodi um 3-phenylpyrazolate
In the glovebox, a solution of sodium hexamethyldisilazane (NaHMDS, 3.82 g, 20.8 mmol) in THF (5 mL) was added drop-wise to a solution of 3-phenyl-1H-pyrazole (2.50 g, 17.3 mmol) in THF (50 mL). The solution changed from colorless to light yellow upon addition. The homogenous mixture was stirred for 2 h. The amount of solvent was reduced to approximately 5 mL under vacuum and hexanes (15 mL) were added until a white precipitate formed. The precipitate was collected by filtration through a sintered glass funnel, washed twice with hexanes (15 mL) and dried under reduced pressure to yield 2.57 g (86%) of sodium 3-phenylpyrazolate (NaPhPz) as a white powder. 1H NMR (400 MHz, CD3CN) δ 7.80 – 7.74 (m, 2H), 7.56 (t, J = 1.3 Hz, 1H), 7.30 – 7.23 (m, 2H), 7.15 – 7.07 (m, 1H), 6.46 (t, J = 1.3 Hz, 1H). 13C NMR (101 MHz, Acetonitrile-d3) δ 152.12 (Pz NCCH), 141.11 (Pz CHCHN), 138.49 (i-Ar), 129.19 (o-Ar CH), 125.87 (m-Ar CH), 125.77 (p-Ar CH), 100.73 (Pz NCCH).
LFe3 (OAc)(OTf)2
In the glovebox, to a slurry of LFe3(OAc)3 (500 mg, 0.416 mmol) in CH2Cl2 (10 mL) was added methyl triflate (MeOTf, 137 −L, 1.25 mmol). The color changed from orange to yellow and the mixture became homogenous within 5 minutes. The solution was stirred for 30 min. and the solvent was evaporated under reduced pressure to yield LFe3(OAc)(OTf)2 as a yellow powder (600 mg; 98%). 1H NMR (300 MHz, CD2Cl2) δ 100.68 (s), 85.82 (s,), 76.59 (s), 46.94 (s), 44.30 (s), 37.19 (s), 33.75 (s), 30.83 (s), 25.95 (s), 10.46 (s), −4.46 (s). 19F NMR (282 MHz, CD2Cl2) δ. −47.23. UV-Vis (CH2Cl2) [ε (M−1 cm−1)]: 250 nm (7.2 ×10⁴), 380 nm (3.0 ×10³). Anal. calcd. For C60H39F9Fe3N6O12S3 [LFe3(OTf)3]: C 49.00, H 2.67, 5.71; found: C 48.38, H 2.84, N 5.17
[LFe3 (PhPz)3OFe] [OTf]2
In the glovebox, a suspension of LFe3(OAc)(OTf)2 (1380 mg, 1.0 mmol) in THF (30 mL) is frozen in the cold well. To the thawing suspension is added NaPhPz (550 mg, 3.3 mmol) in THF (5 mL). The color changed immediately to orange and the suspension became homogeneous during the course of 1 hour. The solution was stirred for a total of 2 h. where after iodosobenzene (PhIO, 228 mg, 1.0 mmol) was added as a suspension in THF (5 mL). The solution changed to orange brown immediately and became homogenous after 0.5 h. The solution was stirred for 1 h. and a brown precipitate formed. To the suspension was added Fe(OTf)2 (710 mg, 2.0 mmol) as a suspension in THF (5 mL). The suspension was stirred for 24 h. and subsequently filtered over a bed of Celite (0.5 cm) on a medium porosity glass frit. The remaining brown solid was dissolved in acetonitrile,10 filtered, and the solvent removed under reduced pressure to yield [LFe3(PhPz)3OFe][OTf]2 as a brown solid. Yield 750 mg (41%). 1H-NMR (300 MHz, CD2Cl2): δ 119.06 (s), 70.91 (s), 68.39 (s), 53.05 (s), 49.65 (s), 43.88 (s), 43.43 (s), 18.25 (s), 15.67 (s), 14.53 (s), 13.02 (s), 6.96 (s), 6.07 (s), 4.92 (s), 4.25 (s), 0.28 (s), −3.65 (s). 19F NMR (282 MHz, CD2Cl2): δ. −77.64. UV-Vis (CH2Cl2) [ε (M−1 cm−1)]: 245 nm (11.1 × 10⁴), 443 nm (7.9 × 10³). Anal. calcd. (%) for C86H60F6Fe4N12O10S2: C 56.66, H 3.32, N 9.22; found: C 56.32, H 3.32, N 8.96.
[LFe3(PhPz)3OFe] [OTf]
In the glovebox, to a rapidly stirred solution of [LFe3(PhPz)3OFe][OTf]2 (911 mg, 0.5 mmol) in CH2Cl2 (20 mL) was added drop-wise a solution of cobaltocene (CoCp2; 97 mg, 0.5 mmol) in CH2Cl2 (5 mL) The brown solution immediately changed color to red-purple. The solution was stirred for a further 2 h, and the solvent was removed under reduced pressure. The solid was washed with copious amount of dimethoxyethane (DME; 75 mL) to remove any cobaltocenium triflate. The remaining solid was dissolved in 50 mL CH2Cl2 and filtered over a bed of Celite (0.5 cm) on a medium porosity glass frit. The solvent was removed under reduced pressure to yield [LFe3(PhPz)3OFe][OTf] as a red/purple solid. Yield 631 mg (75%). 1H NMR (300 MHz, CD2Cl2) δ 97.34 (s), 60.35 (s), 56.46 (s), 37.46 (s), 34.75 (s), 33.71 (s), 30.25 (s), 24.41 (s), 17.45 (s), 15.21 (s), 13.36 (s), 12.96 (s), 9.74 (s), 8.03 (s), 4.54 (s), 4.31 (s), −3.89 (s), −7.94 (s). 19F NMR (282 MHz, CD2Cl2) δ −78.72. UV-Vis (CH2Cl2) [ε (M−1 cm−1)]: 252 nm (12.3 × 10⁴), 346 nm (7.1 × 10⁴), 509 nm (4.7 × 10³). Anal. calcd. (%) for C85H60F3Fe4N12O7S: C 60.99, H 3.61, N 10.04; found: C 60.77, H 3.45, N 9.98.
[LFe3(PhPz)3OFe] [OTf]3
In the glovebox, to a rapidly stirred solution of [LFe3(PhPz)3OFe][OTf]2 (911 mg, 0.5 mmol) in CH2Cl2 (20 mL) was added – drop-wise – a solution of silver triflate (AgOTf; 130 mg, 0.5 mmol) in CH2Cl2 (5 mL). The brown solution slowly changed color to dark purple. The solution was stirred for a further 2 h, and the solvent was removed under reduced pressure. The remaining solid was dissolved in a minimum amount of CH2Cl2 (~ 15 mL) and filtered over a bed of Celite (0.5 cm) on a medium porosity glass frit. The solvent was removed under reduced pressure to yield [LFe3(PhPz)3OFe][OTf]3 as a purple solid. Yield 920 mg (93%). 1H NMR (300 MHz, CD2Cl2) δ: 167.53 (s), 88.63 (s), 81.04 (s), 78.45 (s), 72.19 (s), 62.91 (s), 45.47 (s), 20.23 (s), 17.85 (s), 17.52 (s), 10.92 (s), 9.04 (s), 6.92 (s), 5.65 (s), 3.00 (s), −2.28 (s), −9.42 (s). 19F NMR (282 MHz, CD2Cl2) δ: −77.82. UV-Vis (CH2Cl2) [ε (M−1 cm−1)]: 244 nm (11.4 × 10⁴), 361 nm (7.0 × 10⁴n0), 519 (8.8 × 10³). Anal. calcd. (%) for C85H60F9Fe4N12O13S3: C 52.99, H 3.07, N 8.52; found: C 52.15, H 3.02, N 8.17.
[LFe3(PhPz)3OFe(14NO)][OTf]
In the glovebox, a 100 mL Schlenk tube was charged with [LFe3(PhPz)3OFe][OTf] (501 mg, 0.3 mmol) and CH2Cl2 (40 mL) was added. The tube was sealed and degassed by three freeze-pump-thaw cycles on the Schlenk-line. While frozen, gaseous nitric oxide (NO, 33 mL, 0.22345 atm., 185.2 mm Hg) was added. The mixture was stirred at room temperature for 2 h, during which, the color changed from red/purple to red/brown. After 2 h. the solvent was removed under reduced pressure to yield [LFe3(PhPz)3OFeNO][OTf] as a dark red/brown solid. Yield 470 mg (92%). 1H NMR (300 MHz, CD2Cl2): δ 105.12 (s), 64.85 (s), 62.21 (s), 58.05 (s), 46.55 (s), 44.63 (s), 39.74 (s), 22.07 (s), 14.04 (s), 14.04 (s), 8.84 (s), 8.06 (s), 6.49 (s), 5.38 (s), 4.34 (s), 3.37 (s), 0.34 (s), −18.13 (s). 19F NMR (282 MHz, CD2Cl2): δ −78.49. UV-Vis (CH2Cl2) [ε (M−1 cm−1)]: 249 nm (10.4 × 10⁴), 457 nm (4.3 × 10³). Anal. calcd. for C85H60F3Fe4N13O8S: C 59.92, H 3.55, 10.69; found: C 59.77, H 4.11, N 9.74.
[LFe3(PhPz)3OFe(15NO)][OTf]
In the glovebox, a 100 mL Schlenk tube was charged with [LFe3(PhPz)3OFe][OTf] (86. mg, 0.052 mmol) and CH2Cl2 (10 mL) was added. The tube was sealed and degassed by three freeze-pump-thaw cycles on the Schlenk-line. While frozen, gaseous 15N labeled nitric oxide (15NO, 234 mL, 0.00548 atm., 4.5 mm Hg) was added. The mixture was stirred at room temperature for 2 h, during which, the color changed from red/purple to red/brown. After 2 h. the solvent was removed under reduced pressure to yield [LFe3(PhPz)3OFe(15NO)][OTf] as a dark red/brown solid. Yield 82 mg (93%). 1H NMR is identical to that of complex 6.
[LFe3 (PhPz)3OFe(NO)][OTf]2
Method A
In the glove-box, to a solution of [LFe3(PhPz)3OFeNO][OTf] (170 mg, 0.1 mmol) in CH2Cl2 (10 mL), was added a solution of silver triflate (AgOTf; 28.5 mg, 0.11 mmol) in CH2Cl2 (2 mL). The red/brown solution slowly changed color to dark green. The green solution was stirred for a total of 2 h. and filtered over a bed of Celite (0.5 cm) on a medium porosity glass frit. The solvent was removed under reduced pressure to yield [LFe3(PhPz)3OFeNO][OTf]2 as a dark green solid. Yield 156 mg (84%). 1H NMR (300 MHz, CD2Cl2): δ 124.92 (s), 92.96 (s), 76.04 (s), 73.70 (s), 58.35 (s), 55.54 (s), 45.96 (s), 15.34 (s), 13.10 (s), 11.06 (s), 8.75 (s), 6.91 (s), 6.72 (s), 4.24 (s), 2.61 (s), −6.76 (s). 19F NMR (282 MHz, CD2Cl2): δ. −78.19. UV-Vis (CH2Cl2) [ε (M−1 cm−1)]: 243 nm (12.3 × 10⁴), 426 nm (9.5 × 10³), 650 nm (1.9 × 10³). Anal. calcd. for C86H60F6Fe4N13O11S2: C 55.74, H 3.26, N 9.83; found: C 55.92, H 3.47, N 9.67.
Method B
In the glovebox, a 100 mL Schlenk tube was charged with [LFe3(PhPz)3OFe][OTf]2 (370 mg, 0.2 mmol) and CH2Cl2 (20 mL) was added. The tube was sealed and degassed by three freeze-pump-thaw cycles on the Schlenk-line. While frozen, gaseous nitric oxide (NO, 33 mL, 0.17632 atm., 135.0 mm Hg) was added. The mixture was stirred at room temperature for 2 h, during which, the color changed from yellow/brown to green. After 2 h. the solvent was removed under reduced pressure to yield [LFe3(PhPz)3OFeNO][OTf]2 as a dark green solid. Yield 338 mg (91%). 1H NMR is identical to that observed for method A.
[LFe3(PhPz)3OFe(NO)][OTf]3
Method A
In the glove-box, to a solution of [LFe3(PhPz)3OFeNO][OTf] (170 mg, 0.1 mmol) in CH2Cl2 (10 mL) was added a solution of silver triflate (AgOTf; 57 mg, 0.21 mmol) in CH2Cl2 (2 mL). The solution first changed color from red/brown to dark green and subsequently to dark purple. The dark purple solution was stirred for a total of 2 h. and filtered over a bed of Celite (0.5 cm) on a medium porosity glass frit. The solvent was removed under reduced pressure to yield [LFe3(PhPz)3OFeNO][OTf]3 as a dark purple solid. Yield 190 mg (97%). 1H NMR (300 MHz, CD2Cl2): δ 177.15 (s), 141.81 (s), 89.29 (s), 88.78 (s), 82.02 (s), 79.79 (s), 46.97 (2), 17.22 (s), 11.40 (s), 9.86 (s), 4.76 (s), −2.35 (s). 19F NMR (282 MHz, CD2Cl2) δ: −77.88. UV-Vis (CH2Cl2) [ε (M−1 cm−1)]: 241 nm (11.6 × 10⁴), 503 nm (8.6 × 10³). Anal. calcd. for C85H60F9Fe4N13O14S3: C52.19, H 3.02, N 9.10; found: C 51.11, H 3.35, N 8.42.
Method B
In the glovebox, a 100 mL Schlenk tube was charged with [LFe3(PhPz)3OFe][OTf]3 (195 mg, 0.1 mmol) and11CH2Cl2 (20 mL) was added. The tube was sealed and degassed by three freeze-pump-thaw cycles on the Schlenk-line. While frozen, gaseous nitric oxide (NO, 33 mL, 0.08816 atm., 67.5 mm Hg) was added. The mixture was stirred at room temperature for 2 h, during which, the color changed from dark purple to red/brown. After 2 h. the solvent was removed under reduced pressure to yield [LFe3(PhPz)3OFeNO][OTf]2 as a dark red/brown solid. Yield 146 mg (73%). 1H NMR is identical to that observed for method A.
Reaction of [LFe3 (PhPz)3OFe(NO)][OTf] with CoCp*2
In the glovebox, to a rapid stirred solution of [LFe3(PhPz)3OFeNO][OTf] (20 mg, 0.012 mmol) in THF (3 mL), was added a suspension of decamethyl cobaltocene (CoCp*2; 5 mg, 0.015 mmol) in THF (1 mL). During the course of 2 h., the color of the solution changed gradually from red/brown to brown. The volatiles were removed under reduced pressure to yield a red/purple solid (18 mg). The 1H NMR of the crude material in CD2Cl2 was identical to that of [LFe3(PhPz)3OFe][OTf] in CD2Cl2 (see Figure S16 in the Supporting Information).
Supplementary Material
ACKNOWLEDGMENT
This research was supported by the California Institute of Technology and the NIH (R01-GM102687A). TA is a Sloan, Dreyfus, and Cottrell fellow. TA and G.de.R are grateful for a Camille & Henry Dreyfus Environmental Chemistry Fellowship. We thank Michael K. Takase and Lawrence M. Henling for assistance with crystallography. In addition, we would like to thank the anonymous referees for providing useful comments and suggestion.
Footnotes
ASSOCIATEDCONTENT
Synthetic procedures for [LFe3(PhPz)3OFe] and [LFe3(PhPz)3OFe][BF4]. Reactivity studies with complexes 6 and 8. Figures S1-S37 and Tables S1-S6. This material is available free of charge via the Internet at http://pubs.acs.org.
REFERENCES
- (1).(a) Dance I. Z. Anorg. Allg. Chem. 2015;641:91. [Google Scholar]; (b) Lubitz W, Ogata H, Rüdiger O, Reijerse E. Chem. Rev. 2014;114:4081. doi: 10.1021/cr4005814. [DOI] [PubMed] [Google Scholar]; (c) Solomon EI, Heppner DE, Johnston EM, Ginsbach JW, Cirera J, Qayyum M, Kieber-Emmons MT, Kjaergaard CH, Hadt RG, Tian L. Chem. Rev. 2014;114:3659. doi: 10.1021/cr400327t. [DOI] [PMC free article] [PubMed] [Google Scholar]; (d) Yano J, Yachandra V. Chem. Rev. 2014;114:4175. doi: 10.1021/cr4004874. [DOI] [PMC free article] [PubMed] [Google Scholar]; (e) Fontecilla-Camps JC, Amara P, Cavazza C, Nicolet Y, Volbeda A. Nature. 2009;460:814. doi: 10.1038/nature08299. [DOI] [PubMed] [Google Scholar]; (f) Ragsdale SW. Chem. Rev. 2006;106:3317. doi: 10.1021/cr0503153. [DOI] [PubMed] [Google Scholar]; (g) Holm RH, Kennepohl P, Solomon EI. Chem. Rev. 1996;96:2239. doi: 10.1021/cr9500390. [DOI] [PubMed] [Google Scholar]
- (2).McEvoy JP, Brudvig GW. Chem. Rev. 2006;106:4455. doi: 10.1021/cr0204294. [DOI] [PubMed] [Google Scholar]
- (3).(a) Umena Y, Kawakami K, Shen J-R, Kamiya N. Nature. 2011;473:55. doi: 10.1038/nature09913. [DOI] [PubMed] [Google Scholar]; (b) Ferreira KN, Iverson TM, Maghlaoui K, Barber J, Iwata S. Science. 2004;303:1831. doi: 10.1126/science.1093087. [DOI] [PubMed] [Google Scholar]
- (4).Kok B, Forbush B, McGloin M. Photochem. Photobiol. 1970;11:457. doi: 10.1111/j.1751-1097.1970.tb06017.x. [DOI] [PubMed] [Google Scholar]
- (5).(a) Shima S, Pilak O, Vogt S, Schick M, Stagni MS, Meyer-Klaucke W, Warkentin E, Thauer RK, Ermler U. Science. 2008;321:572. doi: 10.1126/science.1158978. [DOI] [PubMed] [Google Scholar]; (b) Volbeda A, Charon M-H, Piras C, Hatchikian EC, Frey M, Fontecilla-Camps JC. Nature. 1995;373:580. doi: 10.1038/373580a0. [DOI] [PubMed] [Google Scholar]
- (6).Dobbek H, Svetlitchnyi V, Gremer L, Huber R, Meyer O. Science. 2001;293:1281. doi: 10.1126/science.1061500. [DOI] [PubMed] [Google Scholar]
- (7).Hakulinen N, Kiiskinen L-L, Kruus K, Saloheimo M, Paananen A, Koivula A, Rouvinen J. Nat. Struct. Mol. Biol. 2002;9:601. doi: 10.1038/nsb823. [DOI] [PubMed] [Google Scholar]
- (8).(a) Darnault C, Volbeda A, Kim EJ, Legrand P, Vernede X, Lindahl PA, Fontecilla-Camps JC. Nat. Struct. Mol. Biol. 2003;10:271. doi: 10.1038/nsb912. [DOI] [PubMed] [Google Scholar]; (b) Doukov TI, Iverson TM, Seravalli J, Ragsdale SW, Drennan CL. Science. 2002;298:567. doi: 10.1126/science.1075843. [DOI] [PubMed] [Google Scholar]
- (9).(a) Ferguson-Miller S, Babcock GT. Chem. Rev. 1996;96:2889. doi: 10.1021/cr950051s. [DOI] [PubMed] [Google Scholar]; (b) Tsukihara T, Aoyama H, Yamashita E, Tomizaki T, Yamaguchi H, Shinzawa-Itoh K, Nakashima R, Yaono R, Yoshikawa S. Science. 1995;269:1069. doi: 10.1126/science.7652554. [DOI] [PubMed] [Google Scholar]
- (10).(a) Hoffman BM, Lukoyanov D, Dean DR, Seefeldt LC. Acc. Chem. Res. 2013;46:587. doi: 10.1021/ar300267m. [DOI] [PMC free article] [PubMed] [Google Scholar]; (b) Spatzal T, Aksoyoglu M, Zhang L, Andrade SLA, Schleicher E, Weber S, Rees DC, Einsle O. Science. 2011;334:940. doi: 10.1126/science.1214025. [DOI] [PMC free article] [PubMed] [Google Scholar]; (c) Fontecilla-Camps JC, Volbeda A, Cavazza C, Nicolet Y. Chem. Rev. 2007;107:4273. doi: 10.1021/cr050195z. [DOI] [PubMed] [Google Scholar]; (d) Hinnemann B, Nørskov J. Top. Catal. 2006;37:55. [Google Scholar]; (e) Eady RR. Coord. Chem. Rev. 2003;237:23. [Google Scholar]; (f) Einsle O, Tezcan FA, Andrade SLA, Schmid B, Yoshida M, Howard JB, Rees DC. Science. 2002;297:1696. doi: 10.1126/science.1073877. [DOI] [PubMed] [Google Scholar]; (g) Howard JB, Rees DC. Chem. Rev. 1996;96:2965. doi: 10.1021/cr9500545. [DOI] [PubMed] [Google Scholar]
- (11).Eady RR. Chem. Rev. 1996;96:3013. doi: 10.1021/cr950057h. [DOI] [PubMed] [Google Scholar]
- (12).(a) Tsui EY, Agapie T. Proc. Natl. Acad. Sci. U. S. A. 2013;110:10084. doi: 10.1073/pnas.1302677110. [DOI] [PMC free article] [PubMed] [Google Scholar]; (b) Herbert DE, Lionetti D, Rittle J, Agapie T. J. Am. Chem. Soc. 2013;135:19075. doi: 10.1021/ja4104974. [DOI] [PMC free article] [PubMed] [Google Scholar]; (c) Tsui EY, Tran R, Yano J, Agapie T. Nat. Chem. 2013;5:293. doi: 10.1038/nchem.1578. [DOI] [PMC free article] [PubMed] [Google Scholar]
- (13).(a) Garcia-Bosch I, Adam SM, Schaefer AW, Sharma SK, Peterson RL, Solomon EI, Karlin KD. J. Am. Chem. Soc. 2015;137:1032. doi: 10.1021/ja5115198. [DOI] [PMC free article] [PubMed] [Google Scholar]; (b) Citek C, Lin B-L, Phelps TE, Wasinger EC, Stack TDP. J. Am. Chem. Soc. 2014;136:14405. doi: 10.1021/ja508630d. [DOI] [PubMed] [Google Scholar]; (c) Kanady JS, Lin P-H, Carsch KM, Nielsen RJ, Takase MK, Goddard WA, Agapie T. J. Am. Chem. Soc. 2014;136:14373. doi: 10.1021/ja508160x. [DOI] [PMC free article] [PubMed] [Google Scholar]; (d) Taguchi T, Stone KL, Gupta R, Kaiser-Lassalle B, Yano J, Hendrich MP, Borovik AS. Chem. Sci. 2014;5:3064. doi: 10.1039/C4SC00453A. [DOI] [PMC free article] [PubMed] [Google Scholar]; (e) Liu T, DuBois DL, Bullock RM. Nat. Chem. 2013;5:228. doi: 10.1038/nchem.1571. [DOI] [PubMed] [Google Scholar]; (f) Camara JM, Rauchfuss TB. Nat. Chem. 2012;4:26. doi: 10.1038/nchem.1180. [DOI] [PMC free article] [PubMed] [Google Scholar]; (g) Citek C, Lyons CT, Wasinger EC, Stack TDP. Nat. Chem. 2012;4:317. doi: 10.1038/nchem.1284. [DOI] [PubMed] [Google Scholar]; (h) Hematian S, Siegler MA, Karlin KD. J. Am. Chem. Soc. 2012;134:18912. doi: 10.1021/ja3083818. [DOI] [PMC free article] [PubMed] [Google Scholar]; (i) McDonald AR, Van Heuvelen KM, Guo Y, Li F, Bominaar EL, Münck E, Que L. Angew. Chem. Int. Ed. 2012;51:9132. doi: 10.1002/anie.201203602. [DOI] [PMC free article] [PubMed] [Google Scholar]; (j) Kanady JS, Tsui EY, Day MW, Agapie T. Science. 2011;333:733. doi: 10.1126/science.1206036. [DOI] [PubMed] [Google Scholar]; (k) Seo MS, Kim NH, Cho K-B, So JE, Park SK, Clemancey M, Garcia-Serres R, Latour J-M, Shaik S, Nam W. Chem. Sci. 2011;2:1039. [Google Scholar]; (l) Harris TD, Betley TA. J. Am. Chem. Soc. 2011;133:13852. doi: 10.1021/ja2052655. [DOI] [PubMed] [Google Scholar]; (m) Do LH, Hayashi T, Moënne-Loccoz P, Lippard SJ. J. Am. Chem. Soc. 2010;132:1273. doi: 10.1021/ja909718f. [DOI] [PMC free article] [PubMed] [Google Scholar]; (n) Xue G, De Hont R, Münck E, Que L. Nat. Chem. 2010;2:400. doi: 10.1038/nchem.586. [DOI] [PMC free article] [PubMed] [Google Scholar]; (o) Bell SR, Groves JT. J. Am. Chem. Soc. 2009;131:9640. doi: 10.1021/ja903394s. [DOI] [PMC free article] [PubMed] [Google Scholar]; (p) Friedle S, Kodanko JJ, Morys AJ, Hayashi T, Moënne-Loccoz P, Lippard SJ. J. Am. Chem. Soc. 2009;131:14508. doi: 10.1021/ja906137y. [DOI] [PMC free article] [PubMed] [Google Scholar]
- (14).Tsui EY, Kanady JS, Agapie T. Inorg. Chem. 2013;52:13833. doi: 10.1021/ic402236f. [DOI] [PMC free article] [PubMed] [Google Scholar]
- (15).(a) Tsui EY, Kanady JS, Day MW, Agapie T. Chem. Commun. 2011;47:4189. doi: 10.1039/c0cc05608a. [DOI] [PubMed] [Google Scholar]; (b) Tsui EY, Day MW, Agapie T. Angew. Chem. Int. Ed. 2011;50:1668. doi: 10.1002/anie.201005232. [DOI] [PubMed] [Google Scholar]
- (16).(a) Matson EM, Park YJ, Fout AR. J. Am. Chem. Soc. 2014;136:17398. doi: 10.1021/ja510615p. [DOI] [PubMed] [Google Scholar]; (b) Zolnhofer EM, Käß M, Khusniyarov MM, Heinemann FW, Maron L, van Gastel M, Bill E, Meyer K. J. Am. Chem. Soc. 2014;136:15072. doi: 10.1021/ja508144j. [DOI] [PubMed] [Google Scholar]; (c) Anderson JS, Rittle J, Peters JC. Nature. 2013;501:84. doi: 10.1038/nature12435. [DOI] [PMC free article] [PubMed] [Google Scholar]; (d) Speelman AL, Lehnert N. Angew. Chem. Int. Ed. 2013;52:12283. doi: 10.1002/anie.201305291. [DOI] [PubMed] [Google Scholar]; (e) Bigi JP, Harman WH, Lassalle-Kaiser B, Robles DM, Stich TA, Yano J, Britt RD, Chang CJ. J. Am. Chem. Soc. 2012;134:1536. doi: 10.1021/ja207048h. [DOI] [PubMed] [Google Scholar]; (f) Piro NA, Lichterman MF, Harman WH, Chang CJ. J. Am. Chem. Soc. 2011;133:2108. doi: 10.1021/ja110798w. [DOI] [PubMed] [Google Scholar]; (g) Reithofer MR, Schrock RR, Müller P. J. Am. Chem. Soc. 2010;132:8349. doi: 10.1021/ja1008213. [DOI] [PMC free article] [PubMed] [Google Scholar]; (h) Lee Y, Mankad NP, Peters JC. Nat. Chem. 2010;2:558. doi: 10.1038/nchem.660. [DOI] [PMC free article] [PubMed] [Google Scholar]; (i) MacBeth CE, Golombek AP, Young VG, Yang C, Kuczera K, Hendrich MP, Borovik AS. Science. 2000;289:938. doi: 10.1126/science.289.5481.938. [DOI] [PubMed] [Google Scholar]; (j) Ray M, Golombek AP, Hendrich MP, Yap GPA, Liable-Sands LM, Rheingold AL, Borovik AS. Inorg. Chem. 1999;38:3110. [Google Scholar]; (k) Ray M, Golombek AP, Hendrich MP, Young VG, Borovik AS. J. Am. Chem. Soc. 1996;118:6084. [Google Scholar]; (l) Kol M, Schrock RR, Kempe R, Davis WM. J. Am. Chem. Soc. 1994;116:4382. [Google Scholar]
- (17).(a) Cotton FA, Wilkinson G, Murillo CA, Bochmann M. Advanced Inorganic Chemistry. 6th Vol. 12. Wiley; New York: 1999. [Google Scholar]; (b) Cotton FA, Murillo CA, Pascual I. Inorg. Chem. 1999;38:2746. doi: 10.1021/ic990007l. [DOI] [PubMed] [Google Scholar]; (c) Cotton FA, Daniels LM, Falvello LR, Matonic JH, Murillo CA, Wang X, Zhou H. Inorg. Chim. Acta. 1997;266:91. [Google Scholar]
- (18).Murali M, Nayak S, Costa JS, Ribas J, Mutikainen I, Turpeinen U, Clémancey M, Garcia-Serres R, Latour J-M, Gamez P, Blondin G, Reedijk J. Inorg. Chem. 2010;49:2427. doi: 10.1021/ic902360x. [DOI] [PubMed] [Google Scholar]
- (19).(a) Sutradhar M, Roy Barman T, Drew MGB, Rentschler E. J. Mol. Struct. 2013;1041:44. [Google Scholar]; (b) Sutradhar M, Carrella LM, Rentschler E. Eur. J. Inorg. Chem. 2012;2012:4273. [Google Scholar]; (c) Malassa A, Schulze B, Stein-Schaller B, Görls H, Weber B, Westerhausen M. Eur. J. Inorg. Chem. 2011;2011:1584. [Google Scholar]; (d) Jian F, Xiao H, Bai Z, Zhao P. J. Mater. Chem. 2006;16:3746. [Google Scholar]; (e) Cotton FA, Daniels LM, Jordan Iv GT, Murillo CA, Pascual I. Inorg. Chim. Acta. 2000;297:6. [Google Scholar]
- (20).(a) Lee SC, Lo W, Holm RH. Chem. Rev. 2014;114:3579. doi: 10.1021/cr4004067. [DOI] [PMC free article] [PubMed] [Google Scholar]; (b) Venkateswara Rao P, Holm RH. Chem. Rev. 2004;104:527. doi: 10.1021/cr020615+. [DOI] [PubMed] [Google Scholar]
- (21).(a) Chen L, Wang M, Gloaguen F, Zheng D, Zhang P, Sun L. Chem. Eur. J. 2012;18:13968. doi: 10.1002/chem.201201326. [DOI] [PubMed] [Google Scholar]; (b) Goddard CA, Long JR, Holm RH. Inorg. Chem. 1996;35:4347. doi: 10.1021/ic960052i. [DOI] [PubMed] [Google Scholar]; (c) Cecconi F, Ghilardi CA, Midollini S, Orlandini A, Zanello P. J. Chem. Soc. Dalton Trans. 1987:831. [Google Scholar]; (d) Trinh T, Teo BK, Ferguson JA, Meyer TJ, Dahl LF. J. Am. Chem. Soc. 1977;99:408. [Google Scholar]
- (22).(a) Powers TM, Betley TA. J. Am. Chem. Soc. 2013;135:12289. doi: 10.1021/ja405057n. [DOI] [PMC free article] [PubMed] [Google Scholar]; (b) Zhao Q, Harris TD, Betley TA. J. Am. Chem. Soc. 2011;133:8293. doi: 10.1021/ja2015845. [DOI] [PubMed] [Google Scholar]; (c) Welch EJ, Crawford NRM, Bergman RG, Long JR. J. Am. Chem. Soc. 2003;125:11464. doi: 10.1021/ja035962v. [DOI] [PubMed] [Google Scholar]
- (23).Clouston LJ, Siedschlag RB, Rudd PA, Planas N, Hu S, Miller AD, Gagliardi L, Lu CC. J. Am. Chem. Soc. 2013;135:13142. doi: 10.1021/ja406506m. [DOI] [PubMed] [Google Scholar]
- (24).(a) Scarborough CC, Sproules S, Weyhermüller T, DeBeer S, Wieghardt K. Inorg. Chem. 2011;50:12446. doi: 10.1021/ic201123x. [DOI] [PubMed] [Google Scholar]; (b) McDaniel AM, Tseng H-W, Damrauer NH, Shores MP. Inorg. Chem. 2010;49:7981. doi: 10.1021/ic1009972. [DOI] [PubMed] [Google Scholar]
- (25).Gutlich P, Eckhard B, Trautwein AX. Mössbauer Spectroscopy and Transition Metal Chemistry. Springer Berlin Heidelberg; 2011. [Google Scholar]
- (26).(a) Gouré E, Carboni M, Dubourdeaux P, Clémancey M, Balasubramanian R, Lebrun C, Bayle P-A, Maldivi P, Blondin G, Latour J-M. Inorg. Chem. 2014;53:10060. doi: 10.1021/ic501793v. [DOI] [PubMed] [Google Scholar]; (b) Lalia-Kantouri M, Papadopoulos, Christos D, Hatzidimitriou, Antonios G, Bakas T, Pachini S. Z. Anorg. Allg. Chem. 2010;636:531. [Google Scholar]; (c) Singh AK, Jacob W, Boudalis AK, Tuchagues J-P, Mukherjee R. Eur. J. Inorg. Chem. 2008;2008:2820. [Google Scholar]; (d) Chardon-Noblat S, Horner O, Chabut B, Avenier F, Debaecker N, Jones P, Pécaut J, Dubois L, Jeandey C, Oddou J-L, Deronzier A, Latour J-M. Inorg. Chem. 2004;43:1638. doi: 10.1021/ic030192+. [DOI] [PubMed] [Google Scholar]; (e) Schmitt W, Anson CE, Pilawa B, Powell AK. Z. Anorg. Allg. Chem. 2002;628:2443. [Google Scholar]; (f) Reynolds RA, Coucouvanis D. Inorg. Chem. 1998;37:170. [Google Scholar]
- (27).Reiff WM, Long GJ. In: Mossbauer Spectroscopy Applied to Inorganic Chemistry. Long GJ, editor. Vol. 1. Plenum Press; New York: 1984. p. 245. [Google Scholar]
- (28).Bertini I, Luchinat C, Rosato A. Solution NMR of Paramagnetic Molecules. Vol. 2. Elsevier; 2001. [Google Scholar]
- (29).McCleverty JA. Chem. Rev. 2004;104:403. doi: 10.1021/cr020623q. [DOI] [PubMed] [Google Scholar]
- (30).(a) Ignarro LJ. Nitric Oxide. 2ed Academic Press; San Diego: 2010. [Google Scholar]; (b) Wasser IM, de Vries S, Moënne-Loccoz P, Schröder I, Karlin KD. Chem. Rev. 2002;102:1201. doi: 10.1021/cr0006627. [DOI] [PubMed] [Google Scholar]; (c) Møller JKS, Skibsted LH. Chem. Rev. 2002;102:1167. doi: 10.1021/cr000078y. [DOI] [PubMed] [Google Scholar]; (d) Ignarro LJ. J. Physiol. Pharamacol. 2002;53:503. [PubMed] [Google Scholar]; (e) Culotta E, Koshland D. Science. 1992;258:1862. doi: 10.1126/science.1361684. [DOI] [PubMed] [Google Scholar]
- (31).(a) Tran CT, Williard PG, Kim E. J. Am. Chem. Soc. 2014;136:11874. doi: 10.1021/ja505415c. [DOI] [PubMed] [Google Scholar]; (b) Victor E, Lippard SJ. Inorg. Chem. 2014;53:5311. doi: 10.1021/ic500586g. [DOI] [PubMed] [Google Scholar]; (c) Harrop TC, Tonzetich ZJ, Reisner E, Lippard SJ. J. Am. Chem. Soc. 2008;130:15602. doi: 10.1021/ja8054996. [DOI] [PubMed] [Google Scholar]; (d) Scott MJ, Holm RH. Angew. Chem. 1993;105:621. [Google Scholar]
- (32).(a) Berto TC, Speelman AL, Zheng S, Lehnert N. Coord. Chem. Rev. 2013;257:244. [Google Scholar]; (b) Wright AM, Hayton TW. Comments Inorg. Chem. 2012;33:207. [Google Scholar]; (c) Hayton TW, Legzdins P, Sharp WB. Chem. Rev. 2002;102:935. doi: 10.1021/cr000074t. [DOI] [PubMed] [Google Scholar]
- (33).(a) Lu T-T, Chen C-H, Liaw W-F. Chem. Eur. J. 2010;16:8088. doi: 10.1002/chem.201000524. [DOI] [PubMed] [Google Scholar]; (b) Conradie J, Quarless DA, Hsu H-F, Harrop TC, Lippard SJ, Koch SA, Ghosh A. J. Am. Chem. Soc. 2007;129:10446. doi: 10.1021/ja0719982. [DOI] [PubMed] [Google Scholar]; (c) Davies SC, Evans DJ, Hughes DL, Konkol M, Richards RL, Sanders JR, Sobota P. J. Chem. Soc. Dalton Trans. 2002:2473. [Google Scholar]; (d) Hammes BS, Ramos-Maldonado D, Yap GPA, Liable-Sands L, Rheingold AL, Young VG, Borovik AS. Inorg. Chem. 1997;36:3210. doi: 10.1021/ic970124l. [DOI] [PubMed] [Google Scholar]; (e) Di Vaira M, Ghilardi CA, Sacconi L. Inorg. Chem. 1976;15:1555. [Google Scholar]; (f) Di Vaira M, Tarli M, Stoppioni P, Sacconi L. Cryst. Struc. Commun. 1975;4:653. [Google Scholar]
- (34).(a) Surawatanawong P, Sproules S, Neese F, Wieghardt K. Inorg. Chem. 2011;50:12064. doi: 10.1021/ic201565d. [DOI] [PubMed] [Google Scholar]; (b) Ghosh P, Stobie K, Bill E, Bothe E, Weyhermüller T, Ward MD, McCleverty JA, Wieghardt K. Inorg. Chem. 2007;46:522. doi: 10.1021/ic061874a. [DOI] [PubMed] [Google Scholar]; (c) McCleverty JA, Ratcliff B. J. Chem. Soc. A. 1970:1627. [Google Scholar]; (d) McCleverty JA, Atherton NM, Locke J, Wharton EJ, Winscom CJ. J. Am. Chem. Soc. 1967;89:6082. [Google Scholar]
- (35).Addison AW, Rao TN, Reedijk J, van Rijn J, Verschoor GC. J. Chem. Soc. Dalton Trans. 1984:1349. [Google Scholar]
- (36).Enemark JH, Feltham RD. Coord. Chem. Rev. 1974;13:339. [Google Scholar]
- (37).(a) Creutz SE, Peters JC. J. Am. Chem. Soc. 2014;136:1105. doi: 10.1021/ja4114962. [DOI] [PMC free article] [PubMed] [Google Scholar]; (b) Rittle J, Peters JC. Proc. Natl. Acad. Sci. U. S. A. 2013;110:15898. doi: 10.1073/pnas.1310153110. [DOI] [PMC free article] [PubMed] [Google Scholar]
- (38).(a) Olabe JA. Dalton Trans. 2008:3633. doi: 10.1039/b803153c. [DOI] [PubMed] [Google Scholar]; (b) Roncaroli F, Videla M, Slep LD, Olabe JA. Coord. Chem. Rev. 2007;251:1903. [Google Scholar]
- (39).(a) Franz KJ, Lippard SJ. J. Am. Chem. Soc. 1999;121:10504. [Google Scholar]; (b) Schneider JL, Carrier SM, Ruggiero CE, Young VG, Tolman WB. J. Am. Chem. Soc. 1998;120:11408. [Google Scholar]
- (40).Huang C-Y, Doyle AG. J. Am. Chem. Soc. 2012;134:9541. doi: 10.1021/ja3013825. [DOI] [PubMed] [Google Scholar]
- (41).APEX-II . Version 2 User Manual, M86-E01078, Bruker Analytical X-ray Systems. Madison, WI: Jun, 2006. [Google Scholar]
- (42).Sheldrick GM. “SADABS (version 2008/1): Program for Absorption Correction for Data from Area Detector Frames”. University of Göttingen; 2008. [Google Scholar]
- (43).Sheldrick GM. Acta Crystallogr., Sect. A: Found. Crystallogr. 2008;64:112. doi: 10.1107/S0108767307043930. [DOI] [PubMed] [Google Scholar]
Associated Data
This section collects any data citations, data availability statements, or supplementary materials included in this article.