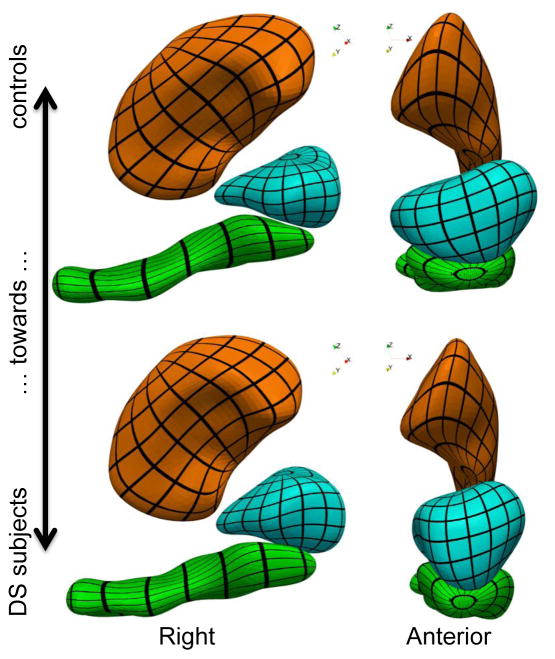
Figure 3.
Most discriminative deformation axis showing the anatomical features that are the most specific to the DS subjects as compared to the controls. Differences are amplified, since the distance between the two configurations is twice the distance between the means (black grids are mapped to the surface for visualization only)

