Abstract
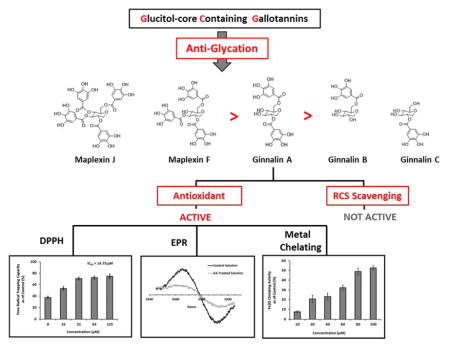
Glucitol-core containing gallotannins (GCGs) are polyphenols containing galloyl groups attached to a 1,5-anhydro-D-glucitol core, which is uncommon among naturally occurring plant gallotannins. GCGs have only been isolated from maple (Acer) species, including the red maple (Acer rubrum), a medicinal plant which along with the sugar maple (Acer saccharum), are the major sources of the natural sweetener, maple syrup. GCGs are reported to show antioxidant, α-glucosidase inhibitory, and antidiabetic effects, but their antiglycating potential is unknown. Herein, the inhibitory effects of five GCGs (containing 1–4 galloyls) on the formation of advanced glycation end-products (AGEs) were evaluated by MALD-TOF mass spectroscopy, and the BSA-fructose, and G.K. peptide-ribose assays. The GCGs showed superior activities compared to the synthetic antiglycating agent, aminoguanidine (IC50 15.8–151.3 vs. > 300 μM) at the early, middle, and late stages of glycation. Circular dichroism data revealed that the GCGs were able to protect the secondary structure of BSA protein from glycation. The GCGs did not inhibit AGEs formation by the trapping of reactive carbonyl species, namely, methylglyoxal, but showed free radical scavenging activities in the DPPH assay. The free radical quenching properties of the GCGs was further confirmed by electron paramagnetic resonance spectroscopy using ginnalin A (contains 2 galloyls) as a representative GCG. In addition, this GCG chelated ferrous iron, an oxidative catalyst of AGEs formation, supporting a potential antioxidant mechanism of antiglycating activity for these polyphenols. Therefore, GCGs should be further investigated for their antidiabetic potential given their antioxidant, α-glucosidase inhibitory, and antiglycating properties.
Keywords: maple (Acer), glucitol-core containing gallotannins (GCGs), advanced glycation endproducts (AGEs), free radical scavenging, metal chelating
Graphic Abstract
1 Introduction
Glycation is a non-enzymatic process for the post-translational modification of structural and circulating proteins including collagen, nerve proteins, hemoglobin, and albumin.1, 2 Glycation can occur spontaneously in vitro and in vivo wherein protein side chains react with open-chain tautomers of carbohydrates to form glycation adducts, referred to as advanced glycation endproducts (AGEs).2 The formation of AGEs is suggested to accelerate in vivo typically under conditions such as hyperglycemia, atherosclerosis, and aging.2 Increasing data have shown that the formation of AGEs profoundly alters the structures and functions of proteins,3 and elevates chronic oxidative stress and inflammation due to their interactions with specific transmembrane receptors.4, 5 Therefore, AGEs are believed to be critically involved in many health disorders including diabetic complications, certain cancers, and neurodegenerative diseases.2, 6–8
Chemically, the formation of AGEs involves a series of complex reactions which is initiated by the reversible condensation of reducing sugars and proteins to form glycosylamines. Glycosylamines can be converted to more stable Amadori products, which further degrade into α-dicarbonyl compounds such as methylglyoxal, glyoxal, and 3-deoxyglucosone.2, 9 These reactive carbonyl species (RCS), also knowns as AGE precursors, are much more reactive than reducing sugars.10, 11 By continuing to react with proteins, these RCS irreversibly bind to the side chains of proteins, induce protein crosslinks, and lead to the formation of AGEs. While in general, RCS play a critical step in AGEs formation, glycation can also be catalyzed by free radicals and transition metals through oxidation.12, 13 Therefore, compounds with antiglycating properties have been found to reduce AGEs formation mainly through one, or a combination of: RCS trapping, free radical scavenging, and/or metal chelating properties.13–15
Many synthetic agents, such as aminoguanidine (AG), have been developed as antiglycating agents but due to severe adverse effects, they have failed in clinical studies.16 This has led to the search for antiglycating agents from natural products including medicinal plants and plant-derived foods which could potentially be integrated as dietary intervention strategies with fewer adverse effects.17–21 Among natural products, a promising chemical class of antiglycating agents are gallotannins,22, 23 plant polyphenols which contain differing numbers and locations of galloyl groups attached to a glucose core. While the glucose core is most common in naturally occurring gallotannins, only members of the maple (Acer) genus are reported to produce gallotannins containing a 1,5-anhydro-D-glucitol core.24–29 These glucitol-core containing gallotannins (GCGs) have been reported to show antioxidant, α-glucosidase inhibitory, and antidiabetic effects in both in vitro and in animal studies,30–32 but to date, no data is available on their potential antiglycating effects.
Our laboratory has been involved in a research program focused on identifying bioactive compounds from maple food products, namely, maple sap 33 and maple syrup,34–36 as well as the major maple species, namely, the sugar maple (Acer saccharum) and red maple (Acer rubrum), used for the production of these food materials.27–29, 37 During these studies we have isolated a series of GCGs including several new gallotannins, containing different numbers and locations of galloyl groups on the 1,5-anhydro-D-glucitol core, with potent antioxidant and α-glucosidase inhibitory properties.38, 39 Animal studies from our group using a GCG-enriched red maple bark extract,26 as well as from others27,28 support the antidiabetic effects of GCGs but to date, the antiglycating effects of these compounds, and accompanying SAR studies, have not been reported. Therefore, in the current study we sought to evaluate the antiglycating effects, and potential mechanisms of action, of a panel of five GCGs [containing 1 to 4 galloyls for structure activity related (SAR) observations]. This is the first study to evaluate the inhibitory effects of GCGs on AGEs formation.
2 Materials and methods
2.1 Chemicals
Bovine serum albumin (BSA), D-fructose, D-ribose, methylglyoxal (MGO), L-alanine, aminoguanidine hydrochloride (AG), 1,2-phenylenediamine (PD), 2,3-dimethylquinoxaline (DQ), α-cyano-4-hydroxy-cinnamic acid, 2,2-diphenyl-1-picrylhydrazyl (DPPH), trifluoroacetic acid (TFA), ascorbic acid, 2,2′-bipyridyl, sodium dodecyl sulfate, and iron (II) sulfate were purchased from Sigma-Aldrich Chemical Co. (St. Louis, MO, USA). G.K. peptide was purchased from Bachem Americas, Inc. (Torrance, CA, USA) and all HPLC solvents were purchased from Thermo Fisher Scientific (Rockford, IL, USA).
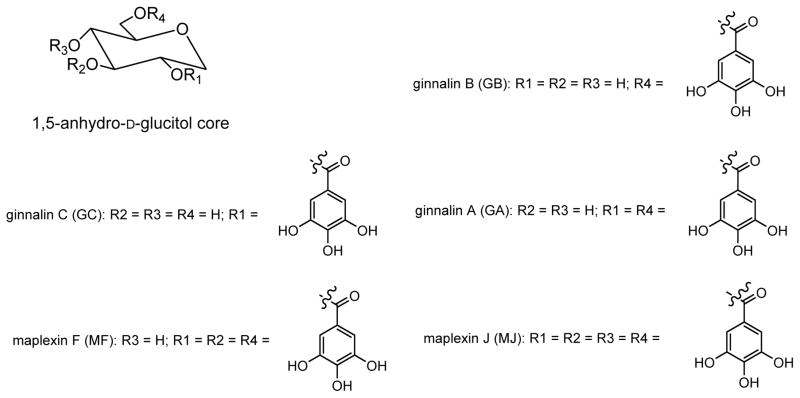
2.2 Glucitol-Core Containing Gallotannins (GCGs; Figure 1)
Figure 1.
Chemical structures of glucitol-core containing gallotannins (GCGs): ginnalin A (GA), ginnalin B (GB), ginnalin C (GC), maplexin F (MF), and maplexin J (MJ).
The GCGs, ginnalin B (GB; contains 1 galloyl), ginnalin C (GC; contains 1 galloyl), ginnalin A (GA; contains 2 galloyls), and maplexin F (MF; contains 3 galloyls) were isolated from the red maple (Acer rubrum) species as previously reported.27,28 Maplexin J (MJ; contains 4 galloyls) was synthesized in our laboratory as previously reported.39 The structures of the GCGs are shown in Figure 1.
2.3 Preparation of BSA-Fructose AGEs Samples
All solutions for the analyses of the early and middle stages of glycation were prepared in 0.2 M phosphate buffer, pH 7.2 under sterile conditions. 10 mg/mL BSA and 100 mM D-fructose were adopted as the model protein and glycating agent, respectively, following McPherson’s methods.10, 11, 40 BSA at a concentration of 10 mg/mL can readily undergo glycation with 100 mM D-fructose to generate stable glycation products detectable by fluorescence. Moreover, BSA was selected as the protein of interest due to its marked structural homology with human serum albumin (HSA) while D-fructose was selected because it can be biosynthesized in vivo and has a higher reactivity than D-glucose. 40
Blank solutions included either BSA alone (10 mg/mL) or D-fructose alone (100 mM) while control solutions included 10 mg/mL BSA and 100 mM D-fructose to generate BSA-fructose reaction mixtures. The BSA-fructose mixtures were then treated with different amount of GCGs, resulting in final concentrations of 10, 20, 50, 100, and 300 μM of each GCGs. The above concentrations of GCGs were selected because they were optimal for the calculation of IC50 values based on our preliminary studies (data not shown). BSA-fructose mixtures incubated with the equivalent concentrations of aminoguanidine (AG), served as positive controls. All samples were prepared in triplicate and incubated at 37 °C in a shaking water bath for a total duration of 21 days. During incubation, aliquots from the reaction mixtures were taken on day 3 for MALDI-TOF analyses, day 7 for CD analyses, and day 21 for intrinsic fluorescence assay and HPLC analyses.
2.4 MALDI-TOF Mass Spectrometry
Intact BSA samples were analyzed on a Bruker Autoflex matrix assisted laser desorption ionization time-of-flight (MALDI-TOF) mass spectrometer (Bruker Inc., Billerica, MA, USA). Prior to analyses, samples were purified by C4 ZipTip pipettes, (EMD Millipore Co., Billerica, MA, USA). Each purified protein sample (0.7 μL) was mixed with 0.7 μL saturated α-cyano-4-hydroxy-cinnamic acid in 50% aqueous acetonitrile solution containing 0.05% TFA. Spectra were acquired in linear TOF mode with a 550 nsec delay in the m/z range from 25,000 to 75,000. Analyses of data were performed using FlexAnalysis and ClinProTools software (Bruker Daltonics Inc., Billerica, MA, USA).
2.5 Intrinsic Fluorescence Spectroscopy
Prior to analyses, 200 μL of each sample was transferred to 96-well black reading plates (Corning Inc., Corning, NY, USA). The formation of fluorescent glycated products was measured with a Spectra Max M2 spectrometer (Molecular Devices, Sunnyvale, CA, USA) at excitation and emission wavelengths of 340 nm and 435 nm, respectively. The above excitation and emission values are optimal for detecting BSA AGEs and were determined by fixed excitation and emission scans.
2.6 High Performance Liquid Chromatography with Fluorescent Detection (HPLC-FL)
AGEs from BSA-fructose reaction mixtures incubated for 21 days were quantified using HPLC-FL according to previously reported methods.17, 41 Each HPLC analyses was performed using a Hitachi Elite LaChrom system consisting of a L2130 pump, L-2200 auto sampler, a L-2455 Fluorescent Detector (FL), and a L-2455 Diode Array Detector (DAD), all operated by EZChrom Elite software. A C18 reverse phase HPLC column (5 μm × 4.6 mm × 150 mm, 415 Å pore size) from Shodex (New York, NY, USA) was used to separate the AGEs species. Mobile phase A contained 99% H2O: 1% ACN with 0.1% TFA while mobile phase B consisted of 5% H2O: 95% ACN with 0.1% TFA. A linear gradient consisted 20% (0 min) to 60% (25 min) of mobile phase B in mobile phase A at a constant flow rate of 1.0 mL/min. The AGEs species were monitored at excitation and emission wavelengths of 340 nm and 435 nm, respectively.
2.7 G.K. Peptide-Ribose Assays
The GK-peptide-ribose assay was performed with slight modifications from the previously published method.42 Briefly, G.K. peptide (40 mg/mL) was incubated with 100 mM D-ribose in 100 mM sodium phosphate buffer, pH 7.0 and the test samples were added at final concentrations ranging from 0–300 μM. After incubation for 6 hrs, the fluorescence of the mixture was read at 340 nm and 420 nm for excitation and emission wavelengths, respectively, using a Spectra Max M2 spectrometer (Molecular Devices, Sunnyvale, CA, USA).
2.8 Circular Dichroism (CD) Experiments
The CD analyses were performed on a Jasco J-720 spectropolarimeter (Jasco, Tokyo, Japan) using quartz cuvettes with 1 mm path length. Interpretation of results was performed by the Spectra Manager software. Prior to spectral acquisition, the concentration of BSA in each sample was adjusted to 1 mg/mL using 0.2 M phosphate buffer, pH 7.2. The CD spectral signatures were obtained in the far-ultraviolet region (190–250 nm) and a total of 8 consecutive scans were taken for each sample. The bandwidth in each case was adjusted to 1 nm.
2.9 Methylglyoxal (MGO) Trapping Assay
The trapping capacity of reactive carbonyl species (RCS), namely, methylglyoxal (MGO), by the GCGs was evaluated as previously reported.42 Briefly, a mixture of MGO (5 mM), PD (derivatization reagent, 20 mM), and DQ (internal standard, 5 mM) were freshly prepared in phosphate buffer (0.1 M, pH 7.4). GCGs (0.25 mL of 50–500 μM) were individually added to MGO (0.25 mL of 5 mM) and incubated at 37 °C for 1 hr after which PD and DQ (0.125 mL, each) were then added. After further incubation at room temperature for 30 mins, 2-methylquinoxaline (2-MQ), the derivative of residual MGO, was quantified by HPLC-DAD. The percentage decrease of MGO was calculated using the following equation: % MGO decrease = [1 − (MGO amounts in solution with tested sample/MGO amounts in control solution)] x 100%.
2.10 2,2-Diphenyl-1-Picrylhydrazyl (DPPH) Free Radical Scavenging Assay
The free radical scavenging capacity of GA was evaluated by the 2,2-diphenyl-1-picrylhydrazyl (DPPH) assay using our previously reported method.43 Briefly, GA (5 – 125 μM) solutions and DPPH (0.20 mM) were prepared in 50% aqueous methanol. The reaction containing GA and DPPH solution (100 μL each) was conducted at room temperature for 25 min in a 96-well plate. The absorbance was then read at 517 nm using a micro-plate reader (SpectraMax M2, Molecular Devices Corp., Sunnyvale, CA, USA). The scavenging capacity of the sample was calculated as follows: [(ΔAcontrol − ΔAsample)/ΔAcontrol] × 100%.
2.11 Electron Paramagnetic Resonance (EPR) Experiment
The EPR spectrometer was a Bruker EMX (Bruker Inc., Billerica, MA, USA) operating at 9.8 Ghz with 100 khz modulation frequency. Spectra were recorded using WIN-EPR software. Typical instrumental settings were as follows: microwave power, 20.8 mW; modulation amplitude, 1 G (radical identification) or 10 G (quenching experiments); time constant, 81.9 ms; sweep time 41.9 seconds. Reaction conditions were as previously reported with minor modifications.44 Each reaction mixture contained 0.2 M MGO and 0.2 M L-alanine in 0.5 M carbonate buffer, pH 9.0. Treatment included 100 μM GA or 100 μM ascorbic acid, which served as the positive control. For analyses, 100 μL of each solution was transferred into a bent 0.86 folded Teflon capillary (Zeus Scientific Inc., Somerville, NJ, USA) and inserted into a quartz tube in the EPR cavity.
2.12 Ferrous (II) Chelating Assay
Fe2+ chelating activity was measured following a previously reported method using the 2,2′-bipyridyl competing assay.45 Test samples included varying concentrations of GA ranging from 10–100 μM in 1% sodium dodecyl sulfate. Prior to analyses, 0.2 mL of each sample was added into 0.2 mL of FeSO4 solution (1 mM). The mixture was then mixed with 0.8 mL of 0.1% 2,2′-bipyridyl solution (in 0.2 M HCl), 0.4 mL of 10% (w/v) hydroxylamine HCL and 2.5 mL of ethanol. Absorbance was obtained at wavelength of 524 nm with an UltroSpec 2100 instrument (Biochrom Ltd, Cambridge, UK). Chelating activity was calculated by the following equation: % inhibition = [(ΔAcontrol − ΔAtreatment)/ΔAcontrol] × 100%. Each value was expressed as mean ± SD from triplicate experiments.
2.13 Statistics
Unless otherwise stated, all assays were carried out with three individual experiments under the same conditions. The values in the BSA-fructose fluorescence, G.K. peptide, DPPH, and ferrous (II) assays were all expressed as mean ± SD from triplicate experiments (n=3). For the HPLC, CD, and EPR analyses, representative spectra from triplicate samples revealed no significant differences.
3 Results and Discussion
3.1 GCGs Inhibited Early Stage Glycation
To date, although GCGs are reported to show antioxidant, α-glucosidase inhibitory, and antidiabetic effects, these compounds have not been evaluated for their antiglycating potential. Therefore, we initiated this study to evaluate the anti-AGEs effects of a panel of 5 GCGs (containing 1–4 galloyls for SAR observations) at the individual stages of AGEs formation. The GCGs contained 1 galloyl (ginnalin B, GB; ginnalin C, GC), 2 galloyls (ginnalin A, GA), 3 galloyls (maplexin F, MF), and a maximum of 4 galloyls (maplexin J, MJ) attached to a 1,5-anhydro-D-glucitol core. The structures of the GCGs are shown in Figure 1.
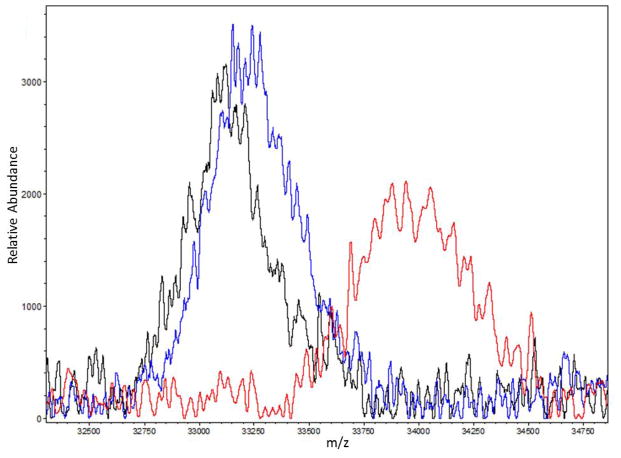
At the early stage of glycation, reducing sugars react with the free amino groups of proteins to form Amadori products. The level of early glycation of a protein can be analyzed by MALDI-TOF mass spectrometry and the numbers of sugar adducts can be calculated based on the mass shift of the glycated protein compared to its native non-glycated counterpart.16, 17 Herein, we used BSA as the model protein in the BSA-fructose glycation reaction to evaluate the inhibitory effects of the GCGs (at 100 μM) on early stage glycation. As shown in Figure 2 and Table 1, in the absence of GCGs, glycated BSA had the most pronounced mass shift of 1660 Da which equals nine D-fructose adducts on the protein. Among all of the GCGs, GA and MJ treated BSA showed the lowest glycation levels, yielding a mass shift of 160 Da which represents only one D-fructose molecule binding to the protein. MF treated samples exhibited an m/z increase of 400 Da which was equivalent to approximately two sugar adducts. GB and GC also decreased BSA mass shift from 1660 Da to 1020 Da and 900 Da respectively, which suggest the condensation of approximately six and five D-fructose adducts, respectively (spectra shown in Supplementary Information Figure S1). However, the positive control, AG (at an equivalent concentration of 100 μM), generated an m/z shift similar to that of the control solution indicating that AG had minimal effect on early stage glycation, which was in agreement with our previously published data.17
Figure 2.
MALDI-TOF spectra of the +2 ion (z=2) of native BSA solution (black trace), BSA solution incubated with D-fructose (red trace) and the BSA-fructose mixture treated with 100 μM GA (blue trace). Prior analyses, all samples were incubated in dark for 72 hrs at 37 °C.
Table 1.
The mass shifts and possible numbers of D-fructose adducted to the glycated BSA and GCGs treated BSA.
| Treatment | m/z value of +2 ion (Da) | Shifted m/z value (Δ Da) | Number of D-fructose |
|---|---|---|---|
| Native BSA | 33,130 | - | - |
| BSA-fructose | 33,960 | +1660 | 9 |
| BSA-fructose + GB | 33,640 | +1020 | 6 |
| BSA-fructose + GC | 33,580 | +900 | 5 |
| BSA-fructose + GA | 33,210 | +160 | 1 |
| BSA-fructose + MF | 33,330 | +400 | 2 |
| BSA-fructose + MJ | 33,210 | +160 | 1 |
3.2 Effects of GCGs on Middle Stage Glycation
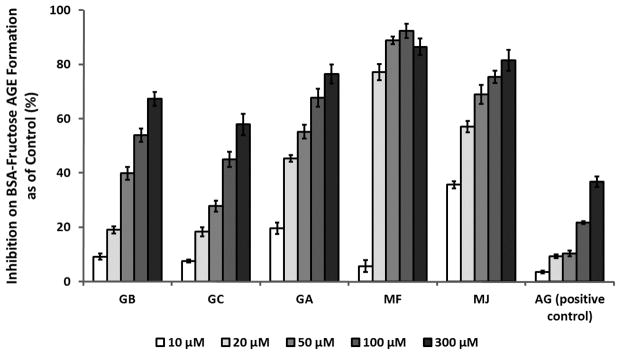
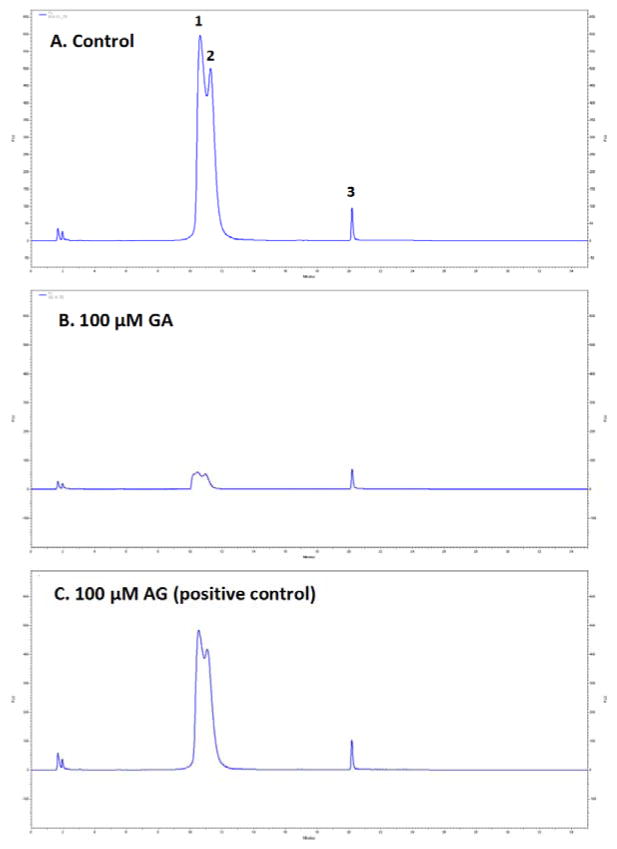
The inhibitory effects of GCGs on middle stage glycation were evaluated using intrinsic fluorescence and HPLC-FL in the BSA-fructose glycation reaction. In the middle stage of glycation, RCS are generated from the degradation of Amadori intermediates2 and form fluorescent AGEs with the protein. The characteristic fluorescence of these products allows for the detection and the measurement of middle stage AGEs formation.17, 37 After incubation with D-fructose for 21 days, BSA solutions generated a significant increase from 0 to 1431.2 in fluorescence (FU) at excitation and emission wavelengths of 340 and 435 nm, respectively, indicating the formation of fluorescent AGEs. However, in solutions co-treated with GCGs or AG (the positive control), the increases were less pronounced ranging from 109.4 to 1381.7 FU. The inhibitory effects of each treatment were then calculated by comparing the fluorescence intensities of the treated solutions with that of the control, as shown in Figure 3. All treatments, including GCGs and the positive control, AG, reduced the formation of fluorescent AGEs in a concentration dependent manner. In all of the treated samples, the highest inhibitory effect was observed at a concentration of 300 μM while the lowest effect was seen at 10 μM. Among the GCGs, MF showed the most potent antiglycating activity at concentrations of 20 μM and higher, followed by MJ, GA, GB, and GC. For example, at a concentration of 100 μM, MF reduced AGEs formation by 92.4% while MJ, GA, GB, and GC showed inhibitory effects of 75.4, 67.7, 53.7 and 44.9%, respectively. The IC50 values of MF and MJ were 15.8 and 17.4 μM, respectively, followed by GA (30.7 μM), GB (83.2 μM), and GC (151.3 μM). Moreover, all the GCGs had superior inhibitory activities compared to the positive control, AG, which failed to reach 50% inhibition at the highest concentration of 300 μM (36.8% inhibition). Next, the fluorescent AGEs produced from middle stage glycation were separated by reversed phase HPLC and monitored by HPLC-FL. Figures 4A, B, and C, show the representative AGEs HPLC-FL profiles of BSA-fructose control (A), BSA-fructose solution treated with 100 μM GA (B) or 100 μM AG (C, positive control), respectively. In Figure 4A, the HPLC-FL chromatogram of the BSA-fructose incubation mixture showed three appreciable peaks, indicating the generation of fluorescent AGEs. However, the peak intensities of the GA treated group were significantly reduced as shown in Figure 4B. Moreover, all of the GCGs (at a concentration of 100 μM) were able to reduce AGEs formation as monitored by HPLC-FL. The quantitative analyses of the fluorescent AGEs formation in each treatment are summarized in Table 2. Compared to the control, MJ was the most active GCG which reduced AGEs formation by 95.4%, followed by MF (92.8%), GA (90.1%), GB (89.5%) and GC (86.2%). The positive control, AG (14.4%), at an equivalent concentration of 100 μM, also reduced AGEs formation but this was not as pronounced as the GCGs.
Figure 3.
Inhibitory effects of different concentrations of GB, GC, GA, MF, MJ and the positive control, aminoguanidine (AG), on the formation of AGEs monitored by intrinsic fluorescence at excitation and emission wavelengths of 340 nm and 435 nm, respectively. All readings were obtained at fluorescence unit (FU) from reaction mixtures incubated for 21 days. Solutions containing GCGs or AG alone served as blanks for each sample. The fluorescence reading of each treatment sample was then compared to the intensity of the control solution. Inhibitory level was defined as % inhibition = [(FU of control sample – FU of treated sample)/FU of control sample] X 100%. Results are shown as means ± SD from three independent experiments.
Figure 4.
HPLC-FL profiles of BSA AGEs (peaks 1, 2 and 3) monitored at excitation and emission wavelengths of 340 nm and 435 nm, respectively. Control solution consisted of BSA and D-fructose alone (A) and treatments included 100 μM GA (B) and 100 μM positive control AG (C). The HPLC-FL profile of the blank solution containing BSA only yielded no fluorescence signal suggesting the absence of AGE products in the blank sample (data not shown). Repeated chromatographic analyses of reaction mixtures by HPLC-FL revealed no significant differences in the elution profiles of any of the AGEs peaks in each of the solutions.
Table 2.
The area under curve (AUC) value for fluorescent AGEs eluted by reversed phase HPLC-FL.
| Treatment | Total AGEs AUC | Relative AGEs AUC (as of control) % |
|---|---|---|
| BSA-fructose (Control) | 94360870 | 100 |
| BSA-fructose + GB | 9922547 | 10.5 |
| BSA-fructose + GC | 13093224 | 13.9 |
| BSA-fructose + GA | 6801585 | 7.2 |
| BSA-fructose + MF | 9433965 | 10.0 |
| BSA-fructose + MJ | 4105905 | 4.4 |
| BSA-fructose + AG* | 13376419 | 14.4 |
AG (aminoguanidine) served as positive control.
3.3 GCGs Inhibited AGEs Formation at Late Stage Glycation
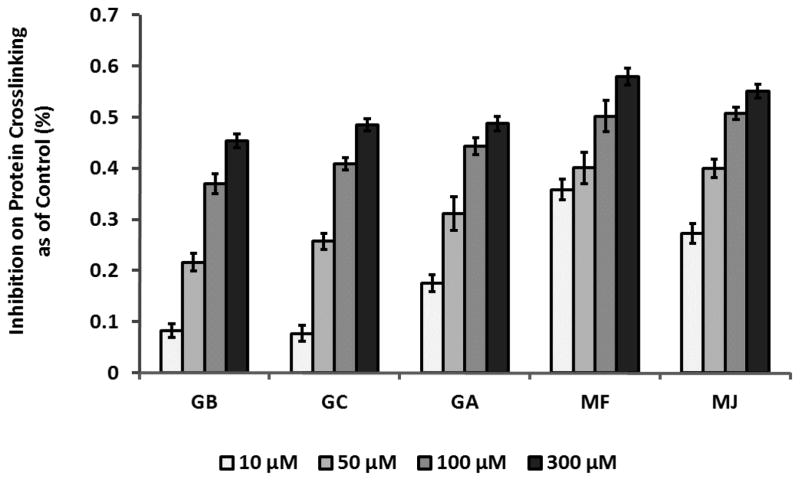
G.K. peptide, a synthetic peptide containing a lysine residue was co-incubated with D-ribose in the presence or absence of the GCGs. This assay was adopted to evaluate the inhibitory effects of the GCGs against the cross-linking of N-acetylglycyllysine methyl ester and D-ribose which typically occurs in the late stage of AGEs formation. The fluorescence of G.K. peptide-ribose co-incubated with the GCGs during this protein glycation course were determined and compared with that of G.K. peptide-ribose alone. The inhibitory activities of the GCGs were concentration dependent as shown in Figure 5. The GCGs showed inhibition of peptide-ribose cross-linking at 5 μM (inhibition rate < 20%, data not shown) which increased at concentrations > 10 μM. For example, MF, the most active GCG, showed inhibitory effects of 40.1%, 50.2% and 57.9% at concentrations of 50 μM, 100 μM, and 300 μM, respectively. Apart from MF, all of the other GCGs, at 300 μM, reduced half of peptide-ribose glycation (inhibition ranged from 48.5% to 57.9%), whereas the positive control, AG, only showed 6.8% and 63.1% inhibition of late stage glycation at 300 μM and 5000 μM, respectively.
Figure 5.
GCGs inhibited AGEs crosslinks formation at the final stage of glycation by G.K. peptide-ribose assay. G.K. peptide (40 mg/mL) was co-incubated with ribose (100 mM) for 9 hrs in the absence or presence of GCGs (at concentrations from 5 to 300 μM). Fluorescence was measured at excitation and emission wavelengths of 340 nm and 420 nm, respectively. Results are shown in means ± SD from three independent tests.
At all stages of glycation, the GCGs displayed antiglycating effects in a concentration-dependent manner. As shown by MALDI-TOF analyses, GCGs prevented the condensation of reducing sugars with protein side chains, which typically occurs at the early stage of glycation 2. At concentrations ranging from 10 to 300 μM, GCGs significantly reduced fluorescent AGEs formation (by 5.6 to 92.4%) and showed inhibitory potencies superior to that of the positive control, AG, at equivalent concentrations. Moreover, the GCGs decreased the levels of protein crosslinks (by 7.7 to 57.9%), indicating that they may also inhibit late stage glycation. Among the GCGs, the SAR analyses revealed that MF and MJ, which have the highest numbers of galloyls (3 and 4, respectively), exhibited the strongest antiglycating activities. GA which contains 2 galloyls, showed inhibition potency slightly lower than that of MF and MJ but superior to the GCGs which contain 1 galloyl only, namely, GB and GC.
3.4 GCGs Attenuated Conformational Changes of BSA
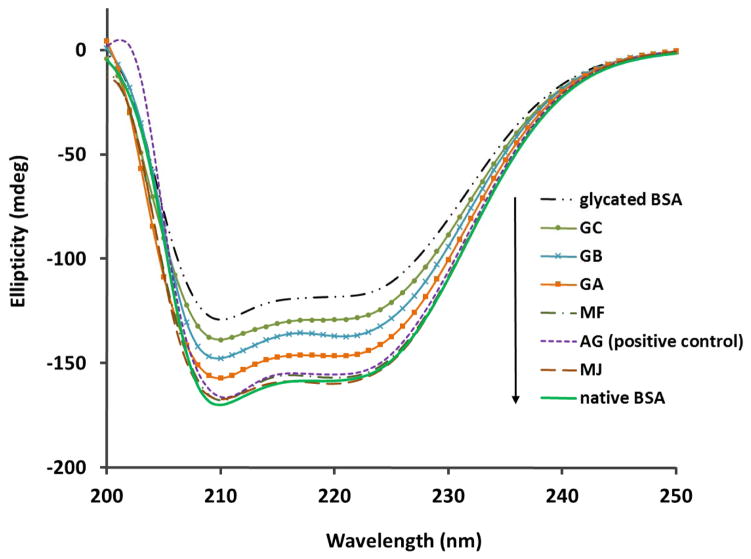
For globular proteins such as albumin, AGEs formation can cause conformational alteration of their structures, resulting in a decrease of protein α-helical content and an increase in β-sheet structures. To evaluate if the GCGs were able to maintain protein structure during glycation, the CD spectra of glycated BSA, native BSA, and BSA treated with GCGs, were obtained and compared, as shown in Figure 6. The conformational compositions of α helix and β strand were calculated and summarized in Table 3. In agreement with literature 17, native BSA consisted of 67.3% α-helical structures, which drastically decreased to 34.5% in glycated solution. However, in all of the GCGs treated samples, the changes in BSA secondary structures were less pronounced. Quantitative analyses of the spectra (Table 3) demonstrated that the GCGs and positive control AG (at 100 μM) maintained BSA α-helical structures in the order of MJ (67.7%) > AG (positive control, 64.8%) > MF (63.9%) > GA (59.3%) > GB (42.8%) > GC (40.2%).
Figure 6.
CD spectra of native BSA, BSA glycated with D-fructose for 7 days, and BSA-fructose mixtures treated with 100 μM GCGs or 100 μM AG (positive control).
Table 3.
Secondary structures (α-Helix and β-sheet) of native BSA, glycated BSA, and GCGs treated BSA.
| Secondary structures | native BSA | glycated BSA | GB | GC | GA | MF | MJ | AG* |
|---|---|---|---|---|---|---|---|---|
| α-Helix (%) | 67.3 | 34.5 | 42.8 | 40.2 | 59.3 | 63.9 | 67.7 | 64.8 |
| β-Sheet (%) | 7.7 | 21.0 | 15.1 | 16.5 | 10.2 | 9.4 | 9.0 | 9.4 |
AG (aminoguanidine) served as positive control.
3.5 GCG Scavenged Free Radicals but Not RCS
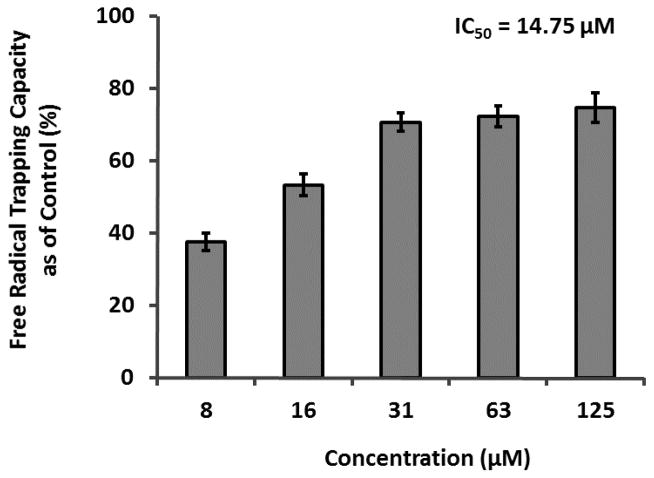
In order to explore the mechanisms of AGEs inhibition, we selected GA as a representative GCG to evaluate its RCS (namely, MGO) trapping capacity. GA (at concentrations ranging from 50 – 500 μM) was inactive in the MGO trapping assay (See Figure S2 in Online Supporting Material) and therefore, was evaluated for free radical scavenging capacity in the DPPH assay. As shown in Figure 7, GA (from 7.8 to 125 μM) scavenged 37.5 to 74.6% of free radicals, respectively, with an IC50 value of 14.75 μM.
Figure 7.
Free radical scavenging activities of GA in the DPPH assay. Each experiment was conducted in triplicate and all data were expressed in mean ± SD (n=3).
3.6 Direct Scavenging of Radicals by GCG Analyzed by EPR
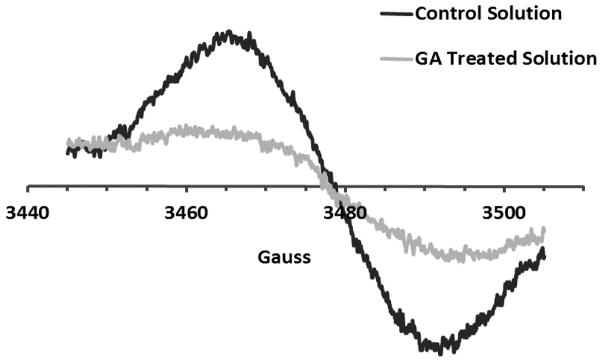
In order to rapidly produce verifiable yields of free radicals, MGO was reacted with L-alanine to produce free radical species typically seen in the course of protein glycation.44 Yim et. al. have identified the product of this reaction as a cross linked, carbon centered radical. The product was monitored by electron paramagnetic resonance (EPR) spectroscopy. For modulation amplitude of 1 G, a multi-line spectrum was detectable within about three minutes (see Supplementary Information Figure S3) which closely matched the results obtained by Yim et al.44 Signal intensity increased for about 10 minutes and then decreased. Blank solutions containing either MGO or GA alone did not produce a detectable signal confirming that the radical species are generated from the reaction solely between MGO and L-alanine. When the reaction mixture containing MGO and L-alanine was co-treated with 100 μM GA, there was a significant reduction in EPR signal intensity. Because of the complexity of the radical spectrum and to minimize background noise, comparative experiments were conducted with increased modulation amplitude of 10 G as shown in Figure 8. For the particular reaction shown in the figure, the integrated intensity was reduced to about half in the presence of GA. These observations confirmed that GA not only scavenges free radicals in the DPPH assay, but also quenches the radical species generated from the glycation of MGO and L-alanine. No significant decrease in EPR signal was observed for ascorbic acid, the positive control.
Figure 8.
EPR assay on reaction mixtures containing 0.2 M MGO and 0.2 M L-alanine in 0.5 M carbonate buffer, pH 9.0. Control solution included MGO and L-alanine alone while treatment consisted of MGO-alanine mixture co-treated with 100 μM GA.
3.7 Chelating of GCG with Ferrous (II)
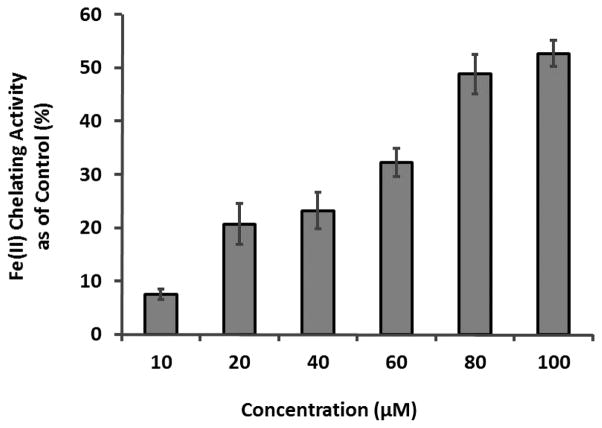
Besides free radical trapping capacity, metal chelating activity could also contribute to the antiglycating effects of GCGs since metal ions can serve as catalysts for the formation of AGEs during oxidation. Therefore, different concentrations of GA (10 – 100 μM) were evaluated for its chelating activity on Fe (II), as shown in Figure 9. Fe (II) could bind to 2,2′-bipyridyl to form complexes which are detectable at 524 nm.28 GA competitively binds to Fe (II), thereby reducing the formation of the complexes which results in a decrease in the absorbance at 524 nm. The metal chelating activity of GA was calculated by comparing the absorbance of treated samples with the control solution of Fe (II) alone. Based on the calculation, the most pronounced decrease was observed with 100 μM GA, which reduced Fe (II) content by 52.66 % followed by 80 μM GA (48.76 %), 60 μM GA (32.19 %), 40 μM GA (23.18 %), and 20 μM GA (20.66 %). This data supported the hypothesis that GCGs show an antioxidant mechanism, in part, due to their metal chelating capacity, in their overall anti-AGEs effects.
Figure 9.
The chelating effect of different concentrations of GA on ferrous (II) measured by 2,2′-bipyridyl competing assay. The absorbance was obtained at 524 nm in arbitrary unit (AU) and the reading of each GA treated samples were compared to control solution in the absence of GA. Chelating activity was calculated by the following equation: % inhibition = [(ΔAcontrol − ΔAtreatment)/ΔAcontrol] × 100%. Each value was expressed as means ± SD from triplicate experiments (n=3).
4 Conclusion
In summary, we evaluated five GCGs (containing 1–4 galloyls) for their antiglycating activity at the early, middle, and late stages of AGEs formation. The SAR studies revealed that the GCGs which contained more than 1 galloyl, namely, GA, MF, and MJ, were more potent than the mono-galloylated GCGs (GB and GC). Thus, increasing the number of galloyl groups results in increasing antiglycating activities among the GCGs. The GCGs did not scavenge RCS bur showed an antioxidant mechanism of inhibitory effect which was supported by the free radical scavenging (DPPH assay) and EPR data as well as metal chelating activity (Ferrous II 2,2′-bipyridyl assay). Therefore, the findings from the current study, as well as previously published animal data,30–32 support further investigations of these natural products for their antidiabetic potential given their antioxidant, α-glucosidase inhibitory, and antiglycating properties.
Supplementary Material
Acknowledgments
HM was financially supported by the Omar Magnate Foundation Fellowship. The spectroscopic data acquired from instruments located in the RI-INBRE core facility were obtained from Grant # P20RR016457 from the National Center for Research Resources (NCRR), a component of the National Institutes of Health (NIH).
Abbreviations
- GCGs
glucitol-core containing gallotannins
- GA
ginnalin A
- GB
ginnalin B
- GC
ginnalin C
- MF
maplexin F
- MJ
maplexin J
- AG
aminoguanidine
- BSA
bovine serum albumin
- AGEs
advanced glycation endproducts
- RCS
reactive carbonyl species
- MGO
methylglyoxal
- ROS
reactive oxygen species
- HPLC
high performance liquid chromatography
- FL
Fluorescent detection
- MALDI-TOF MS
matrix assisted laser desorption ionization time-of-flight mass spectrometry
- CD
circular dichroism
- EPR
electron paramagnetic resonance
- SAR
structure-activity relationship
Footnotes
Conflicts of interest
The authors have declared no conflicts of interest.
References
- 1.Genuth S, Sun W, Cleary P, Sell DR, Dahms W, Malone J, Sivitz W, Monnier VM D. S. C. A. S. Group. Diabetes. 2005;54:3103–3111. doi: 10.2337/diabetes.54.11.3103. [DOI] [PMC free article] [PubMed] [Google Scholar]
- 2.Singh R, Barden A, Mori T, Beilin L. Diabetologia. 2001;44:129–146. doi: 10.1007/s001250051591. [DOI] [PubMed] [Google Scholar]
- 3.Rondeau P, Bourdon E. Biochimie. 2011;93:645–658. doi: 10.1016/j.biochi.2010.12.003. [DOI] [PubMed] [Google Scholar]
- 4.Soro-Paavonen A, Watson AMD, Li J, Paavonen K, Koitka A, Calkin AC, Barit D, Coughlan MT, Drew BG, Lancaster GI, Thomas M, Forbes JM, Nawroth PP, Bierhaus A, Cooper ME, Jandeleit-Dahm KA. Diabetes. 2008;57:2461–2469. doi: 10.2337/db07-1808. [DOI] [PMC free article] [PubMed] [Google Scholar]
- 5.Bierhaus A, Humpert PM, Morcos M, Wendt T, Chavakis T, Arnold B, Stern DM, Nawroth PP. J Mol Med (Berl) 2005;83:876–886. doi: 10.1007/s00109-005-0688-7. [DOI] [PubMed] [Google Scholar]
- 6.Ishiguro H, Nakaigawa N, Miyoshi Y, Fujinami K, Kubota Y, Uemura H. Prostate. 2005;64:92–100. doi: 10.1002/pros.20219. [DOI] [PubMed] [Google Scholar]
- 7.Srikanth V, Maczurek A, Phan T, Steele M, Westcott B, Juskiw D, Münch G. Neurobiol Aging. 2011;32:763–777. doi: 10.1016/j.neurobiolaging.2009.04.016. [DOI] [PubMed] [Google Scholar]
- 8.Ahmad J, Alam K. RSC Advances. 2015;5:63605–63614. [Google Scholar]
- 9.Ramasamy R, Yan SF, Schmidt AM. Cell. 2006;124:258–260. doi: 10.1016/j.cell.2006.01.002. [DOI] [PubMed] [Google Scholar]
- 10.Sadowska-Bartosz I, Galiniak S, Bartosz G. Molecules. 2014;19:18828–18849. doi: 10.3390/molecules191118828. [DOI] [PMC free article] [PubMed] [Google Scholar]
- 11.Sadowska-Bartosz I, Galiniak S, Bartosz G. Molecules. 2014;19:4880–4896. doi: 10.3390/molecules19044880. [DOI] [PMC free article] [PubMed] [Google Scholar]
- 12.Finotti P, Pagetta A, Ashton T. Eur J Biochem. 2001;268:2193–2200. doi: 10.1046/j.1432-1327.2001.02134.x. [DOI] [PubMed] [Google Scholar]
- 13.Price DL, Rhett PM, Thorpe SR, Baynes JW. J Biol Chem. 2001;276:48967–48972. doi: 10.1074/jbc.M108196200. [DOI] [PubMed] [Google Scholar]
- 14.Rahbar S, Figarola JL. Arch Biochem Biophys. 2003;419:63–79. doi: 10.1016/j.abb.2003.08.009. [DOI] [PubMed] [Google Scholar]
- 15.Vlassopoulos A, Lean M, Combet E. Free Radic Biol Med. 2013;60:318–324. doi: 10.1016/j.freeradbiomed.2013.03.010. [DOI] [PubMed] [Google Scholar]
- 16.Thornalley PJ. Arch Biochem Biophys. 2003;419:31–40. doi: 10.1016/j.abb.2003.08.013. [DOI] [PubMed] [Google Scholar]
- 17.Peng X, Ma J, Chen F, Wang M. Food & Function. 2011;2:289–301. doi: 10.1039/c1fo10034c. [DOI] [PubMed] [Google Scholar]
- 18.Wu CH, Huang SM, Lin JA, Yen GC. Food & Function. 2011;2:224–234. doi: 10.1039/c1fo10026b. [DOI] [PubMed] [Google Scholar]
- 19.Chinchansure AA, Korwar AM, Kulkarni MJ, Joshi SP. RSC Advances. 2015;5:31113–31138. [Google Scholar]
- 20.Verzelloni E, Tagliazucchi D, Del Rio D, Calani L, Conte A. Food Chem. 2011;124:1430–1435. [Google Scholar]
- 21.Vlassopoulos A, Lean M, Combet E. Food & Function. 2014;5:2646–2655. doi: 10.1039/c4fo00568f. [DOI] [PubMed] [Google Scholar]
- 22.Ma H, Liu W, Frost L, Wang L, Kong L, Dain JA, Seeram NP. Mol Biosyst. 2015;11:1338–1347. doi: 10.1039/c4mb00722k. [DOI] [PubMed] [Google Scholar]
- 23.Lee J, Jang DS, Kim NH, Lee YM, Kim J, Kim JS. Biol Pharm Bull. 2011;34:443–446. doi: 10.1248/bpb.34.443. [DOI] [PubMed] [Google Scholar]
- 24.Bate-Smith EC. Phytochemistry. 1977;16:1421–1426. [Google Scholar]
- 25.Haddock EA, Gupta RK, Al-Shafi SMK, Haslam E, Magnolato D. J Chem Soc, Perkin Trans 1. 1982:2515–2524. doi: 10.1039/P19820002515. [DOI] [Google Scholar]
- 26.Hatano T, Hattori S, Ikeda Y, Shingu T, Okuda T. Chem Pharm Bull. 1990;38:1902–1905. [Google Scholar]
- 27.Wan C, Yuan T, Li L, Kandhi V, Cech NB, Xie M, Seeram NP. Bioorg Med Chem Lett. 2012;22:597–600. doi: 10.1016/j.bmcl.2011.10.073. [DOI] [PubMed] [Google Scholar]
- 28.Yuan T, Wan C, Liu K, Seeram NP. Tetrahedron. 2012;68:959–964. [Google Scholar]
- 29.Zhang Y, Ma H, Yuan T, Seeram NP. Nat Prod Commun. 2015;10:1409–1412. [PubMed] [Google Scholar]
- 30.Seeram NP, Xu J, Li L, Slitt A. Med Health RI. 2012;95:283–284. [PMC free article] [PubMed] [Google Scholar]
- 31.Honma A, Koyama T, Yazawa K. Food Chem. 2010;123:390–394. [Google Scholar]
- 32.Honma A, Koyama T, Yazawa K. J Enzyme Inhib Med Chem. 2011;26:176–180. doi: 10.3109/14756366.2010.486795. [DOI] [PubMed] [Google Scholar]
- 33.Yuan T, Li L, Zhang Y, Seeram NP. J Funct Foods. 2013;5:1582–1590. [Google Scholar]
- 34.Li L, Seeram NP. J Agric Food Chem. 2010;58:11673–11679. doi: 10.1021/jf1033398. [DOI] [PubMed] [Google Scholar]
- 35.Li L, Seeram NP. J Agric Food Chem. 2011;59:7708–7716. doi: 10.1021/jf2011613. [DOI] [PMC free article] [PubMed] [Google Scholar]
- 36.Li L, Seeram NP. J Funct Foods. 2011;3:125–128. [Google Scholar]
- 37.Yuan T, Wan C, González-Sarrías A, Kandhi V, Cech NB, Seeram NP. J Nat Prod. 2011;74:2472–2476. doi: 10.1021/np200678n. [DOI] [PubMed] [Google Scholar]
- 38.González-Sarrías A, Li L, Seeram NP. Phytother Res. 2012;26:995–1002. doi: 10.1002/ptr.3677. [DOI] [PubMed] [Google Scholar]
- 39.Ma H, Wang L, Niesen DB, Cai A, Cho BP, Tan W, Gu Q, Xu J, Seeram NP. RSC Advances. 2015;5:107904–107915. doi: 10.1039/C5RA19014B. [DOI] [PMC free article] [PubMed] [Google Scholar]
- 40.McPherson JD, Shilton BH, Walton DJ. Biochemistry. 1988;27:1901–1907. doi: 10.1021/bi00406a016. [DOI] [PubMed] [Google Scholar]
- 41.Liu W, Cohenford MA, Frost L, Seneviratne C, Dain JA. Int J Nanomed. 2014;9:5461–5469. doi: 10.2147/IJN.S70777. [DOI] [PMC free article] [PubMed] [Google Scholar]
- 42.Liu W, Ma H, Frost L, Yuan T, Dain JA, Seeram NP. Food & Function. 2014;5:2996–3004. doi: 10.1039/c4fo00538d. [DOI] [PubMed] [Google Scholar]
- 43.Zhang L, Tu ZC, Yuan T, Ma H, Niesen DB, Wang H, Seeram NP. Nat Prod Commun. 2015;10:1977–1980. [PubMed] [Google Scholar]
- 44.Yim HS, Kang SO, Hah YC, Chock PB, Yim MB. J Biol Chem. 1995;270:28228–28233. doi: 10.1074/jbc.270.47.28228. [DOI] [PubMed] [Google Scholar]
- 45.Yamaguchi F, Ariga T, Yoshimura Y, Nakazawa H. J Agric Food Chem. 2000;48:180–185. doi: 10.1021/jf990845y. [DOI] [PubMed] [Google Scholar]
Associated Data
This section collects any data citations, data availability statements, or supplementary materials included in this article.


