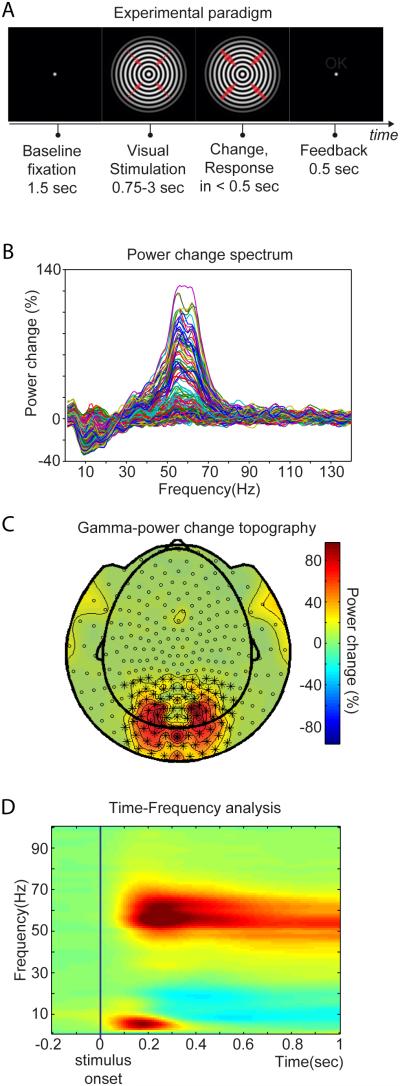
Figure 1. Experimental paradigm and visually induced changes in MEG signal power in frequency, space and time.
(A) Experimental paradigm. The fixation period was followed by the presentation of a circular sine-wave grating, centered at the fixation point and contracting towards its center. At a random moment between 0.75 and 3 s after stimulus onset, velocity increased, which was reported by the subjects with their right index finger. Thicker red arrows indicate the speed change. (B) Spectrum of power change during stimulation versus baseline (−0.5 to −0.2 sec). Each line represents the average across subjects for one MEG sensor. (C) Sensor-level topography of power change from (B) in the frequency range of 40 to 75 Hz. (D) Average power change as a function of time and frequency for selected sensors over occipito-parietal areas, shown with * in (C). Color bar applies to (C) and (D).

